Rating: HOLD
| Metric | Value |
|---|---|
| Current Price | $563 |
| Triangulated Fair Value | $740 |
| 12-mo Scenario PWEV | $587 |
| Implied Return | +31% |
| Forward P/E | 17.9x |
| Market Cap | $1.24T |
| 52-Week Range | $520 – $794 |
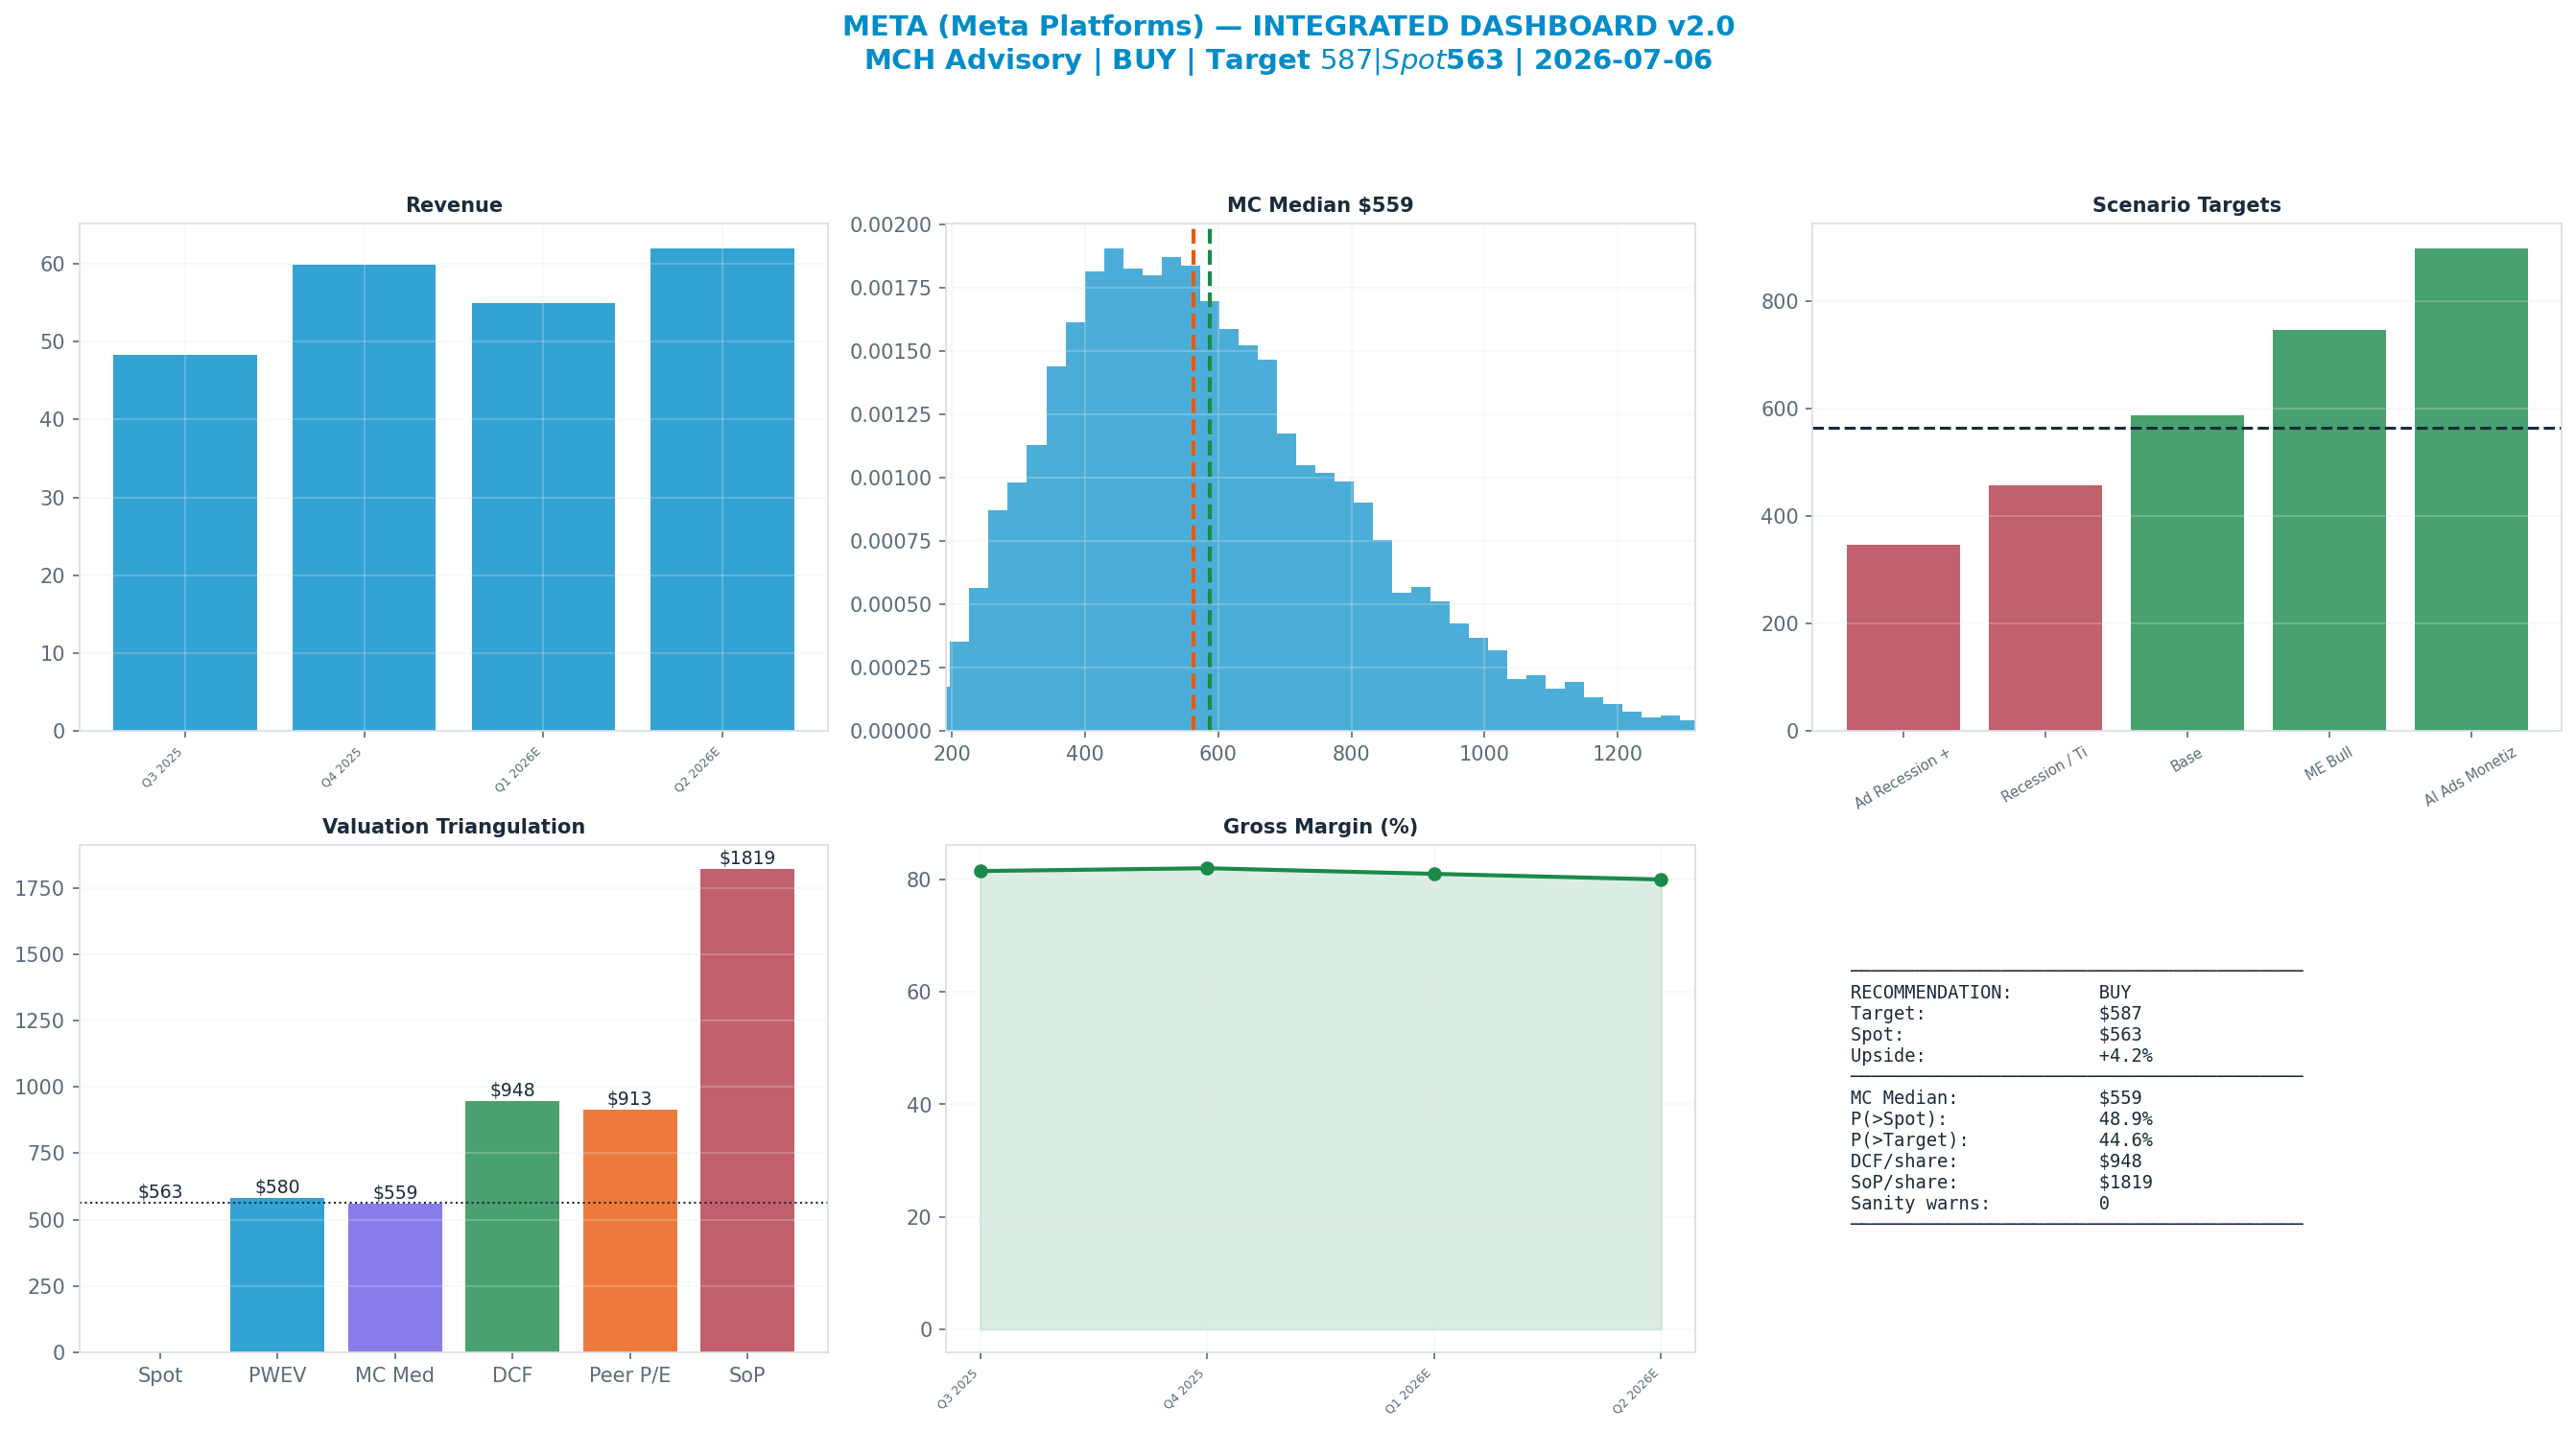
Methodology: Valuation triangulated across five independent anchors — Monte Carlo (Student-t + regime switching), an independent DCF, peer re-rating, a sum-of-parts, and a scenario-weighted PWEV. Figures reconciled to mch_weekly_run live prices. Each chart below sits with the part of the thesis it evidences.
Investment Thesis
The bull case — 'AI Ads Monetize' (10% weight) — targets $880, +56% vs spot. It needs the multiple to hold or expand.
The dashboard below is the whole argument on one page: spot ($563) against each valuation anchor, the scenario tree, technicals and the options-implied move.
Anti-Thesis (The Real Bear Case)
The structural case — 'Ad Recession + RL Blow-Out' (20%) — targets $340, -40% vs spot. This sits below the 52-week low — a genuine structural impairment, not a mild pullback.
Key Debate
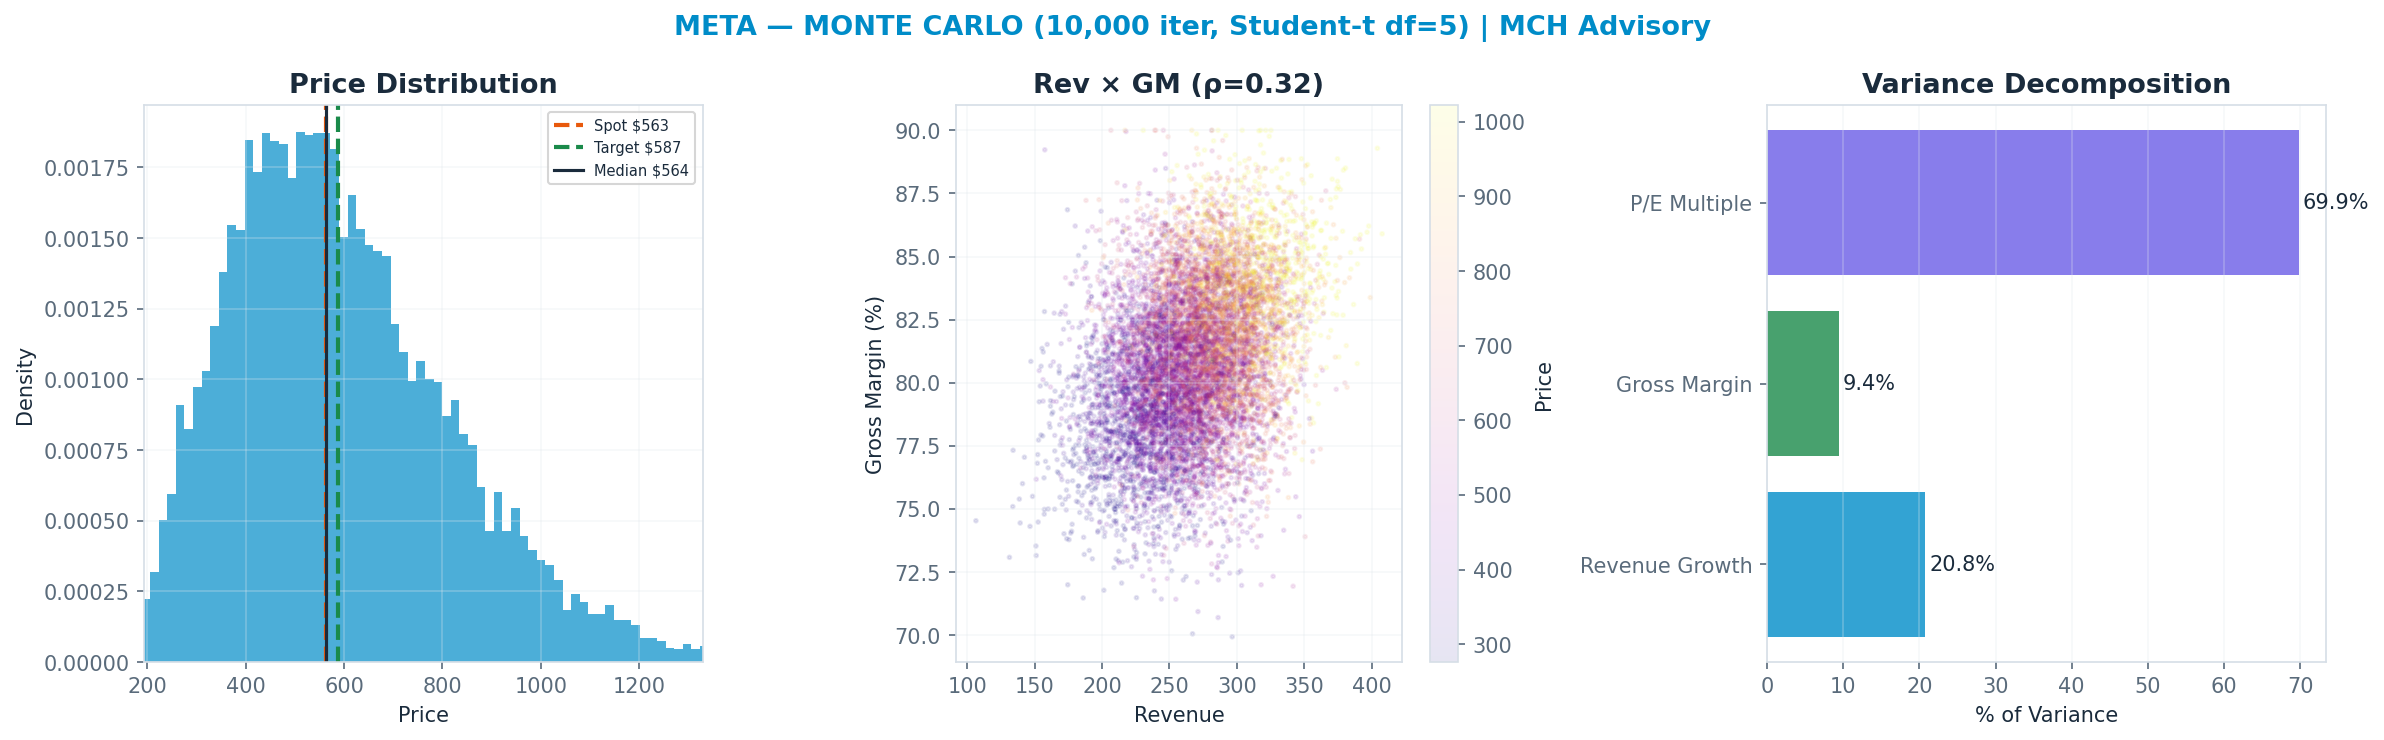
P/E Multiple explains 70% of Monte Carlo outcome variance — i.e. value is set by the multiple the market will pay, a rate/sentiment regime bet as much as an earnings bet.
Earnings-Call Disconfirmation & Sentiment
Derived signals from the MCH market-data store (Alpha Vantage transcripts + news). Quantitative tone only — a disconfirmation flag, not a substitute for reading the call.
Management vs analyst tone (2026Q1): management +0.56 vs analyst floor +0.00 → delta +0.56 (n=16 mgmt / 9 Q&A; 82th pctile across the S&P book, z +1.0).
Flag: TYPICAL — management-vs-analyst tone within the normal cross-sectional range.
| Quarter | Mgmt | Analyst | Delta |
|---|---|---|---|
| 2026Q1 | +0.56 | +0.00 | +0.56 |
| 2025Q4 | +0.59 | +0.36 | +0.23 |
| 2025Q3 | +0.44 | +0.23 | +0.21 |
| 2025Q2 | +0.51 | +0.07 | +0.44 |
News (last 365d, 1000 articles): avg ticker sentiment +0.14 (bullish 8% / bearish 2%)
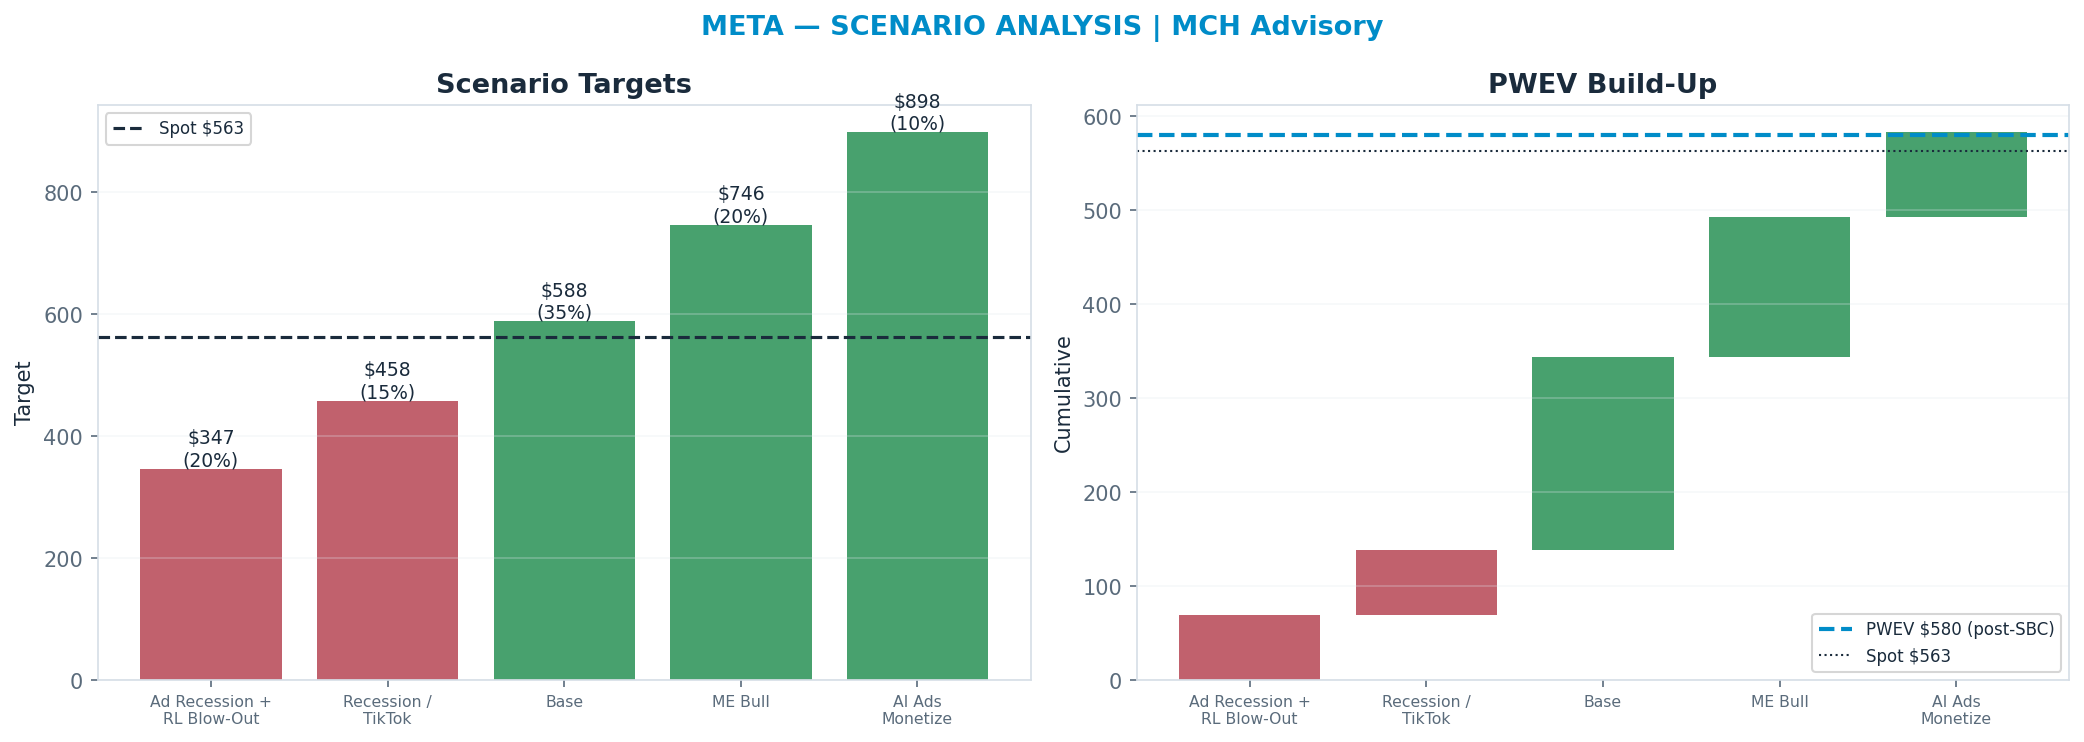
Scenario Analysis
The tree runs from a structural 'Ad Recession + RL Blow-Out' downside ($340) to a 'AI Ads Monetize' bull case ($880); the probability-weighted blend (PWEV $587) is +4% versus spot.
| Scenario | Probability | Target | Return |
|---|---|---|---|
| Ad Recession + RL Blow-Out | 20% | $340 | -40% |
| Recession / TikTok | 15% | $460 | -18% |
| Base | 35% | $620 | +10% |
| ME Bull | 20% | $740 | +31% |
| AI Ads Monetize | 10% | $880 | +56% |
| Probability-Weighted (PWEV, after SBC dilution) | — | $587 | +4% |
SBC charge: scenario targets are gross per-share prices; the PWEV is reduced by one year of stock-based-compensation dilution (0.5% of shares, on SBC ≈ 7% of revenue), trimming the gross PWEV of $590 to $587 (-0.5%). SBC is charged once, as dilution — never also deducted from FCF.
Scenario rationale — what each probability buys (the driver path behind every target):
- Ad Recession + RL Blow-Out (20%, $340). An ad recession cuts FoA revenue growth to roughly flat-to-low-single-digits while Reality Labs and AI capex losses keep expanding (capex committed ahead of revenue). Operating margin compresses toward the high-20s as fixed cost and D&A outrun a weak top line, and the multiple de-rates to ~11x as the market refuses to fund an uncapped, founder-controlled spend. This is the structural-impairment case — a target well below the 52-week low. Drivers — foa_growth: ~0-3%; rl_loss: widens to ~$22B+; op_margin: ~28%; multiple: ~11x.
- Base (35%, $620). FoA compounds mid-teens on AI-improved engagement and targeting (Advantage+, signal-loss recovery), op margin holds near 50% as ad scale offsets rising AI D&A, and RL loss stays bounded ~$18-20B as a tolerated option premium. The multiple normalizes to ~17x on demonstrated ad durability and contained spend. Drivers — foa_growth: ~15%; rl_loss: ~$19B; op_margin: ~49%; multiple: ~17x.
- ME Bull (20%, $740). Reality Labs / wearables optionality starts to pay off — Ray-Ban Meta glasses scale and AR/agents create a credible new compute platform — while FoA stays healthy. The RL loss narrows as hardware volume builds, reinvestment is seen as visionary rather than wasteful, and the multiple expands to ~22x. Drivers — foa_growth: ~17%; rl_loss: narrows toward ~$12B; op_margin: ~51%; multiple: ~22x.
- AI Ads Monetize (10%, $880). AI inflects the ad business directly — Advantage+ and generative ad tooling lift conversion and price-per-ad, business-messaging and Meta AI begin to monetize at scale, and the capex build is vindicated with rising incremental ROIC. FoA re-accelerates above 20%, operating leverage expands margins, and the multiple re-rates to ~24x. Drivers — foa_growth: >20%; ai_ad_uplift: inflects; op_margin: >52%; multiple: ~24x.
Valuation Triangulation
Five anchors — but read them with their basis in mind. The Monte Carlo, the DCF terminal, and the peer re-rate all key off a market multiple, so they are not fully independent; only the discounted cash flows themselves are genuinely multiple-free. The discipline is to read the spread and weight the cash-based view, not to treat five numbers as five independent votes.
| Method | Basis | Fair Value | vs Spot |
|---|---|---|---|
| Monte Carlo median (Student-t + regime) | multiple | $564 | +0% |
| Sum-of-Parts | multiple | $868 | +54% |
| Peer P/E re-rate | multiple | $913 | +62% |
| Peer EV/Revenue re-rate | multiple | $677 | +20% |
| Scenario PWEV | multiple | $587 | +4% |
| DCF (5-year + terminal) | cash flow + terminal × | $870 | +54% |
| Triangulated (weighted) | — | $740 | +31% |
peer P/E re-rate excluded from the weighted blend — diverges >55% from the Monte-Carlo / scenario core. For a high-leverage equity the per-share DCF (enterprise value less large net debt) is hypersensitive to the terminal multiple; a peer re-rate across heterogeneous margins is apples-to-oranges. Shown above for reference; the blend leans on the multiple-discipline and scenario anchors.
Rating vs blend — the key debate. The rating tracks the multiple-discipline fair value (Monte Carlo $564 + scenario PWEV $587, ≈ spot); the weighted blend $740 (+31%) sits above it because the cash-flow DCF ($870) is materially more optimistic than the market multiple. Whether the current multiple is justified is the central question for this name — and the principal upside risk to the rating.
Monte Carlo — the distribution, not a point
10,000 paths, Student-t shocks (fat tails) with a regime-switching overlay. The median lands at $564 and 50% of paths finish above spot. The variance decomposition shows the p/e multiple is the dominant swing factor (70% of variance). Value is a multiple bet: fundamentals move the answer far less than the rating does.
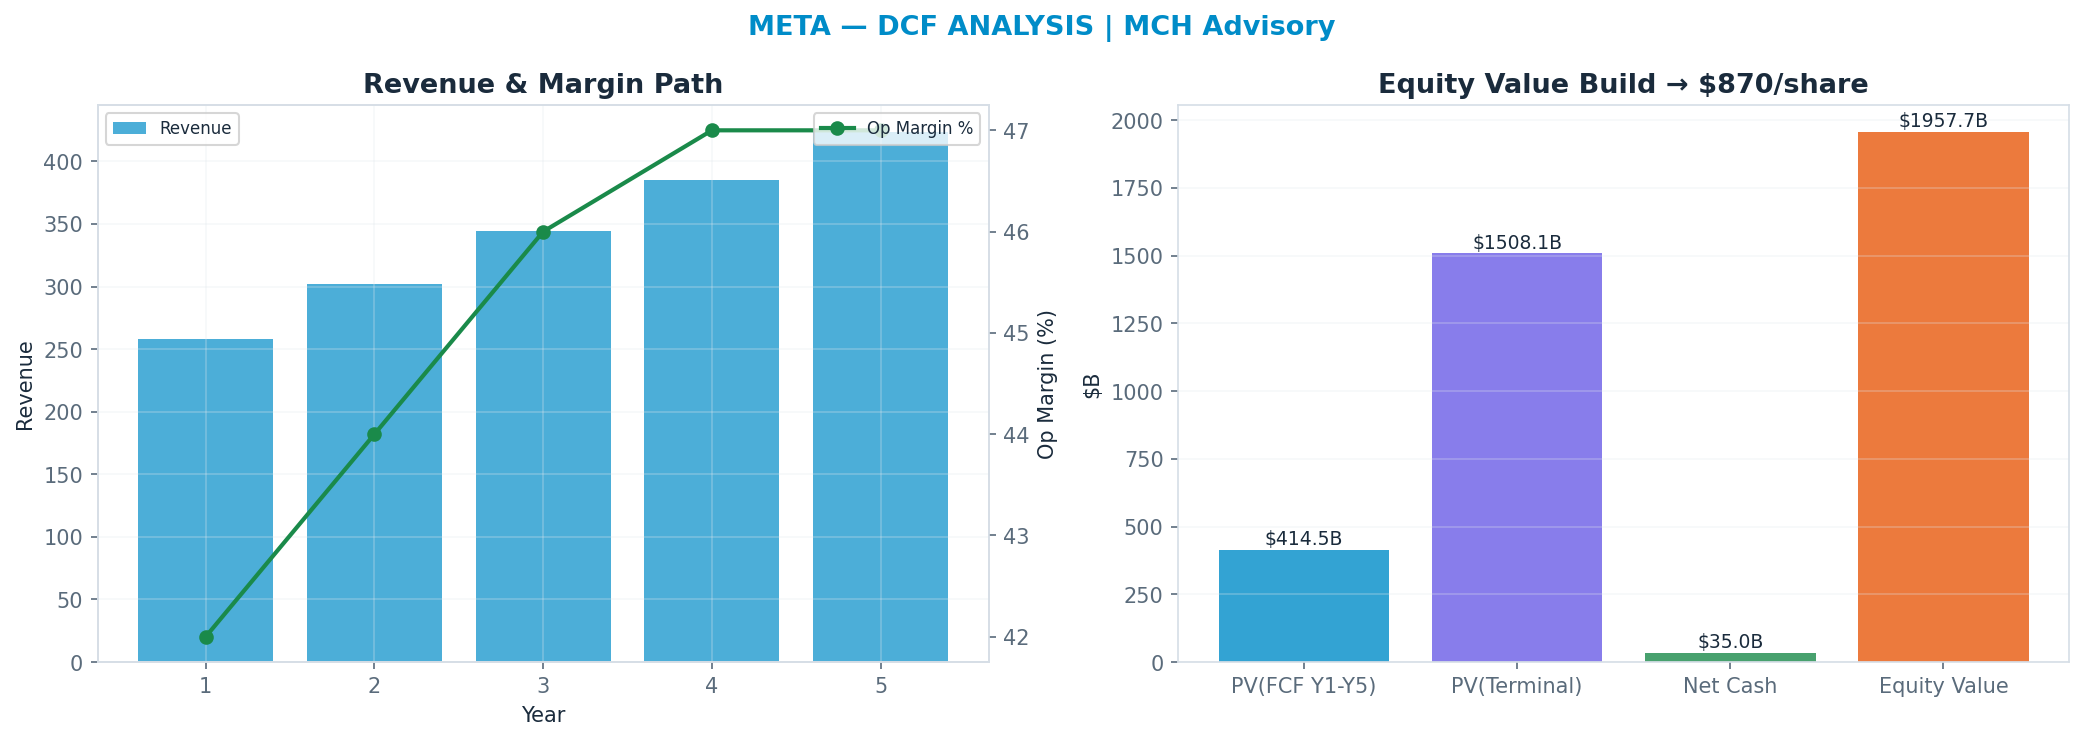
DCF — the cash-flow anchor
Independent of the market multiple: a 5-year path, WACC 10.0%, 18x terminal FCF multiple → $870. This anchor is deliberately the heaviest (35%): it is the valuation least hostage to the current multiple regime.
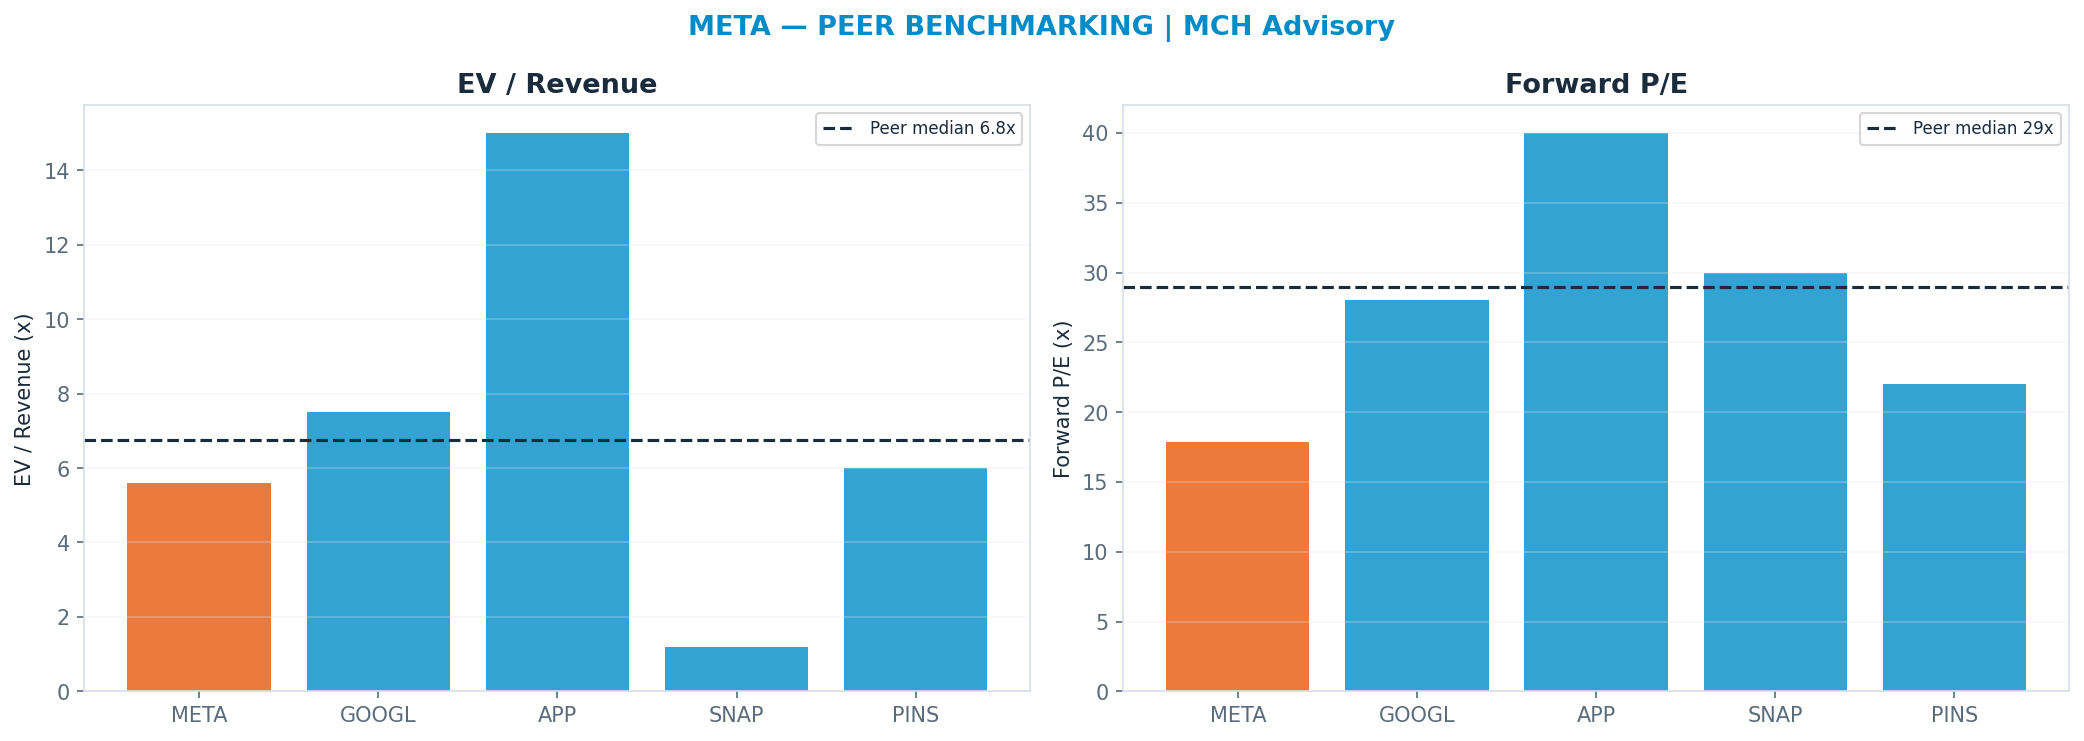
Peer benchmarking — relative value
Against the peer cohort, re-rating to the peer-median forward multiple (P/E 29.0x) implies $913. A premium is only justified by superior growth/margins; otherwise it is multiple risk. Weighted just 10% so the market's mood does not drive the fair value.
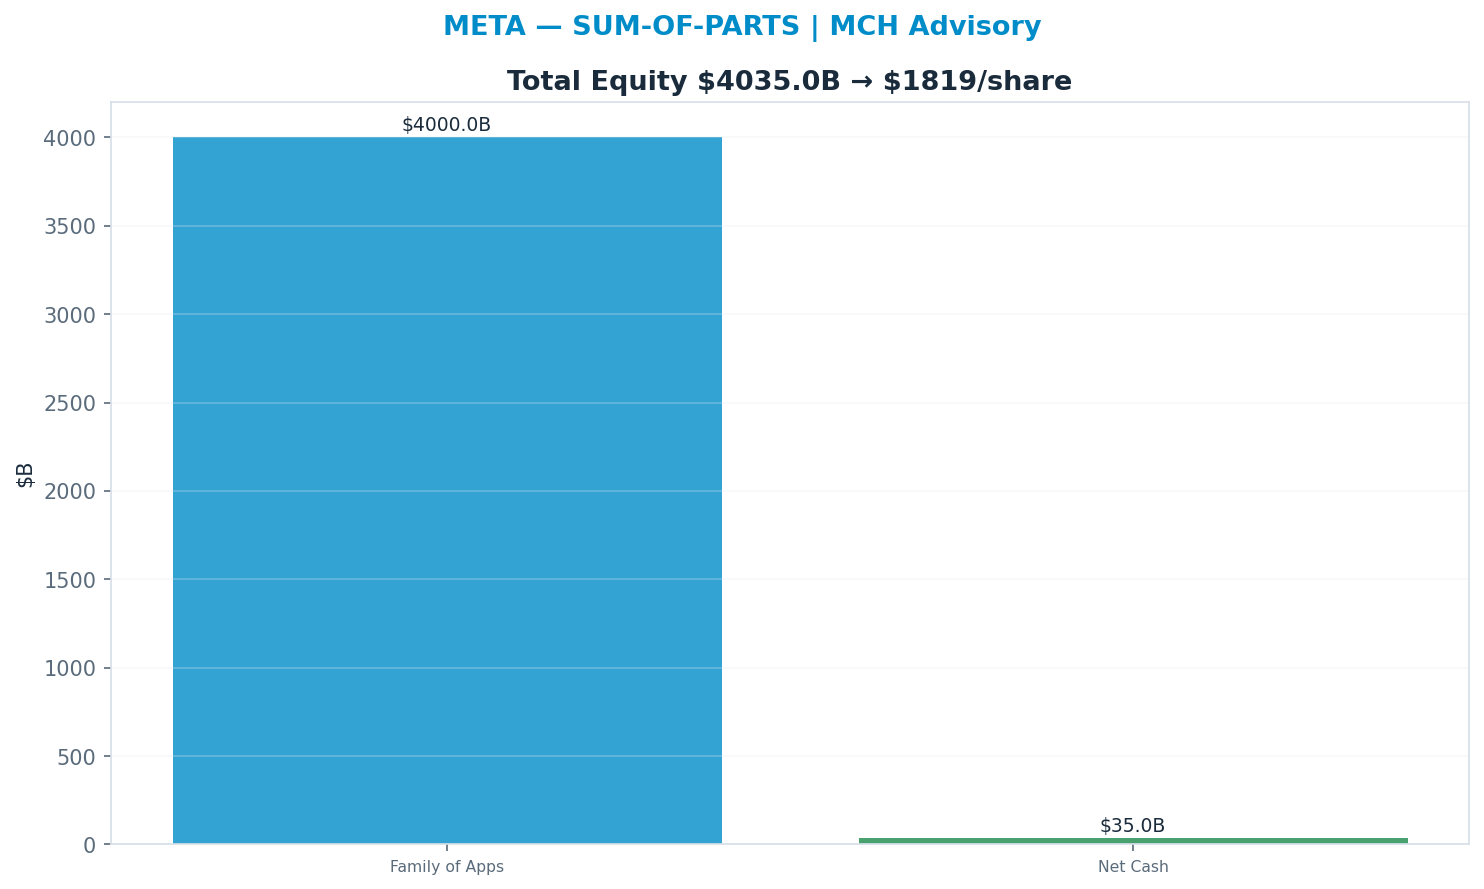
Sum-of-parts
Valuing each piece at the multiple it deserves (Family of Apps 8x, Reality Labs 3x) → $868. 'Family of Apps' dominates at 7.5× → $1,912B (100% of EV) — the segment whose multiple matters most.
Across all anchors the spread is wide (genuine disagreement — low valuation confidence).
Revenue-Segment Breakdown
The company-specific drivers behind the valuation — each segment carries its own growth, margin, multiple and capex intensity. (Tags: FACT reported · ESTIMATE from disclosures · INFERENCE judgment.)
| Segment | Revenue | Mix | Growth | Op margin | Multiple | Capex % | Tag |
|---|---|---|---|---|---|---|---|
| Family of Apps | $250B | 98% | 16% | 50% | 16x | 30% | FACT/ESTIMATE |
| Reality Labs | $4B | 2% | 10% | -500% | 0x | 150% | FACT/ESTIMATE |
AI revenue, decomposed — the AI lines broken out (Azure-AI / Copilot / model-API / pass-through style), so the AI contribution is auditable:
| AI line | Run-rate | Growth | Gross margin | Capex % | Tag |
|---|---|---|---|---|---|
| AI-driven ad uplift (embedded in FoA) | $30B | 20% | 80% | 35% | ESTIMATE |
| Meta AI assistant / business-messaging AI | $1B | 50% | 40% | 45% | ESTIMATE |
| Llama / open-model strategy | $0B | 0% | 0% | 40% | INFERENCE |
| AI infrastructure capex (COST, not revenue) | $-85B | 30% | 0% | 100% | ESTIMATE |
- AI-driven ad uplift (embedded in FoA): NOT a separable product line — this is the portion of FoA ad revenue attributable to AI-improved engagement, targeting and conversion (Advantage+, recommendation engine, signal-loss recovery). Crude estimate; directionally the single largest 'AI revenue' bucket but inseparable from core ads
- Meta AI assistant / business-messaging AI: Early-stage. Meta AI (assistant across the apps) is largely unmonetized today; business-messaging / click-to-message and AI agents for advertisers are the first direct revenue, still small
- Llama / open-model strategy: Open-weight models generate NO direct revenue. Strategic: commoditize rivals' model layer, set ecosystem standards, attract talent, and improve Meta's own ad/engagement stack. Pure cost today; value accrues indirectly through FoA
- AI infrastructure capex (COST, not revenue): Shown as a NEGATIVE to flag it is a cash outflow, not revenue. FY26 total capex ~$80-90B, majority AI datacenter / GPU. Drives D&A that compresses FoA margins in FY27+ if AI ad uplift lags the build. The ROIC question is the core capex bear case
Named Exposures
AI capex & Reality Labs burn (ESTIMATE/INFERENCE)
| Dimension | Assessment |
|---|---|
| Combined drag | AI capex ( |
| RL cumulative loss | Reality Labs has lost ~$70B+ cumulatively since 2020 with ~$4B revenue; no credible path to break-even disclosed |
| Depreciation drag | AI-datacenter D&A ramps into FY27+; if AI-driven ad uplift does not keep pace, FoA op margin compresses from the ~50% level |
| ROIC question | Incremental return on the AI + RL build is unproven — the central bear case. Capex is being defended as 'better to over-build than under-build' |
| Zuckerberg control | Class B super-voting shares give Zuckerberg majority voting control — shareholders cannot force capital discipline or wind down RL. Governance is a structural risk, not a temporary one |
Ad-market & regulatory (ESTIMATE/INFERENCE)
| Dimension | Assessment |
|---|---|
| Ad-cycle cyclicality | ~98% of revenue is advertising — highly cyclical; a recession or ad-budget pullback hits revenue and operating leverage simultaneously (the 2022 drawdown is the base-rate reference) |
| TikTok competition | Short-form video (Reels) competes directly with TikTok for engagement and ad dollars; Reels monetizes at a lower rate than feed, a mix headwind. A TikTok US ban is a possible tailwind, but not a thesis pillar |
| EU / DMA & antitrust | EU Digital Markets Act, 'pay-or-consent' ad-model challenges, and the FTC monopoly case (Instagram/WhatsApp divestiture risk) are live regulatory threats to the ad model and structure |
| Signal loss / ATT | Apple App Tracking Transparency and broader privacy/signal loss raised the cost of targeting; Meta's AI/Advantage+ recovery is the offset but is itself a dependency, not a guarantee |
Industry Context — AI Compute Stack
This name sits in the AI Compute Stack as a buyer (hyperscaler). Capex is almost pure cost (AI improves ads, not a separate product); a bust is FCF-positive but the build is the bet. Its scenarios are not guessed in isolation — they inherit a single, shared view of the cluster's driver cycle, so the names that depend on the same event are mutually consistent.
Value chain: MSFT (buyer (hyperscaler)) · GOOGL (buyer (hyperscaler)) · AMZN (buyer (hyperscaler)) · META (buyer (hyperscaler)) · NVDA (supplier — AI accelerators) · LRCX (supplier — wafer-fab equipment) · MU (supplier — HBM / memory)
| Shared state | Capex path | House view | This name implies |
|---|---|---|---|
| AI Capex Bust | FY27 aggregate −30%+ (to ~$350B) | 22% | 20% |
| Digestion | FY27 flat / plateau (~$430-460B) | 20% | 0% |
| Sustained Build | FY27 +15-20% (to ~$500B) | 38% | 35% |
| Supercycle | FY27 +30%+ (to ~$600B+) | 20% | 30% |
On the cluster's key downside — AI Capex Bust (FY27 aggregate −30%+ (to ~$350B)) — this name implies 20% vs the cluster house view of 22% (in line with the house). The cluster's full cross-stock reconciliation governs that the names which ride the same capex cycle assign it comparable odds.
Structure: Concentration — Demand: 4 hyperscalers ≈ 60-70% of AI capex. Supply: NVDA dominates accelerators; TSMC is the single leading-edge fab; 3 HBM makers. (FACT/ESTIMATE) Barriers — CUDA software lock-in, HBM/CoWoS packaging supply, leading-edge fab access, networking (NVLink). (FACT) Pricing Power — Sits with NVDA today (~75% gross margin); erodes if custom ASICs (Google TPU, AWS Trainium, Meta MTIA) and AMD take share, or inference shifts to cheaper compute. (INFERENCE) Substitution Risk — Custom silicon, model-efficiency gains (DeepSeek-style $/token collapse), inference-vs-training mix shift, and the circular vendor-financing of neoclouds/OpenAI. (INFERENCE)
Model Appendix
DCF — line items
| Year | Revenue | Op income | − Capex | + D&A | FCF | PV(FCF) |
|---|---|---|---|---|---|---|
| FY+1 | $258B | $108B | $82B | $82B | $90B | $82B |
| FY+2 | $302B | $133B | $96B | $85B | $99B | $81B |
| FY+3 | $344B | $158B | $110B | $89B | $111B | $83B |
| FY+4 | $385B | $181B | $123B | $96B | $123B | $84B |
| FY+5 | $424B | $199B | $135B | $105B | $135B | $84B |
| Terminal | — | — | — | — | $135B × 18x | $1508B |
FCF is bridged: NOPAT + D&A − Capex − ΔNWC (capex intensity 32% of revenue, weighted from the segments) — not a single conversion fudge.
WACC 10.0% · Σ PV(FCF) $415B + PV(terminal) $1508B = EV $1923B; + net cash → equity $1958B ÷ diluted shares 2.25B = $870/share (exit-multiple terminal).
- Gordon (perpetuity-growth) terminal at 2.5% → $708/share — a genuinely non-multiple, cash-based cross-check; the exit-multiple and Gordon values bracket the terminal-value risk.
- Incremental ROIC on the forecast capex ≈ 14% vs WACC 10% → above WACC — the build is value-creative.
Peer set
| Peer | EV/Rev | Fwd P/E | Growth | Op margin |
|---|---|---|---|---|
| GOOGL | 7.5x | 28x | 14% | 32% |
| APP | 15.0x | 40x | 35% | 40% |
| SNAP | 1.2x | 30x | 12% | 6% |
| PINS | 6.0x | 22x | 14% | 18% |
| Median | 6.75x | 29.0x | — | — |
Peer-median fwd P/E → $913; EV/Rev → $677.
Weighted fair-value math
| Anchor | Value | Weight | Contribution |
|---|---|---|---|
| DCF | $870 | 39% | $338 |
| Scenario PWEV | $587 | 28% | $163 |
| Monte Carlo median | $564 | 17% | $94 |
| Sum-of-parts | $868 | 17% | $145 |
| Triangulated | — | 100% | $740 |
Sensitivity
DCF/share — WACC × terminal multiple
| WACC \ Term× | 12.6x | 15.3x | 18.0x | 20.7x | 23.4x |
|---|---|---|---|---|---|
| 8% | $724 | $834 | $944 | $1,055 | $1,165 |
| 9% | $696 | $801 | $906 | $1,011 | $1,116 |
| 10% | $669 | $769 | $870 | $970 | $1,070 |
| 11% | $643 | $739 | $835 | $931 | $1,027 |
| 12% | $618 | $710 | $802 | $894 | $986 |
DCF/share — revenue CAGR Δ × op-margin Δ
| CAGRΔ \ MgnΔ | -3.0pp | -1.5pp | +0.0pp | +1.5pp | +3.0pp |
|---|---|---|---|---|---|
| -3.0pp | $744 | $774 | $803 | $833 | $862 |
| -1.5pp | $773 | $804 | $836 | $867 | $898 |
| +0.0pp | $803 | $836 | $870 | $903 | $936 |
| +1.5pp | $834 | $869 | $905 | $940 | $975 |
| +3.0pp | $866 | $904 | $941 | $979 | $1,016 |
Tornado — DCF/share swing by driver (widest first)
| Driver | Low | High | Swing |
|---|---|---|---|
| Terminal × ±15% | $769 | $970 | $201 |
| Revenue CAGR ±3pp | $803 | $941 | $138 |
| Op margin ±3pp | $803 | $936 | $133 |
| WACC ±1pp | $835 | $906 | $71 |
| FCF conversion ±10% | $870 | $870 | $0 |
Company lever — SoP/share vs Family of Apps multiple (AI re-rating) (base 16x)
| Multiple | 11.2x | 13.6x | 16.0x | 18.4x | 20.8x |
|---|---|---|---|---|---|
| SoP/share | $1,291 | $1,564 | $1,837 | $2,111 | $2,384 |
Load-Bearing Assumptions
DCF: WACC 10%, terminal multiple 18×, FY+5 revenue $424B. Triangulation leans 35% on DCF, 25% on PWEV.
Reasons the Thesis Could Fail (Falsifiable)
The valuation is multiple-dependent (70% of variance); a de-rating toward the DCF anchor ($870) implies +54%.
Fact / Inference / Speculation
- FACT: Spot $563; 52-week range $520–$794; engine rating HOLD; base-case target $587 (+4%).
- INFERENCE: Triangulated FV $740 (+31%). P/E Multiple explains 70% of Monte Carlo outcome variance — i.e. value is set by the multiple the market will pay, a rate/sentiment regime bet as much as an earnings bet.
- SPECULATION: At current prices the embedded bet is that the multiple holds or expands — P/E Multiple carries 70% of outcome variance.
Recommendation: HOLD
Balanced: triangulated fair value $757 (+34% vs spot); the outcome hinges on P/E Multiple. The debate is P/E Multiple (70% of variance) — fundamentally a multiple/regime call. SBC runs 15500M TTM (disclosed in the appendix).