Rating: HOLD
| Metric | Value |
|---|---|
| Current Price | $200 |
| Triangulated Fair Value | $199 |
| 12-mo Scenario PWEV | $207 |
| Implied Return | -0% |
| Forward P/E | 22.8x |
| Market Cap | $4.85T |
| 52-Week Range | $151 – $236 |
Methodology: Valuation triangulated across five independent anchors — Monte Carlo (Student-t + regime switching), an independent DCF, peer re-rating, a sum-of-parts, and a scenario-weighted PWEV. Figures reconciled to mch_weekly_run live prices. Each chart below sits with the part of the thesis it evidences.
Investment Thesis
The bull case — 'Supercycle Extended' (7% weight) — targets $380, +90% vs spot. It needs Revenue Growth to surprise to the upside.
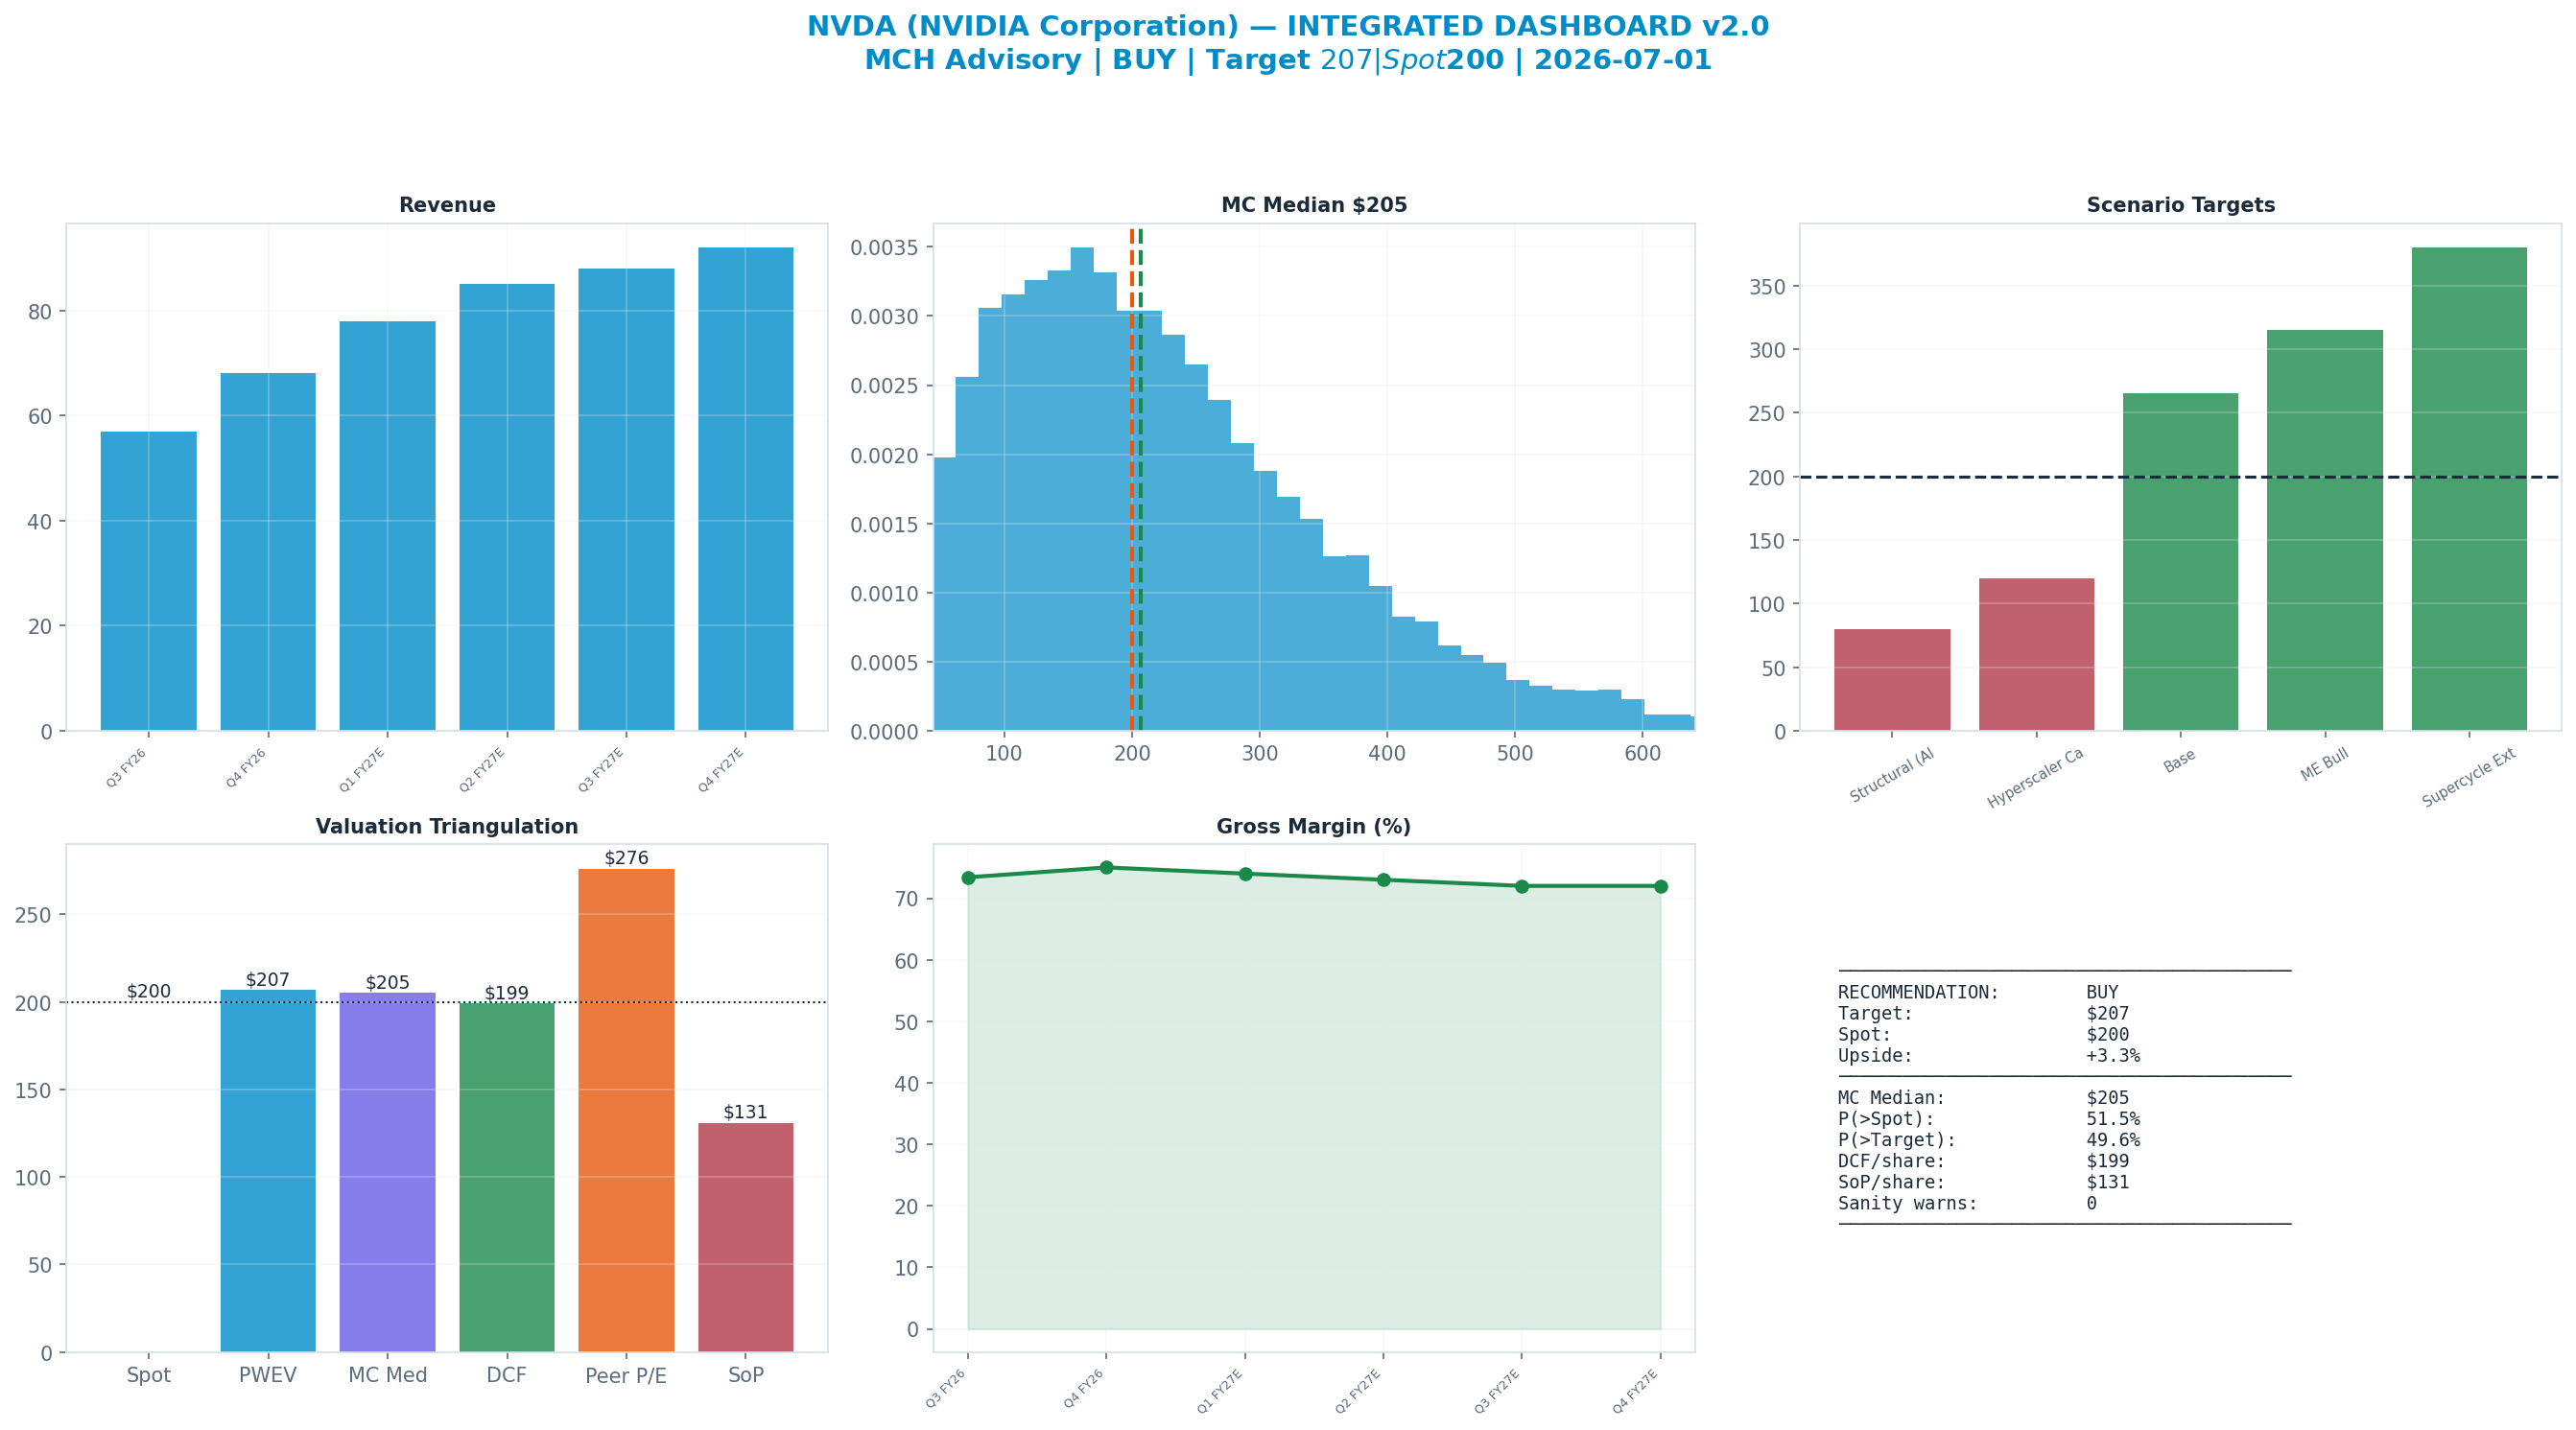
The dashboard below is the whole argument on one page: spot ($200) against each valuation anchor, the scenario tree, technicals and the options-implied move.
Anti-Thesis (The Real Bear Case)
The structural case — 'Structural (AI Winter)' (22%) — targets $80, -60% vs spot. This sits below the 52-week low — a genuine structural impairment, not a mild pullback.
Key Debate
Revenue Growth explains 59% of Monte Carlo outcome variance — the single variable that decides which side is right.
Earnings-Call Disconfirmation & Sentiment
Derived signals from the MCH market-data store (Alpha Vantage transcripts + news). Quantitative tone only — a disconfirmation flag, not a substitute for reading the call.
Management vs analyst tone (2026Q2): management +0.75 vs analyst floor +0.30 → delta +0.45 (n=8 mgmt / 8 Q&A; 61th pctile across the S&P book, z +0.3).
Flag: TYPICAL — management-vs-analyst tone within the normal cross-sectional range.
| Quarter | Mgmt | Analyst | Delta |
|---|---|---|---|
| 2026Q2 | +0.75 | +0.30 | +0.45 |
| 2026Q1 | +0.59 | +0.53 | +0.06 |
| 2025Q4 | +0.71 | +0.25 | +0.46 |
| 2025Q3 | +0.61 | +0.12 | +0.49 |
News (last 365d, 1007 articles): avg ticker sentiment +0.20 (bullish 13% / bearish 2%)
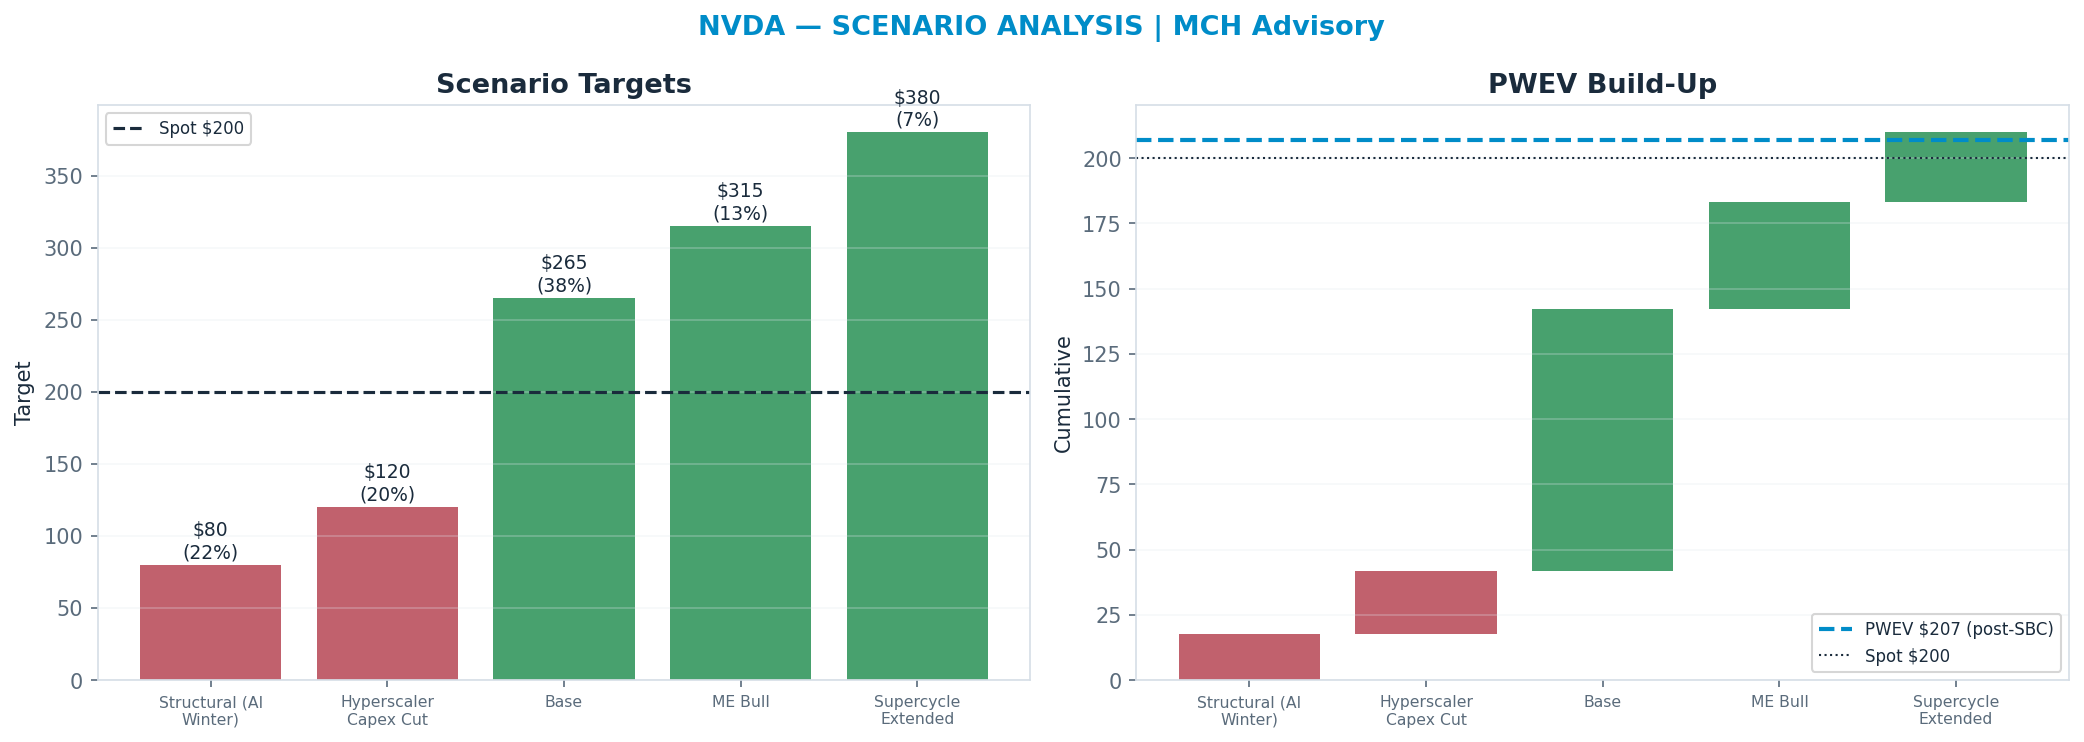
Scenario Analysis
The tree runs from a structural 'Structural (AI Winter)' downside ($80) to a 'Supercycle Extended' bull case ($380); the probability-weighted blend (PWEV $207) is +3% versus spot.
| Scenario | Probability | Target | Return |
|---|---|---|---|
| Structural (AI Winter) | 22% | $80 | -60% |
| Hyperscaler Capex Cut | 20% | $120 | -40% |
| Base | 38% | $265 | +32% |
| ME Bull | 13% | $315 | +57% |
| Supercycle Extended | 7% | $380 | +90% |
| Probability-Weighted (PWEV, after SBC dilution) | — | $207 | +3% |
SBC charge: scenario targets are gross per-share prices; the PWEV is reduced by one year of stock-based-compensation dilution (1.5% of shares, on SBC ≈ 2% of revenue), trimming the gross PWEV of $210 to $207 (-1.5%). SBC is charged once, as dilution — never also deducted from FCF.
Scenario rationale — what each probability buys (the driver path behind every target):
- Structural (AI Winter) (22%, $80). AI-capex digestion turns structural: training-cluster ROI disappoints, inference commoditizes, and customers conclude they over-built. DC revenue contracts, gross margin compresses toward the low-60s as scarcity pricing breaks and custom silicon/AMD take share, and the multiple de-rates to ~12x on a falling earnings base. The target sits below the 52-week low — a genuine impairment of the demand thesis, not a pullback. Drivers — dc_growth: negative to flat; gross_margin: ~60-62%; op_margin: ~50%; multiple: ~12x.
- Hyperscaler Capex Cut (20%, $120). A coordinated capex-digestion year: the top hyperscalers pause to absorb prior buildout, DC growth stalls to low-single-digits, and gross margin slips toward high-60s as the demand/supply balance loosens. The multiple stays capped ~16x because the market demands proof the AI-capex cycle is durable rather than reflexive before re-rating. Drivers — dc_growth: ~0-10%; gross_margin: ~67-70%; op_margin: ~58%; multiple: ~16x.
- Base (38%, $265). The Blackwell-to-Rubin transition sustains ~30-40% DC growth as broad enterprise and sovereign demand offsets some hyperscaler digestion; gross margin normalizes into the low-70s as supply catches up; networking attach rises. The multiple settles ~22x on still-strong but decelerating growth and a maturing (no longer scarcity-priced) cycle. Drivers — dc_growth: ~30-40%; gross_margin: ~72-74%; op_margin: ~65%; multiple: ~22x.
- ME Bull (13%, $315). Demand outruns supply through the Rubin ramp: sovereign AI and inference-at-scale add a durable second leg, networking and software attach climb, and gross margin holds mid-70s on sustained pricing power. Operating leverage expands margins and the multiple re-rates toward ~28x on re-accelerating growth. Drivers — dc_growth: ~45-55%; gross_margin: ~75%; op_margin: ~67%; multiple: ~28x.
- Supercycle Extended (7%, $380). The AI buildout proves to be a multi-year compute supercycle: NVDA holds full-stack share against custom silicon, software/recurring revenue inflects into a real pillar, and inference demand compounds on top of training. ROIC stays elevated, gross margin sustains mid-70s, and the multiple holds ~32x as the cycle's duration is re-rated rather than its level. Drivers — dc_growth: >55%; gross_margin: >75%; op_margin: >68%; multiple: ~32x.
Valuation Triangulation
Five anchors — but read them with their basis in mind. The Monte Carlo, the DCF terminal, and the peer re-rate all key off a market multiple, so they are not fully independent; only the discounted cash flows themselves are genuinely multiple-free. The discipline is to read the spread and weight the cash-based view, not to treat five numbers as five independent votes.
| Method | Basis | Fair Value | vs Spot |
|---|---|---|---|
| Monte Carlo median (Student-t + regime) | multiple | $205 | +3% |
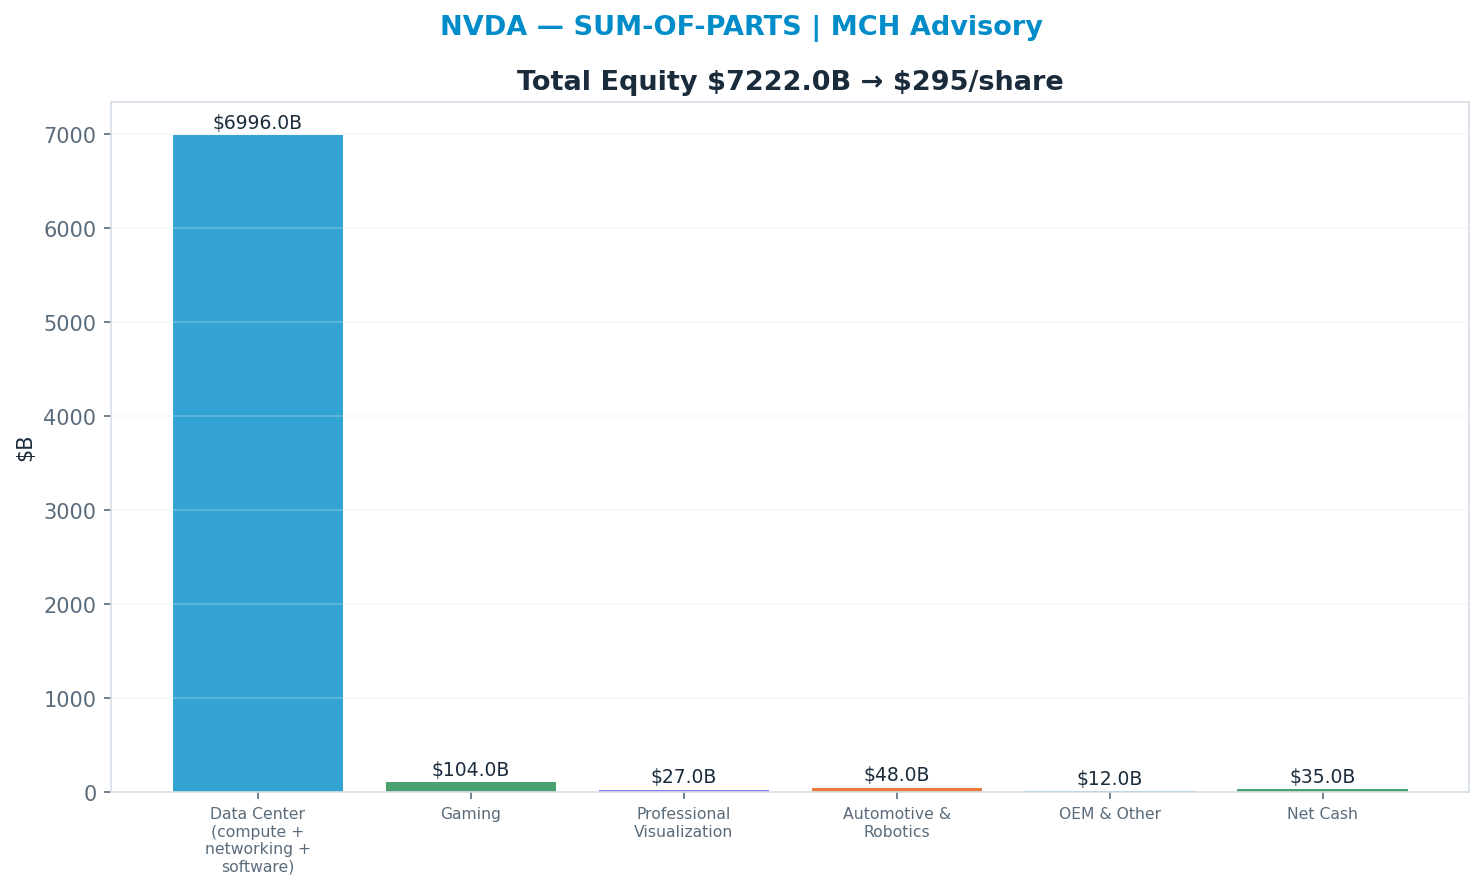
| Sum-of-Parts | multiple | $131 | -35% |
| Peer P/E re-rate | multiple | $276 | +38% |
| Peer EV/Revenue re-rate | multiple | $122 | -39% |
| Scenario PWEV | multiple | $207 | +3% |
| DCF (5-year + terminal) | cash flow + terminal × | $199 | -1% |
| Triangulated (weighted) | — | $199 | -0% |
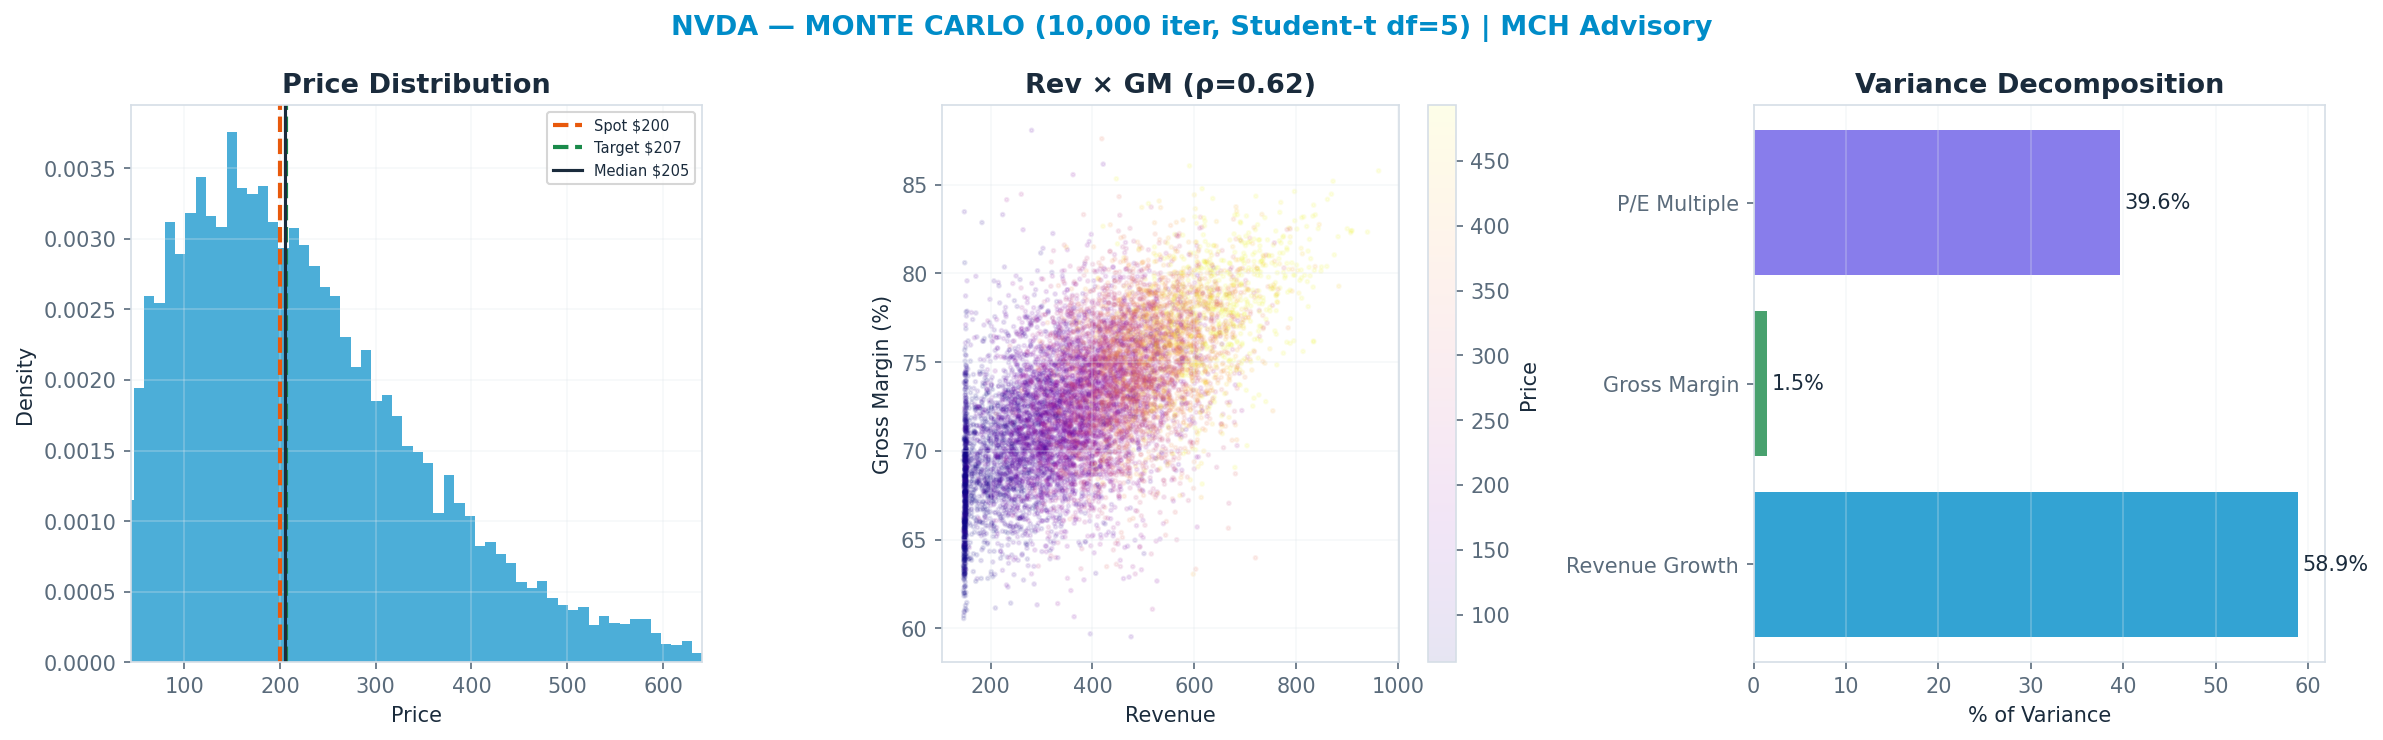
Monte Carlo — the distribution, not a point
10,000 paths, Student-t shocks (fat tails) with a regime-switching overlay. The median lands at $205 and 52% of paths finish above spot. The variance decomposition shows the revenue growth is the dominant swing factor (59% of variance). The fundamental driver, not the multiple, sets the spread — a cleaner setup.
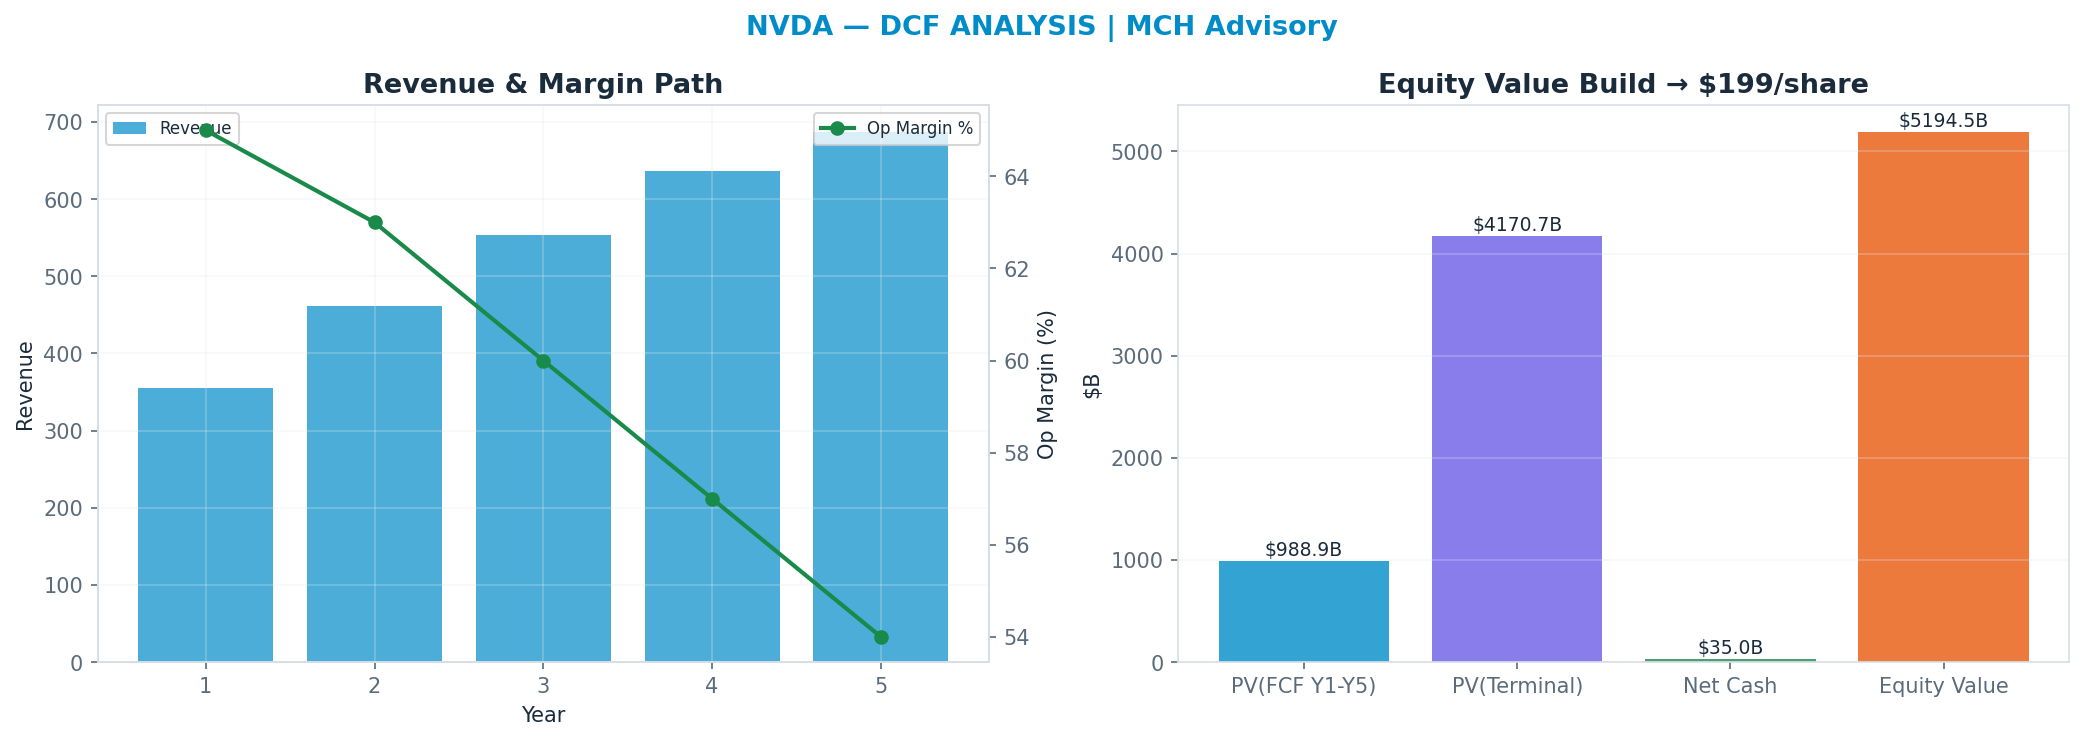
DCF — the cash-flow anchor
Independent of the market multiple: a 5-year path, WACC 11.0%, 22x terminal FCF multiple → $199. This anchor is deliberately the heaviest (35%): it is the valuation least hostage to the current multiple regime.
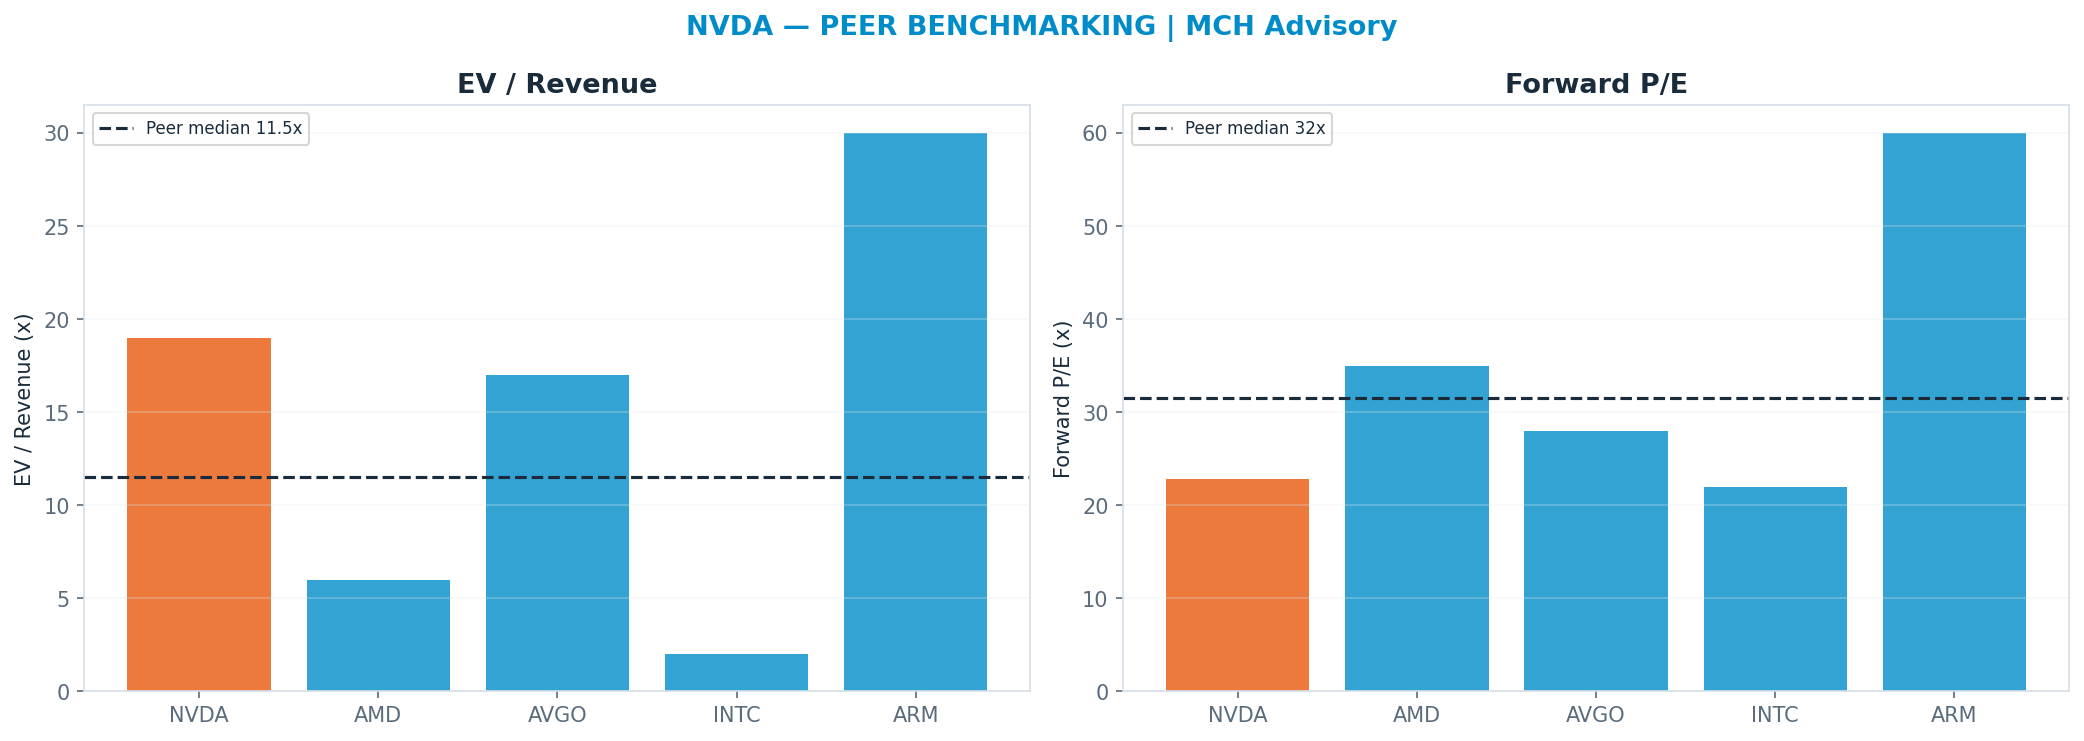
Peer benchmarking — relative value
Against the peer cohort, re-rating to the peer-median forward multiple (P/E 31.5x) implies $276. A premium is only justified by superior growth/margins; otherwise it is multiple risk. Weighted just 10% so the market's mood does not drive the fair value.
Sum-of-parts
Valuing each piece at the multiple it deserves (Data Center 18x, Gaming 8x, Auto + ProViz 12x, Networking 15x) → $131. 'Data Center' dominates at 18.0× → $3,060B (90% of EV) — the segment whose multiple matters most.
Across all anchors the spread is wide (genuine disagreement — low valuation confidence).
Revenue-Segment Breakdown
The company-specific drivers behind the valuation — each segment carries its own growth, margin, multiple and capex intensity. (Tags: FACT reported · ESTIMATE from disclosures · INFERENCE judgment.)
| Segment | Revenue | Mix | Growth | Op margin | Multiple | Capex % | Tag |
|---|---|---|---|---|---|---|---|
| Data Center (compute + networking + software) | $318B | 94% | 40% | 68% | 22x | 2% | FACT/ESTIMATE |
| Gaming | $13B | 4% | 5% | 35% | 8x | 2% | FACT/ESTIMATE |
| Professional Visualization | $3B | 1% | 10% | 40% | 9x | 2% | FACT/ESTIMATE |
| Automotive & Robotics | $4B | 1% | 30% | 25% | 12x | 2% | FACT/ESTIMATE |
| OEM & Other | $2B | 1% | 5% | 20% | 6x | 2% | FACT/ESTIMATE |
AI revenue, decomposed — the AI lines broken out (Azure-AI / Copilot / model-API / pass-through style), so the AI contribution is auditable:
| AI line | Run-rate | Growth | Gross margin | Capex % | Tag |
|---|---|---|---|---|---|
| Data Center GPU compute (Hopper/Blackwell/Rubin) | $240B | 40% | 75% | 2% | ESTIMATE |
| Networking (NVLink / InfiniBand / Spectrum-X) | $45B | 45% | 70% | 2% | ESTIMATE |
| Software & services (CUDA / AI Enterprise / NIM) | $4B | 50% | 85% | 2% | ESTIMATE/INFERENCE |
| End-customer mix (hyperscaler / sovereign / enterprise) | $0B | 0% | 0% | 0% | INFERENCE |
- Data Center GPU compute (Hopper/Blackwell/Rubin): The bulk of DC and the cycle's swing factor — supply/demand-driven; Blackwell ramp now, Rubin the next node. Volume = customer capex + foundry (TSMC CoWoS/HBM) supply. This is the line that determines the whole thesis.
- Networking (NVLink / InfiniBand / Spectrum-X): Ex-Mellanox + NVLink scale-up fabric. Attaches to rack-scale GB/NVL systems; rising attach rate as deployments move to full-rack. Spectrum-X Ethernet contesting the InfiniBand-vs-Ethernet datacenter-networking debate.
- Software & services (CUDA / AI Enterprise / NIM): Recurring optionality and the durability argument for the moat (CUDA lock-in). Still small (low-single-digit % of DC) — a lever, not yet a pillar. Do NOT confuse the installed-base moat narrative with current recognized software revenue.
- End-customer mix (hyperscaler / sovereign / enterprise): NOT additive — a decomposition of DC demand, not a separate revenue line. ~40-50% of total revenue from a handful of US hyperscalers; sovereign AI a fast-growing but lumpy second leg; enterprise/neocloud the long tail. Concentration is the structural risk; sovereign is the diversification hope.
Named Exposures
Customer concentration & hyperscaler capex cycle (ESTIMATE/INFERENCE)
| Dimension | Assessment |
|---|---|
| Hyperscaler share | ~40-50% of total revenue from a handful of large customers (MSFT/META/AMZN/GOOGL and their cloud/AI arms); 10-K discloses several customers each >10% of revenue (est.) |
| Capex dependency | DC GPU demand is a direct derivative of customer AI capex budgets — a single coordinated capex-digestion pause cuts NVDA revenue growth sharply |
| Circular financing | OpenAI/Anthropic/neocloud demand partly financed by vendor/strategic investments (incl. NVDA stakes) and debt-funded neoclouds — demand durability is partly reflexive, not purely organic end-demand |
| Backlog visibility | Multi-quarter supply commitments give near-term visibility but mask whether sell-through reflects deployed utilization vs. inventory/anticipatory buildout |
| Concentration risk | High — the same buyers can pause in unison; their incentive to develop in-house silicon rises with every quarter of NVDA pricing power |
China export controls & competitive substitution (ESTIMATE/INFERENCE)
| Dimension | Assessment |
|---|---|
| China revenue hit | Export controls have cut the China DC opportunity materially vs. its prior ~20-25% revenue share; restricted/compliant SKUs only — a multi-billion structural headwind, not a timing issue |
| Custom silicon | Hyperscaler in-house ASICs (Google TPU, AWS Trainium, Meta MTIA, MSFT Maia) target the largest internal training/inference workloads — the most price-sensitive, highest-volume tier |
| AMD substitution | MI-series (MI300/MI400) is a credible second source for inference; pressures pricing at the margin even where it doesn't win sockets |
| Gross-margin durability | Mid-70s DC gross margin is the most valuable and most fragile variable; it reflects scarcity pricing that custom silicon + AMD + supply normalization are all built to erode |
| Moat dependency | CUDA/software lock-in and full-stack (chip+networking+systems) integration are the durability case; the bear case is that lock-in matters less for inference and for buyers large enough to fund their own stack |
Industry Context — AI Compute Stack
This name sits in the AI Compute Stack as a supplier — AI accelerators. ≈ the dependent variable: aggregate hyperscaler AI-capex IS NVDA Data-Center revenue, near 1:1. Highest beta to this cycle. Its scenarios are not guessed in isolation — they inherit a single, shared view of the cluster's driver cycle, so the names that depend on the same event are mutually consistent.
Value chain: MSFT (buyer (hyperscaler)) · GOOGL (buyer (hyperscaler)) · AMZN (buyer (hyperscaler)) · META (buyer (hyperscaler)) · NVDA (supplier — AI accelerators) · LRCX (supplier — wafer-fab equipment) · MU (supplier — HBM / memory)
| Shared state | Capex path | House view | This name implies |
|---|---|---|---|
| AI Capex Bust | FY27 aggregate −30%+ (to ~$350B) | 22% | 22% |
| Digestion | FY27 flat / plateau (~$430-460B) | 20% | 20% |
| Sustained Build | FY27 +15-20% (to ~$500B) | 38% | 38% |
| Supercycle | FY27 +30%+ (to ~$600B+) | 20% | 20% |
On the cluster's key downside — AI Capex Bust (FY27 aggregate −30%+ (to ~$350B)) — this name implies 22% vs the cluster house view of 22% (in line with the house). The cluster's full cross-stock reconciliation governs that the names which ride the same capex cycle assign it comparable odds.
Structure: Concentration — Demand: 4 hyperscalers ≈ 60-70% of AI capex. Supply: NVDA dominates accelerators; TSMC is the single leading-edge fab; 3 HBM makers. (FACT/ESTIMATE) Barriers — CUDA software lock-in, HBM/CoWoS packaging supply, leading-edge fab access, networking (NVLink). (FACT) Pricing Power — Sits with NVDA today (~75% gross margin); erodes if custom ASICs (Google TPU, AWS Trainium, Meta MTIA) and AMD take share, or inference shifts to cheaper compute. (INFERENCE) Substitution Risk — Custom silicon, model-efficiency gains (DeepSeek-style $/token collapse), inference-vs-training mix shift, and the circular vendor-financing of neoclouds/OpenAI. (INFERENCE)
Model Appendix
DCF — line items
| Year | Revenue | Op income | − Capex | + D&A | FCF | PV(FCF) |
|---|---|---|---|---|---|---|
| FY+1 | $355B | $231B | $7B | $7B | $201B | $181B |
| FY+2 | $461B | $291B | $9B | $7B | $251B | $204B |
| FY+3 | $554B | $332B | $11B | $8B | $286B | $209B |
| FY+4 | $637B | $363B | $13B | $9B | $312B | $206B |
| FY+5 | $688B | $371B | $14B | $10B | $319B | $190B |
| Terminal | — | — | — | — | $319B × 22x | $4171B |
FCF is bridged: NOPAT + D&A − Capex − ΔNWC (capex intensity 2% of revenue, weighted from the segments) — not a single conversion fudge.
WACC 11.0% · Σ PV(FCF) $989B + PV(terminal) $4171B = EV $5160B; + net cash → equity $5195B ÷ diluted shares 26.09B = $199/share (exit-multiple terminal).
- Gordon (perpetuity-growth) terminal at 2.5% → $127/share — a genuinely non-multiple, cash-based cross-check; the exit-multiple and Gordon values bracket the terminal-value risk.
- Incremental ROIC on the forecast capex ≈ 227% vs WACC 11% → above WACC — the build is value-creative.
Peer set
| Peer | EV/Rev | Fwd P/E | Growth | Op margin |
|---|---|---|---|---|
| AMD | 6.0x | 35x | 18% | 22% |
| AVGO | 17.0x | 28x | 25% | 45% |
| INTC | 2.0x | 22x | 4% | 8% |
| ARM | 30.0x | 60x | 25% | 25% |
| Median | 11.5x | 31.5x | — | — |
Peer-median fwd P/E → $276; EV/Rev → $122.
Weighted fair-value math
| Anchor | Value | Weight | Contribution |
|---|---|---|---|
| DCF | $199 | 35% | $70 |
| Scenario PWEV | $207 | 25% | $52 |
| Monte Carlo median | $205 | 15% | $31 |
| Sum-of-parts | $131 | 15% | $20 |
| Peer P/E | $276 | 10% | $28 |
| Triangulated | — | 100% | $199 |
Sensitivity
DCF/share — WACC × terminal multiple
| WACC \ Term× | 15.4x | 18.7x | 22.0x | 25.3x | 28.6x |
|---|---|---|---|---|---|
| 9% | $164 | $190 | $216 | $243 | $269 |
| 10% | $157 | $182 | $208 | $233 | $258 |
| 11% | $151 | $175 | $199 | $223 | $247 |
| 12% | $145 | $168 | $191 | $214 | $237 |
| 13% | $140 | $162 | $183 | $205 | $227 |
DCF/share — revenue CAGR Δ × op-margin Δ
| CAGRΔ \ MgnΔ | -3.0pp | -1.5pp | +0.0pp | +1.5pp | +3.0pp |
|---|---|---|---|---|---|
| -3.0pp | $168 | $173 | $178 | $183 | $188 |
| -1.5pp | $178 | $183 | $188 | $193 | $199 |
| +0.0pp | $188 | $194 | $199 | $205 | $210 |
| +1.5pp | $199 | $205 | $210 | $216 | $222 |
| +3.0pp | $210 | $216 | $222 | $228 | $234 |
Tornado — DCF/share swing by driver (widest first)
| Driver | Low | High | Swing |
|---|---|---|---|
| Terminal × ±15% | $175 | $223 | $48 |
| Revenue CAGR ±3pp | $178 | $222 | $44 |
| Op margin ±3pp | $188 | $210 | $22 |
| WACC ±1pp | $191 | $208 | $16 |
| FCF conversion ±10% | $199 | $199 | $0 |
Company lever — SoP/share vs Data Center (compute + networking + software) multiple (AI re-rating) (base 22x)
| Multiple | 15.4x | 18.7x | 22.0x | 25.3x | 28.6x |
|---|---|---|---|---|---|
| SoP/share | $212 | $255 | $298 | $341 | $385 |
Load-Bearing Assumptions
DCF: WACC 11%, terminal multiple 22×, FY+5 revenue $688B. Triangulation leans 35% on DCF, 25% on PWEV.
Reasons the Thesis Could Fail (Falsifiable)
A miss on Revenue Growth drops the case toward the structural target $80.
Fact / Inference / Speculation
- FACT: Spot $200; 52-week range $151–$236; engine rating HOLD; base-case target $207 (+3%).
- INFERENCE: Triangulated FV $199 (-0%). Revenue Growth explains 59% of Monte Carlo outcome variance — the single variable that decides which side is right.
- SPECULATION: At current prices the embedded bet is that Revenue Growth surprises to the upside — Revenue Growth carries 59% of outcome variance.
Recommendation: HOLD
Balanced: triangulated fair value $199 (-0% vs spot); the outcome hinges on Revenue Growth. The debate is Revenue Growth (59% of variance) — a fundamental call. SBC runs 4500M TTM (disclosed in the appendix).