Rating: HOLD
| Metric | Value |
|---|---|
| Current Price | $373 |
| Triangulated Fair Value | $455 |
| 12-mo Scenario PWEV | $418 |
| Implied Return | +22% |
| Forward P/E | 19.2x |
| Market Cap | $2.77T |
| 52-Week Range | $349 – $551 |
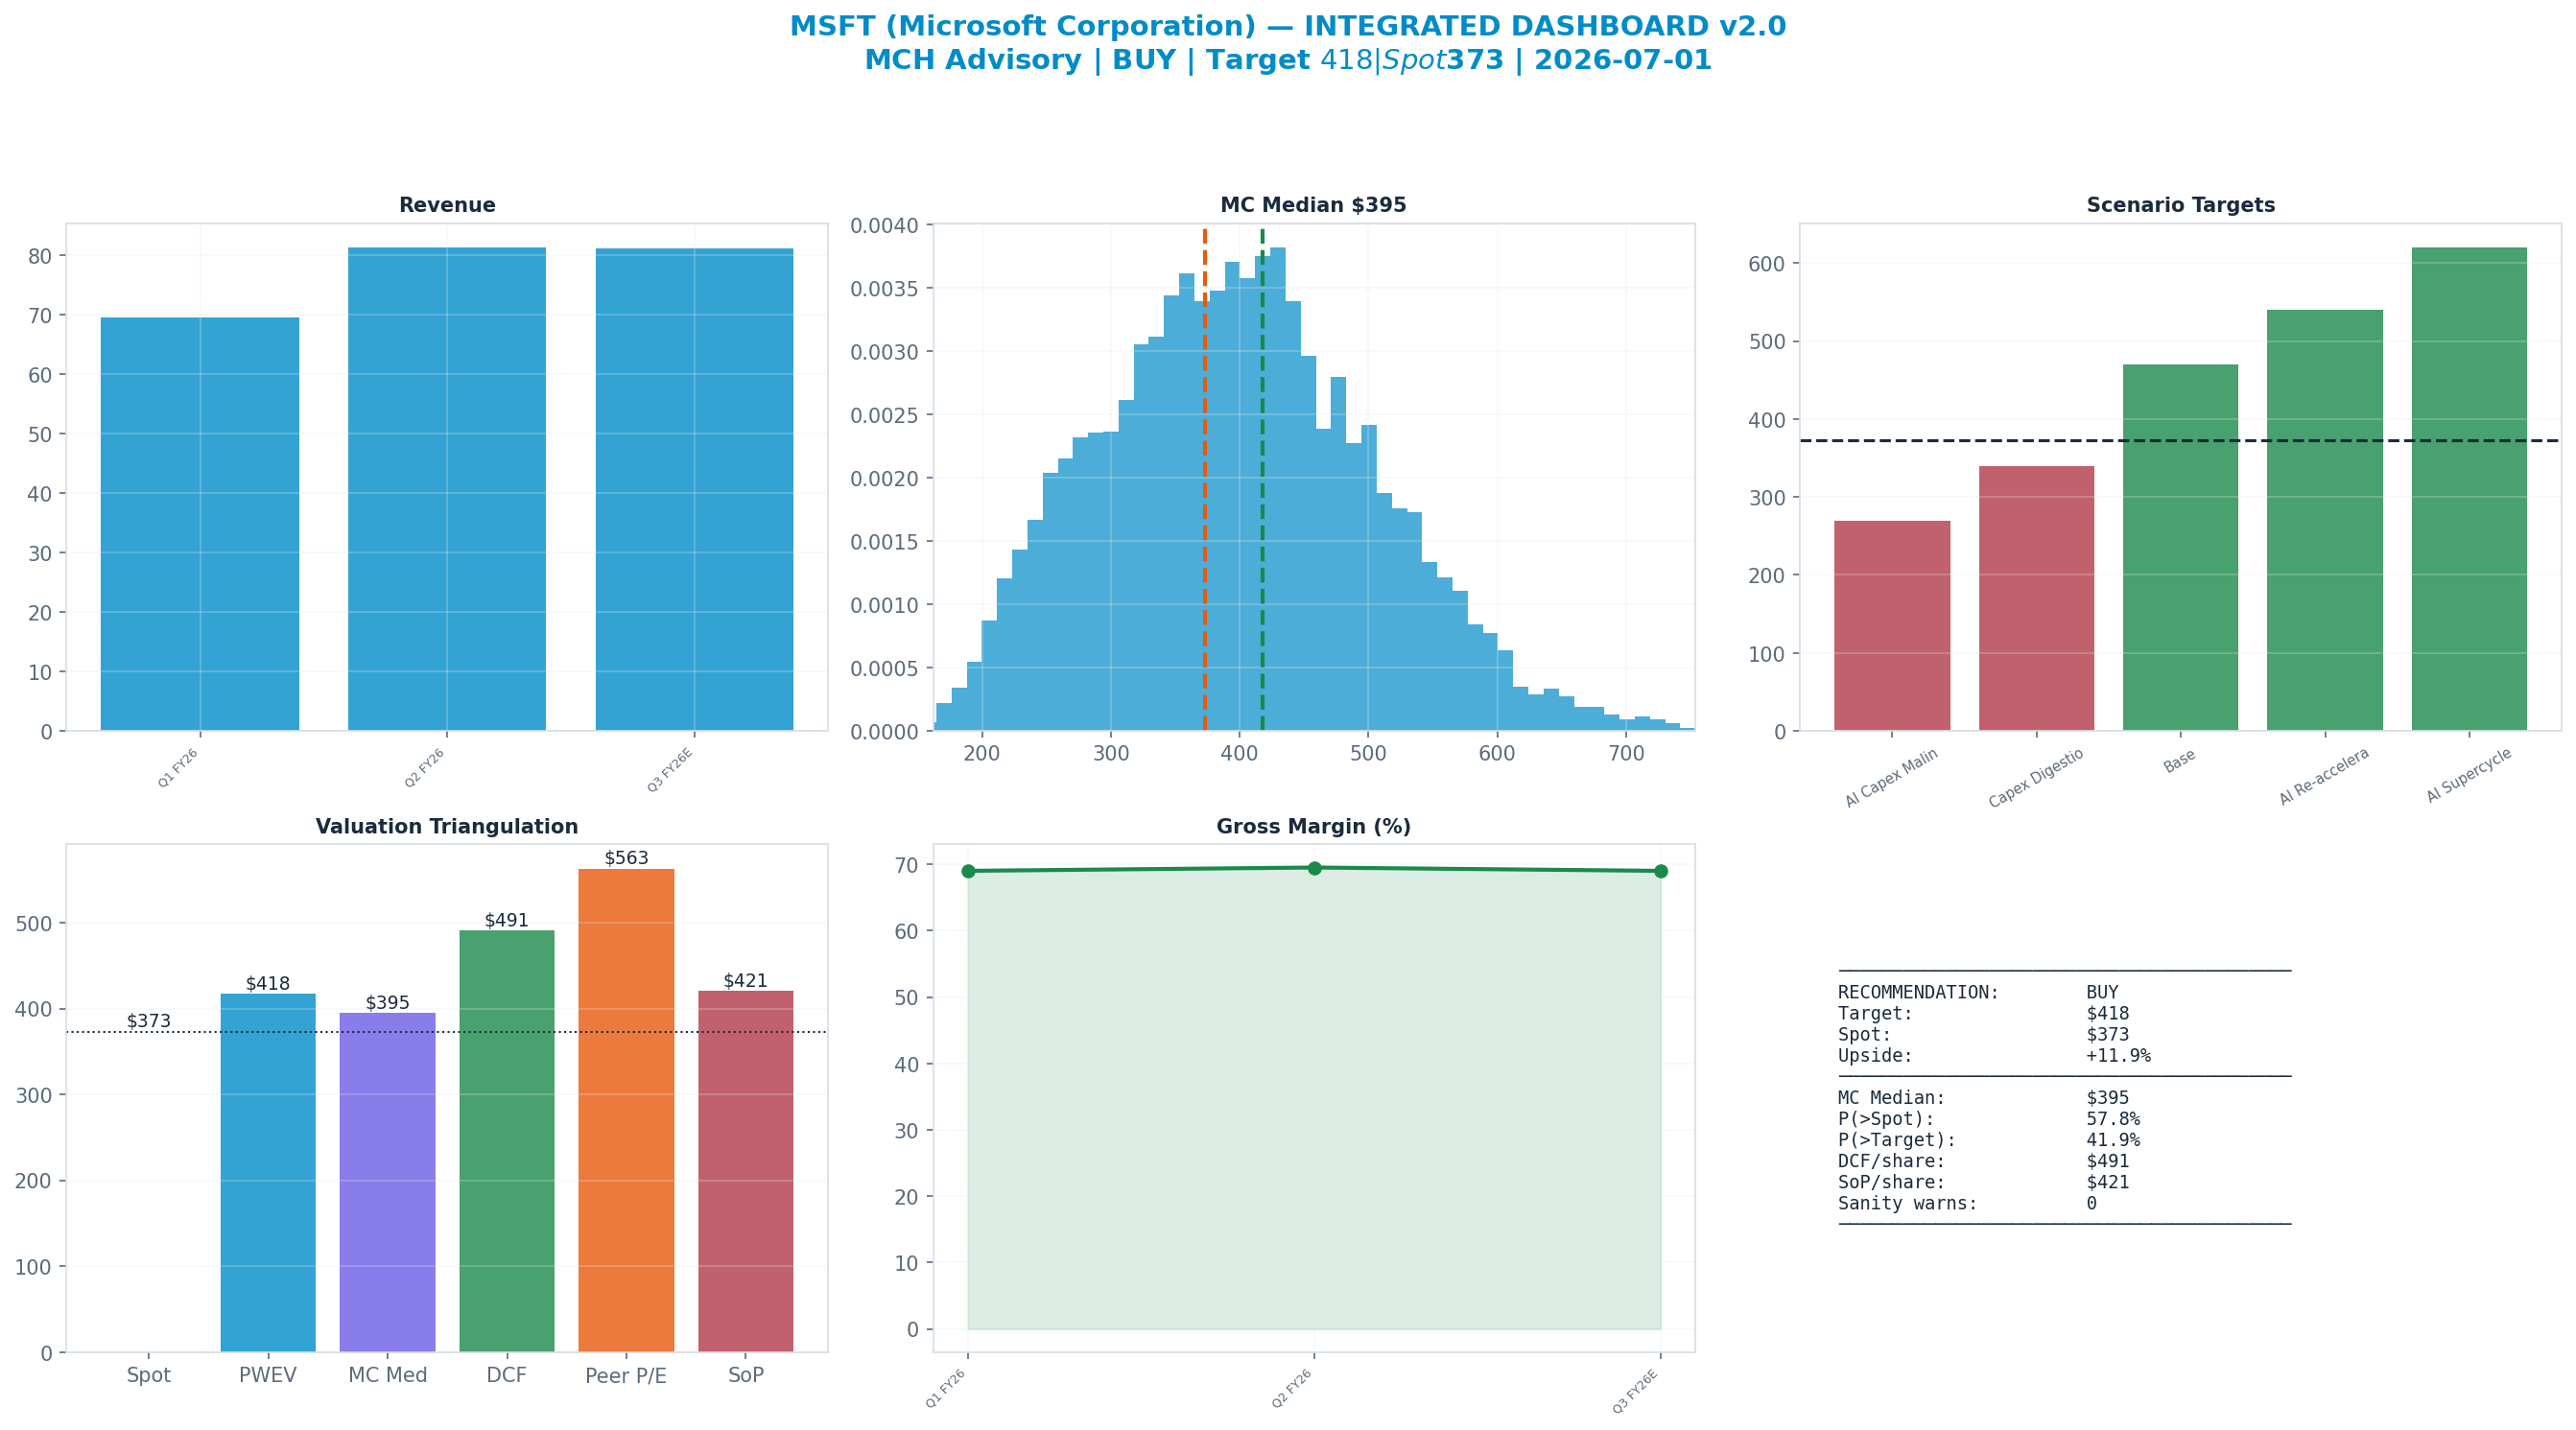
Methodology: Valuation triangulated across five independent anchors — Monte Carlo (Student-t + regime switching), an independent DCF, peer re-rating, a sum-of-parts, and a scenario-weighted PWEV. Figures reconciled to mch_weekly_run live prices. Each chart below sits with the part of the thesis it evidences.
Investment Thesis
The bull case — 'AI Supercycle' (7% weight) — targets $620, +66% vs spot. It needs the multiple to hold or expand.
The dashboard below is the whole argument on one page: spot ($373) against each valuation anchor, the scenario tree, technicals and the options-implied move.
Anti-Thesis (The Real Bear Case)
The structural case — 'AI Capex Malinvestment (Structural)' (22%) — targets $270, -28% vs spot. This sits below the 52-week low — a genuine structural impairment, not a mild pullback.
Key Debate
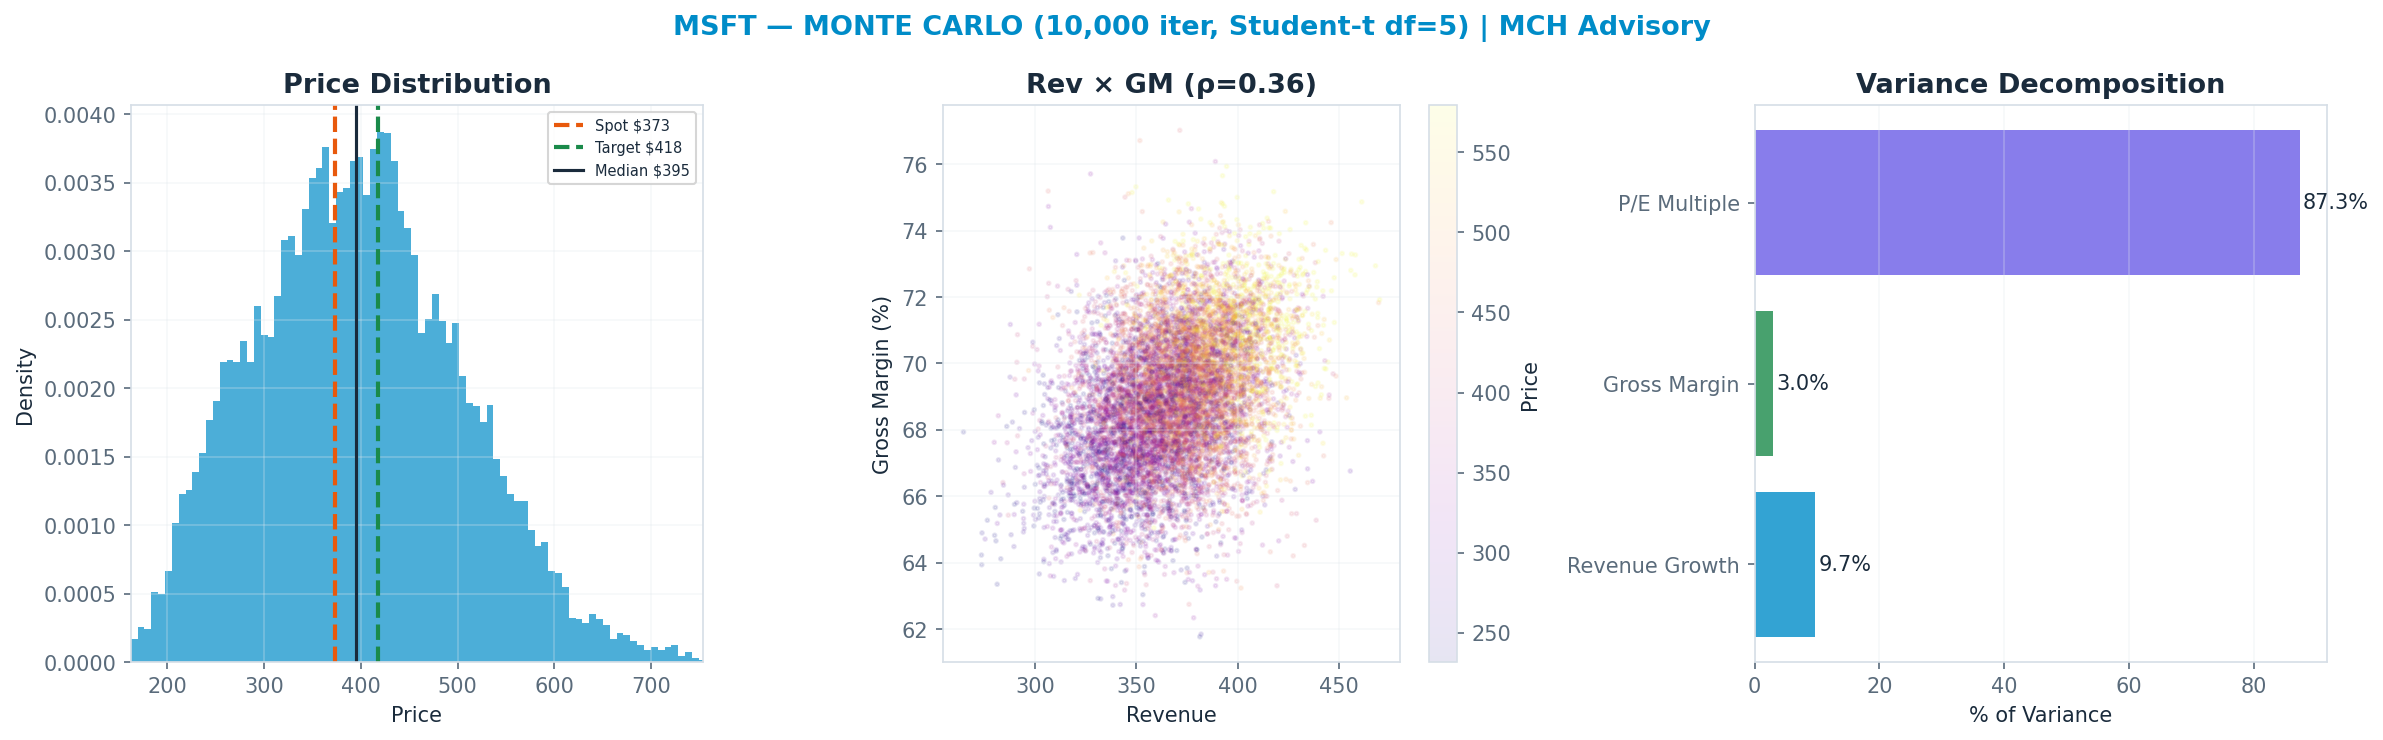
P/E Multiple explains 87% of Monte Carlo outcome variance — i.e. value is set by the multiple the market will pay, a rate/sentiment regime bet as much as an earnings bet.
Earnings-Call Disconfirmation & Sentiment
Derived signals from the MCH market-data store (Alpha Vantage transcripts + news). Quantitative tone only — a disconfirmation flag, not a substitute for reading the call.
Management vs analyst tone (2026Q2): management +0.35 vs analyst floor +0.04 → delta +0.31 (n=21 mgmt / 11 Q&A; 36th pctile across the S&P book, z -0.5).
Flag: TYPICAL — management-vs-analyst tone within the normal cross-sectional range.
| Quarter | Mgmt | Analyst | Delta |
|---|---|---|---|
| 2026Q2 | +0.35 | +0.04 | +0.31 |
| 2026Q1 | +0.52 | +0.23 | +0.29 |
| 2025Q4 | +0.45 | +0.27 | +0.18 |
| 2025Q3 | +0.37 | +0.39 | -0.03 |
News (last 365d, 1008 articles): avg ticker sentiment +0.14 (bullish 7% / bearish 3%)
Scenario Analysis
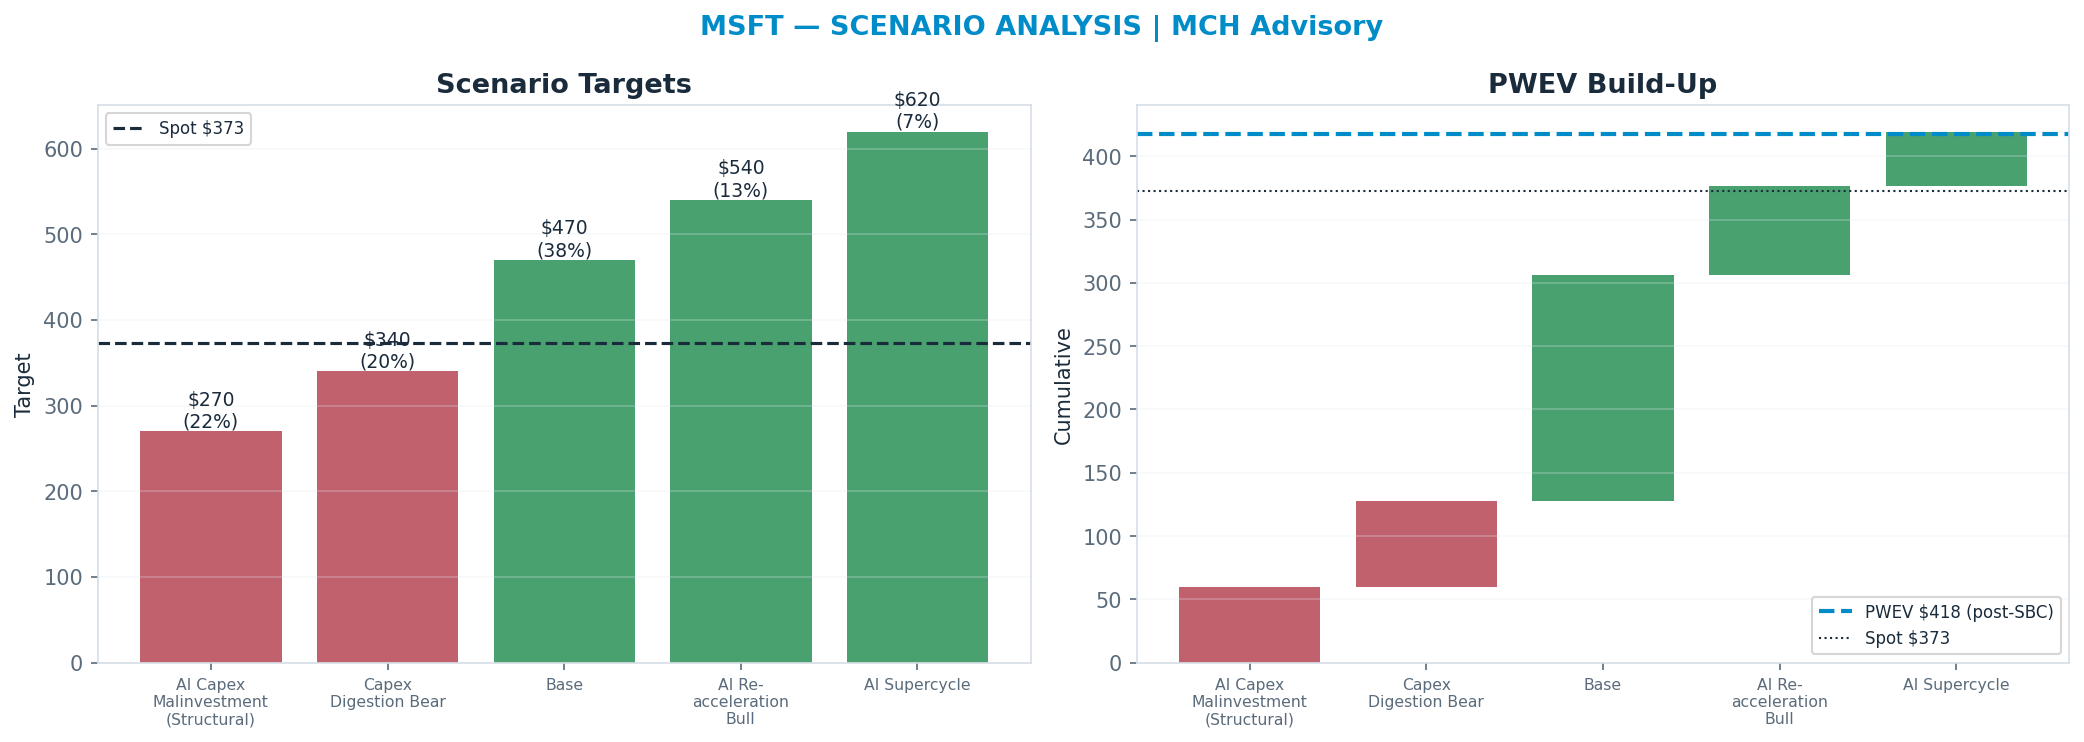
The tree runs from a structural 'AI Capex Malinvestment (Structural)' downside ($270) to a 'AI Supercycle' bull case ($620); the probability-weighted blend (PWEV $418) is +12% versus spot.
| Scenario | Probability | Target | Return |
|---|---|---|---|
| AI Capex Malinvestment (Structural) | 22% | $270 | -28% |
| Capex Digestion Bear | 20% | $340 | -9% |
| Base | 38% | $470 | +26% |
| AI Re-acceleration Bull | 13% | $540 | +45% |
| AI Supercycle | 7% | $620 | +66% |
| Probability-Weighted (PWEV, after SBC dilution) | — | $418 | +12% |
SBC charge: scenario targets are gross per-share prices; the PWEV is reduced by one year of stock-based-compensation dilution (0.5% of shares, on SBC ≈ 4% of revenue), trimming the gross PWEV of $420 to $418 (-0.5%). SBC is charged once, as dilution — never also deducted from FCF.
Scenario rationale — what each probability buys (the driver path behind every target):
- AI Capex Malinvestment (Structural) (22%, $270). FY27-28 AI capex ($80B+/yr) fails to convert to Azure-AI revenue; the useful-life extension reverses into a D&A / writedown cycle; Azure decelerates to mid-teens. The multiple re-rates to ~14x as the AI-capex thesis breaks. Target $270 sits below the 52-week low - a genuine structural impairment, not a pullback. Drivers — azure_growth: ~15%; ai_attach: stalls; op_margin: ~42%; multiple: ~14x.
- Capex Digestion Bear (20%, $340). Capex weighs on FCF and ROIC near-term; the multiple stays capped ~17x even as revenue holds, because the market demands AI-revenue proof before re-rating. Drivers — azure_growth: ~22%; op_margin: ~45%; multiple: ~17x.
- Base (38%, $470). Azure holds ~28%, Copilot ramps to ~$15B run-rate, margins stay stable as scale offsets capex D&A; the multiple normalises from the de-rated 18.8x toward ~24x on proven monetization. Drivers — azure_growth: ~28%; ai_revenue: ~$45B; op_margin: ~48%; multiple: ~24x.
- AI Re-acceleration Bull (13%, $540). Azure re-accelerates above 32% on AI consumption, Copilot attach exceeds 20% of the commercial base, operating leverage expands margins; multiple ~28x. Drivers — azure_growth: >32%; ai_revenue: ~$60B; op_margin: ~50%; multiple: ~28x.
- AI Supercycle (7%, $620). AI revenue inflects and MSFT takes outsized platform share (agents, Foundry, the Copilot ecosystem); the build is vindicated and ROIC inflects up; multiple ~32x. Drivers — azure_growth: >38%; ai_revenue: >$80B; op_margin: >51%; multiple: ~32x.
Valuation Triangulation
Five anchors — but read them with their basis in mind. The Monte Carlo, the DCF terminal, and the peer re-rate all key off a market multiple, so they are not fully independent; only the discounted cash flows themselves are genuinely multiple-free. The discipline is to read the spread and weight the cash-based view, not to treat five numbers as five independent votes.
| Method | Basis | Fair Value | vs Spot |
|---|---|---|---|
| Monte Carlo median (Student-t + regime) | multiple | $395 | +6% |
| Sum-of-Parts | multiple | $421 | +13% |
| Peer P/E re-rate | multiple | $563 | +51% |
| Peer EV/Revenue re-rate | multiple | $325 | -13% |
| Scenario PWEV | multiple | $418 | +12% |
| DCF (5-year + terminal) | cash flow + terminal × | $491 | +32% |
| Triangulated (weighted) | — | $455 | +22% |
Rating vs blend — the key debate. The rating tracks the multiple-discipline fair value (Monte Carlo $395 + scenario PWEV $418, ≈ spot); the weighted blend $455 (+22%) sits above it because the cash-flow DCF ($491) is materially more optimistic than the market multiple. Whether the current multiple is justified is the central question for this name — and the principal upside risk to the rating.
Monte Carlo — the distribution, not a point
10,000 paths, Student-t shocks (fat tails) with a regime-switching overlay. The median lands at $395 and 58% of paths finish above spot. The variance decomposition shows the p/e multiple is the dominant swing factor (87% of variance). Value is a multiple bet: fundamentals move the answer far less than the rating does.
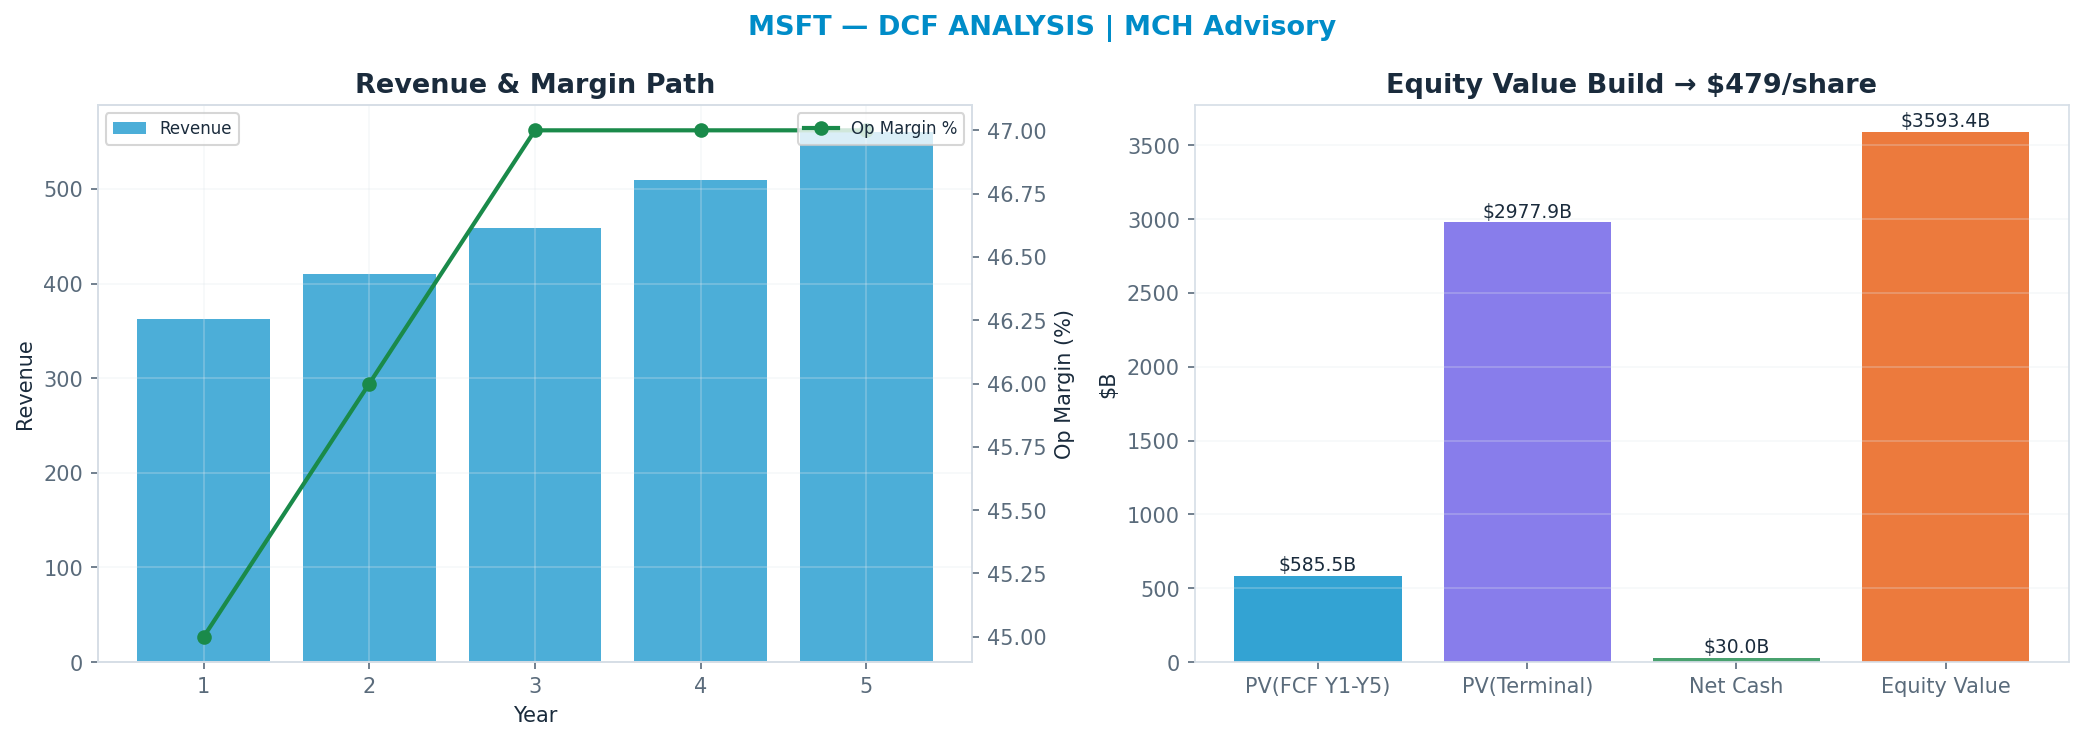
DCF — the cash-flow anchor
Independent of the market multiple: a 5-year path, WACC 8.0%, 22x terminal FCF multiple → $491. This anchor is deliberately the heaviest (35%): it is the valuation least hostage to the current multiple regime.
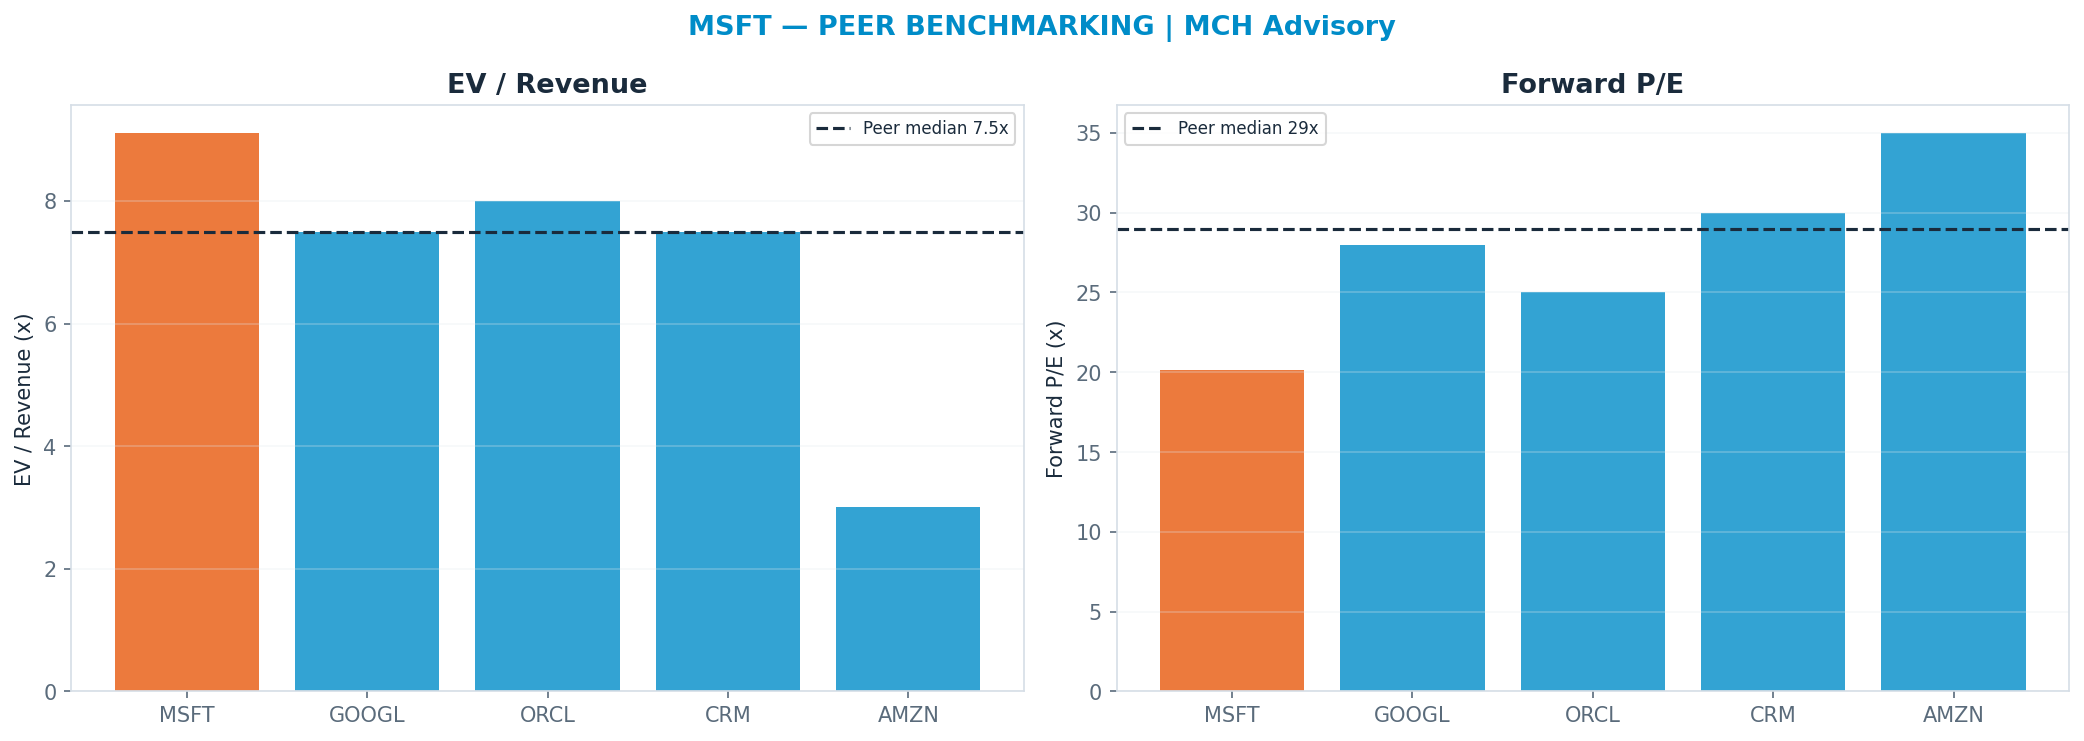
Peer benchmarking — relative value
Against the peer cohort, re-rating to the peer-median forward multiple (P/E 29.0x) implies $563. A premium is only justified by superior growth/margins; otherwise it is multiple risk. Weighted just 10% so the market's mood does not drive the fair value.
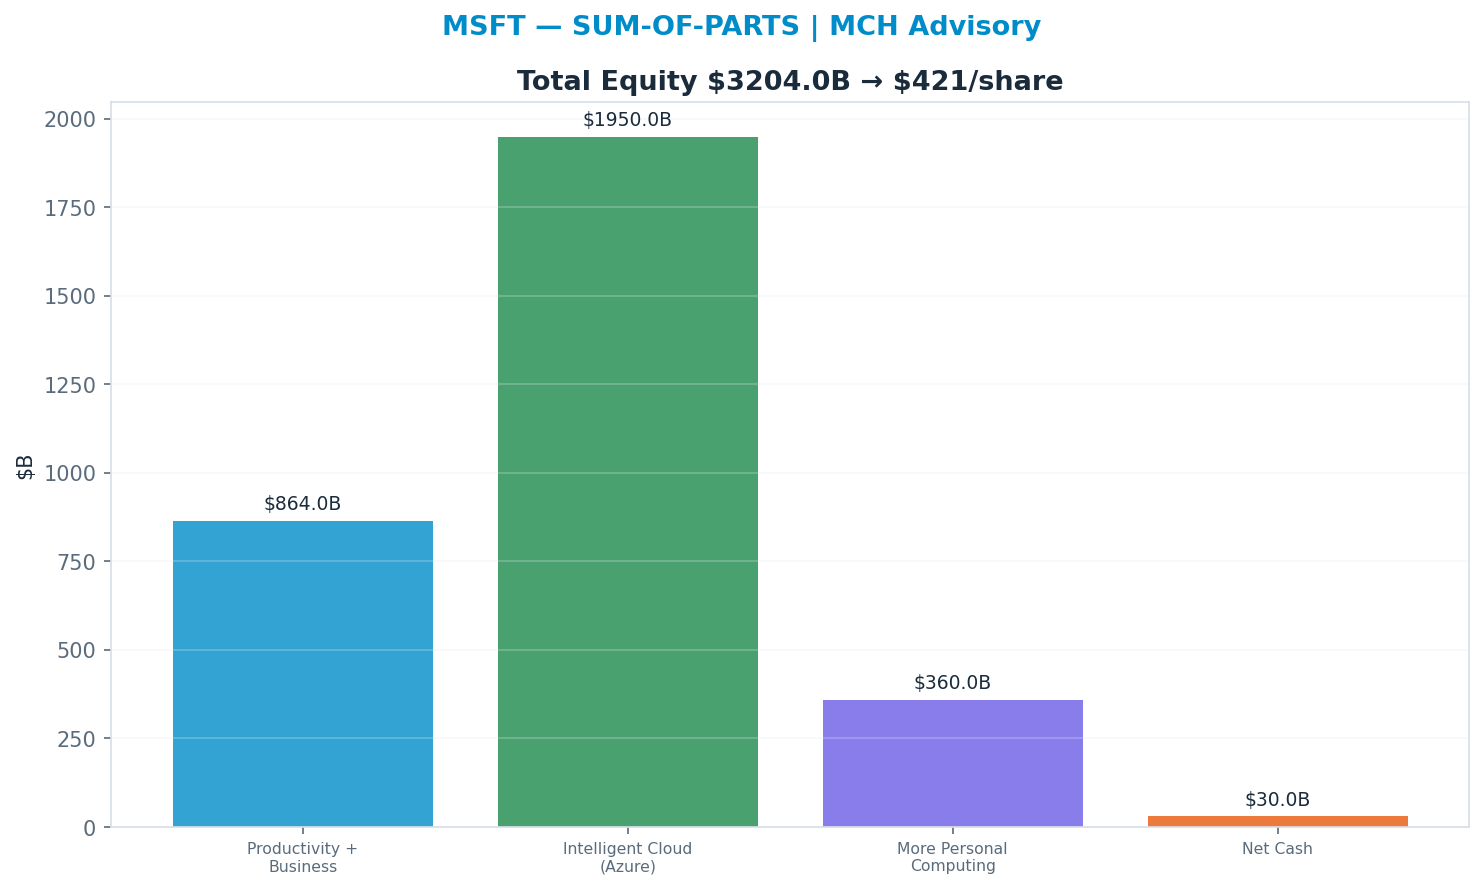
Sum-of-parts
Valuing each piece at the multiple it deserves (Productivity + Business 8x, Intelligent Cloud (Azure) 15x, More Personal Computing 5x) → $421. 'Intelligent Cloud (Azure)' dominates at 15.0× → $1,950B (61% of EV) — the segment whose multiple matters most.
Across all anchors the spread is tight (the methods corroborate one another).
Revenue-Segment Breakdown
The company-specific drivers behind the valuation — each segment carries its own growth, margin, multiple and capex intensity. (Tags: FACT reported · ESTIMATE from disclosures · INFERENCE judgment.)
| Segment | Revenue | Mix | Growth | Op margin | Multiple | Capex % | Tag |
|---|---|---|---|---|---|---|---|
| Productivity & Business Processes | $135B | 37% | 13% | 50% | 9x | 4% | FACT/ESTIMATE |
| Intelligent Cloud | $145B | 40% | 21% | 45% | 15x | 28% | FACT/ESTIMATE |
| More Personal Computing | $82B | 23% | 4% | 30% | 5x | 3% | FACT/ESTIMATE |
AI revenue, decomposed — the AI lines broken out (Azure-AI / Copilot / model-API / pass-through style), so the AI contribution is auditable:
| AI line | Run-rate | Growth | Gross margin | Capex % | Tag |
|---|---|---|---|---|---|
| Azure AI consumption | $22B | 55% | 50% | 35% | ESTIMATE |
| M365 Copilot seats | $12B | 45% | 65% | 5% | ESTIMATE |
| GitHub (incl. Copilot) | $2.5B | 30% | 55% | 5% | ESTIMATE |
| Model / API (Azure OpenAI Service) | $8B | 60% | 45% | 30% | ESTIMATE |
| OpenAI-linked Azure pass-through | $13B | 40% | 15% | 45% | INFERENCE |
- Azure AI consumption: Azure OpenAI Service + Foundry + AI-infra consumption
- M365 Copilot seats: Seat-based; ~$30/seat/mo on the M365 Commercial base
- GitHub (incl. Copilot): Developer platform + Copilot seats
- Model / API (Azure OpenAI Service): SUBSET of Azure AI consumption — shown for transparency, NOT additive (avoids double-count)
- OpenAI-linked Azure pass-through: Azure revenue from OpenAI's own compute; capacity/cost-plus economics — low margin
Named Exposures
OpenAI relationship (ESTIMATE/INFERENCE)
| Dimension | Assessment |
|---|---|
| Backlog share | ~15-25% of Azure commercial RPO is OpenAI-linked (est.) |
| Compute commitments | OpenAI committed to ~$250B of Azure over the agreement term (2025 restructuring disclosures) |
| Contract duration | Through 2030+; Azure exclusivity for frontier training relaxed in 2025 |
| Margin impact | Azure-from-OpenAI is low-margin (capacity/cost-plus); MSFT also books a share of OpenAI losses via the equity method — a GAAP EPS drag |
| Substitution risk | Rising - OpenAI diversifying to Oracle, CoreWeave, Google TPUs and its own datacenters |
AI capex & depreciation (ESTIMATE/INFERENCE)
| Dimension | Assessment |
|---|---|
| Capex run-rate | ~$80B+/yr FY26 (est.); the majority is AI datacenter / GPU |
| Useful life | Server/GPU useful life ~6 yrs (extended from ~4) - flatters near-term D&A and EPS |
| Depreciation drag | D&A from the capex wave compresses FY27+ margins if AI revenue lags the build |
| ROIC risk | Incremental ROIC on the AI build is unproven - the core bear case |
Industry Context — AI Compute Stack
This name sits in the AI Compute Stack as a buyer (hyperscaler). Capex → near-term FCF/ROIC drag; AI revenue upside only if Azure-AI converts. A capex BUST relieves FCF but signals AI-demand weakness → multiple de-rate (net bearish). Its scenarios are not guessed in isolation — they inherit a single, shared view of the cluster's driver cycle, so the names that depend on the same event are mutually consistent.
Value chain: MSFT (buyer (hyperscaler)) · GOOGL (buyer (hyperscaler)) · AMZN (buyer (hyperscaler)) · META (buyer (hyperscaler)) · NVDA (supplier — AI accelerators) · LRCX (supplier — wafer-fab equipment) · MU (supplier — HBM / memory)
| Shared state | Capex path | House view | This name implies |
|---|---|---|---|
| AI Capex Bust | FY27 aggregate −30%+ (to ~$350B) | 22% | 22% |
| Digestion | FY27 flat / plateau (~$430-460B) | 20% | 20% |
| Sustained Build | FY27 +15-20% (to ~$500B) | 38% | 38% |
| Supercycle | FY27 +30%+ (to ~$600B+) | 20% | 20% |
On the cluster's key downside — AI Capex Bust (FY27 aggregate −30%+ (to ~$350B)) — this name implies 22% vs the cluster house view of 22% (in line with the house). The cluster's full cross-stock reconciliation governs that the names which ride the same capex cycle assign it comparable odds.
Structure: Concentration — Demand: 4 hyperscalers ≈ 60-70% of AI capex. Supply: NVDA dominates accelerators; TSMC is the single leading-edge fab; 3 HBM makers. (FACT/ESTIMATE) Barriers — CUDA software lock-in, HBM/CoWoS packaging supply, leading-edge fab access, networking (NVLink). (FACT) Pricing Power — Sits with NVDA today (~75% gross margin); erodes if custom ASICs (Google TPU, AWS Trainium, Meta MTIA) and AMD take share, or inference shifts to cheaper compute. (INFERENCE) Substitution Risk — Custom silicon, model-efficiency gains (DeepSeek-style $/token collapse), inference-vs-training mix shift, and the circular vendor-financing of neoclouds/OpenAI. (INFERENCE)
Model Appendix
DCF — line items
| Year | Revenue | Op income | − Capex | + D&A | FCF | PV(FCF) |
|---|---|---|---|---|---|---|
| FY+1 | $363B | $163B | $49B | $49B | $136B | $125B |
| FY+2 | $410B | $189B | $55B | $50B | $151B | $130B |
| FY+3 | $459B | $216B | $61B | $52B | $169B | $135B |
| FY+4 | $510B | $240B | $68B | $55B | $186B | $136B |
| FY+5 | $561B | $264B | $75B | $59B | $203B | $138B |
| Terminal | — | — | — | — | $203B × 22x | $3041B |
FCF is bridged: NOPAT + D&A − Capex − ΔNWC (capex intensity 13% of revenue, weighted from the segments) — not a single conversion fudge.
WACC 8.0% · Σ PV(FCF) $664B + PV(terminal) $3041B = EV $3706B; + net cash → equity $3736B ÷ diluted shares 7.62B = $491/share (exit-multiple terminal).
- Gordon (perpetuity-growth) terminal at 2.5% → $429/share — a genuinely non-multiple, cash-based cross-check; the exit-multiple and Gordon values bracket the terminal-value risk.
- Incremental ROIC on the forecast capex ≈ 27% vs WACC 8% → above WACC — the build is value-creative.
Peer set
| Peer | EV/Rev | Fwd P/E | Growth | Op margin |
|---|---|---|---|---|
| GOOGL | 7.5x | 28x | 14% | 32% |
| ORCL | 8.0x | 25x | 10% | 34% |
| CRM | 7.5x | 30x | 10% | 30% |
| AMZN | 3.0x | 35x | 13% | 11% |
| Median | 7.5x | 29.0x | — | — |
Peer-median fwd P/E → $563; EV/Rev → $325.
Weighted fair-value math
| Anchor | Value | Weight | Contribution |
|---|---|---|---|
| DCF | $491 | 35% | $172 |
| Scenario PWEV | $418 | 25% | $104 |
| Monte Carlo median | $395 | 15% | $59 |
| Sum-of-parts | $421 | 15% | $63 |
| Peer P/E | $563 | 10% | $56 |
| Triangulated | — | 100% | $455 |
Sensitivity
DCF/share — WACC × terminal multiple
| WACC \ Term× | 15.4x | 18.7x | 22.0x | 25.3x | 28.6x |
|---|---|---|---|---|---|
| 6% | $403 | $469 | $535 | $601 | $666 |
| 7% | $387 | $449 | $512 | $575 | $638 |
| 8% | $371 | $431 | $491 | $550 | $610 |
| 9% | $356 | $413 | $470 | $527 | $585 |
| 10% | $342 | $396 | $451 | $505 | $560 |
DCF/share — revenue CAGR Δ × op-margin Δ
| CAGRΔ \ MgnΔ | -3.0pp | -1.5pp | +0.0pp | +1.5pp | +3.0pp |
|---|---|---|---|---|---|
| -3.0pp | $411 | $425 | $440 | $455 | $469 |
| -1.5pp | $433 | $449 | $465 | $480 | $496 |
| +0.0pp | $457 | $474 | $491 | $507 | $524 |
| +1.5pp | $482 | $500 | $518 | $535 | $553 |
| +3.0pp | $509 | $527 | $546 | $565 | $584 |
Tornado — DCF/share swing by driver (widest first)
| Driver | Low | High | Swing |
|---|---|---|---|
| Terminal × ±15% | $431 | $550 | $120 |
| Revenue CAGR ±3pp | $440 | $546 | $106 |
| Op margin ±3pp | $457 | $524 | $67 |
| WACC ±1pp | $470 | $512 | $42 |
| FCF conversion ±10% | $491 | $491 | $0 |
Company lever — SoP/share vs Intelligent Cloud multiple (AI re-rating) (base 15x)
| Multiple | 10.5x | 12.8x | 15.0x | 17.2x | 19.5x |
|---|---|---|---|---|---|
| SoP/share | $428 | $473 | $516 | $559 | $603 |
Load-Bearing Assumptions
DCF: WACC 8%, terminal multiple 22×, FY+5 revenue $561B. Triangulation leans 35% on DCF, 25% on PWEV.
Reasons the Thesis Could Fail (Falsifiable)
The valuation is multiple-dependent (87% of variance); a de-rating toward the DCF anchor ($491) implies +32%.
Fact / Inference / Speculation
- FACT: Spot $373; 52-week range $349–$551; engine rating HOLD; base-case target $418 (+12%).
- INFERENCE: Triangulated FV $455 (+22%). P/E Multiple explains 87% of Monte Carlo outcome variance — i.e. value is set by the multiple the market will pay, a rate/sentiment regime bet as much as an earnings bet.
- SPECULATION: At current prices the embedded bet is that the multiple holds or expands — P/E Multiple carries 87% of outcome variance.
Recommendation: HOLD
Balanced: triangulated fair value $455 (+22% vs spot); the outcome hinges on P/E Multiple. The debate is P/E Multiple (87% of variance) — fundamentally a multiple/regime call. SBC runs 11000M TTM (disclosed in the appendix).