Rating: HOLD
| Metric | Value |
|---|---|
| Current Price | $238 |
| Triangulated Fair Value | $247 |
| 12-mo Scenario PWEV | $247 |
| Implied Return | +4% |
| Forward P/E | 31.8x |
| Market Cap | $2.50T |
| 52-Week Range | $140 – $260 |
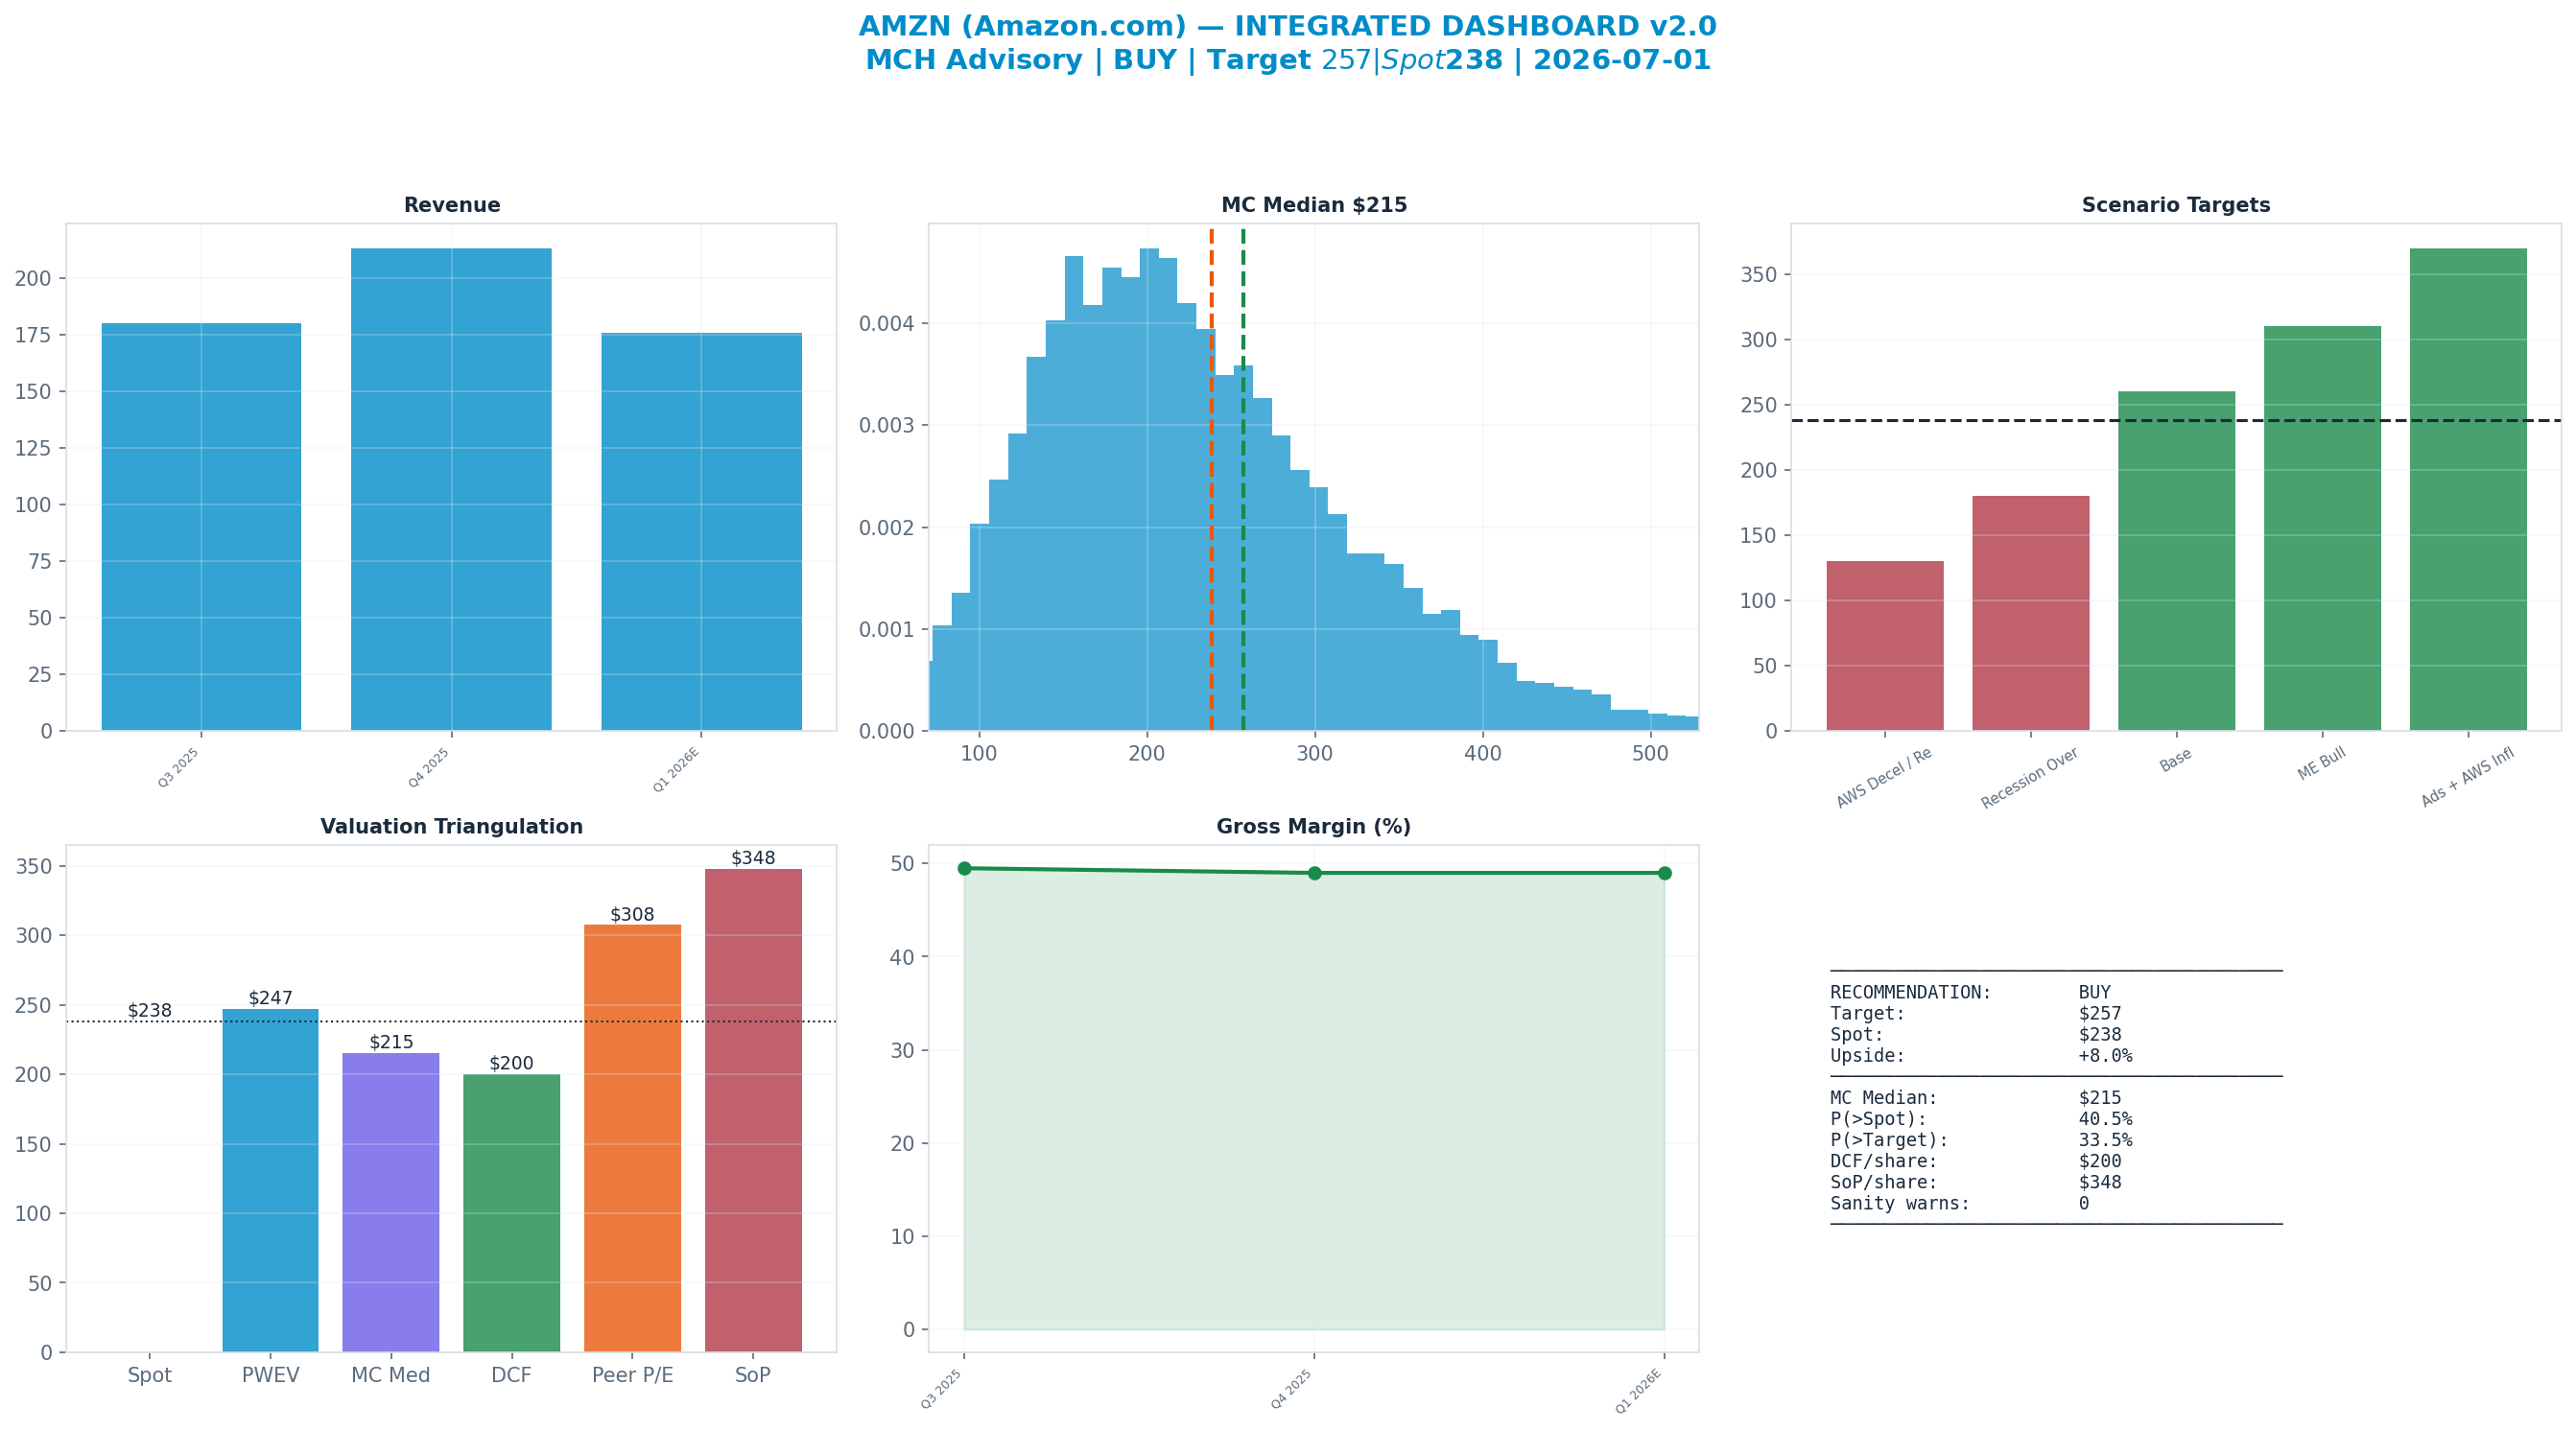
Methodology: Valuation triangulated across five independent anchors — Monte Carlo (Student-t + regime switching), an independent DCF, peer re-rating, a sum-of-parts, and a scenario-weighted PWEV. Figures reconciled to mch_weekly_run live prices. Each chart below sits with the part of the thesis it evidences.
Investment Thesis
The bull case — 'Ads + AWS Inflection' (10% weight) — targets $370, +55% vs spot. It needs the multiple to hold or expand.
The dashboard below is the whole argument on one page: spot ($238) against each valuation anchor, the scenario tree, technicals and the options-implied move.
Anti-Thesis (The Real Bear Case)
The structural case — 'AWS Decel / Retail Mgn Hit' (20%) — targets $130, -45% vs spot. This sits below the 52-week low — a genuine structural impairment, not a mild pullback.
Key Debate
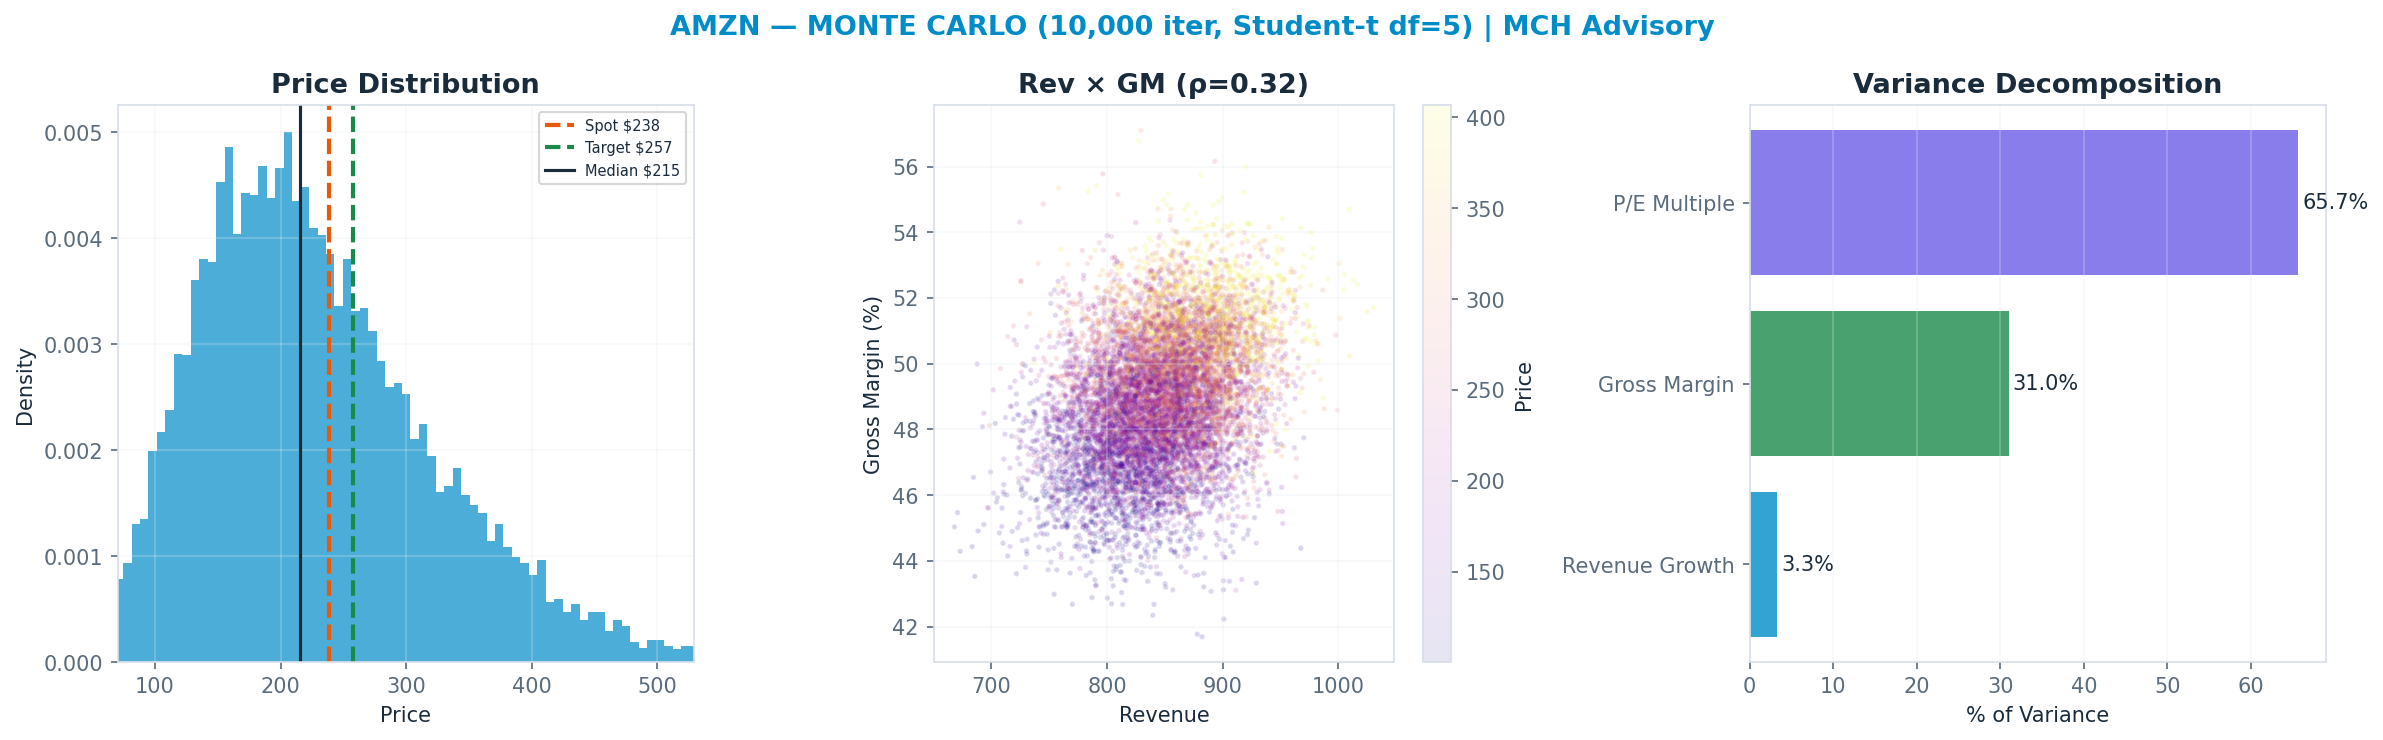
P/E Multiple explains 66% of Monte Carlo outcome variance — i.e. value is set by the multiple the market will pay, a rate/sentiment regime bet as much as an earnings bet.
Earnings-Call Disconfirmation & Sentiment
Derived signals from the MCH market-data store (Alpha Vantage transcripts + news). Quantitative tone only — a disconfirmation flag, not a substitute for reading the call.
Management vs analyst tone (2026Q1): management +0.64 vs analyst floor +0.00 → delta +0.64 (n=10 mgmt / 6 Q&A; 94th pctile across the S&P book, z +1.5).
Flag: ELEVATED — management unusually upbeat vs the analyst floor relative to peers (disconfirmation watch).
| Quarter | Mgmt | Analyst | Delta |
|---|---|---|---|
| 2026Q1 | +0.64 | +0.00 | +0.64 |
| 2025Q4 | +0.46 | +0.32 | +0.14 |
| 2025Q3 | +0.66 | +0.40 | +0.26 |
| 2025Q2 | +0.59 | +0.00 | +0.59 |
News (last 365d, 1000 articles): avg ticker sentiment +0.18 (bullish 11% / bearish 2%)
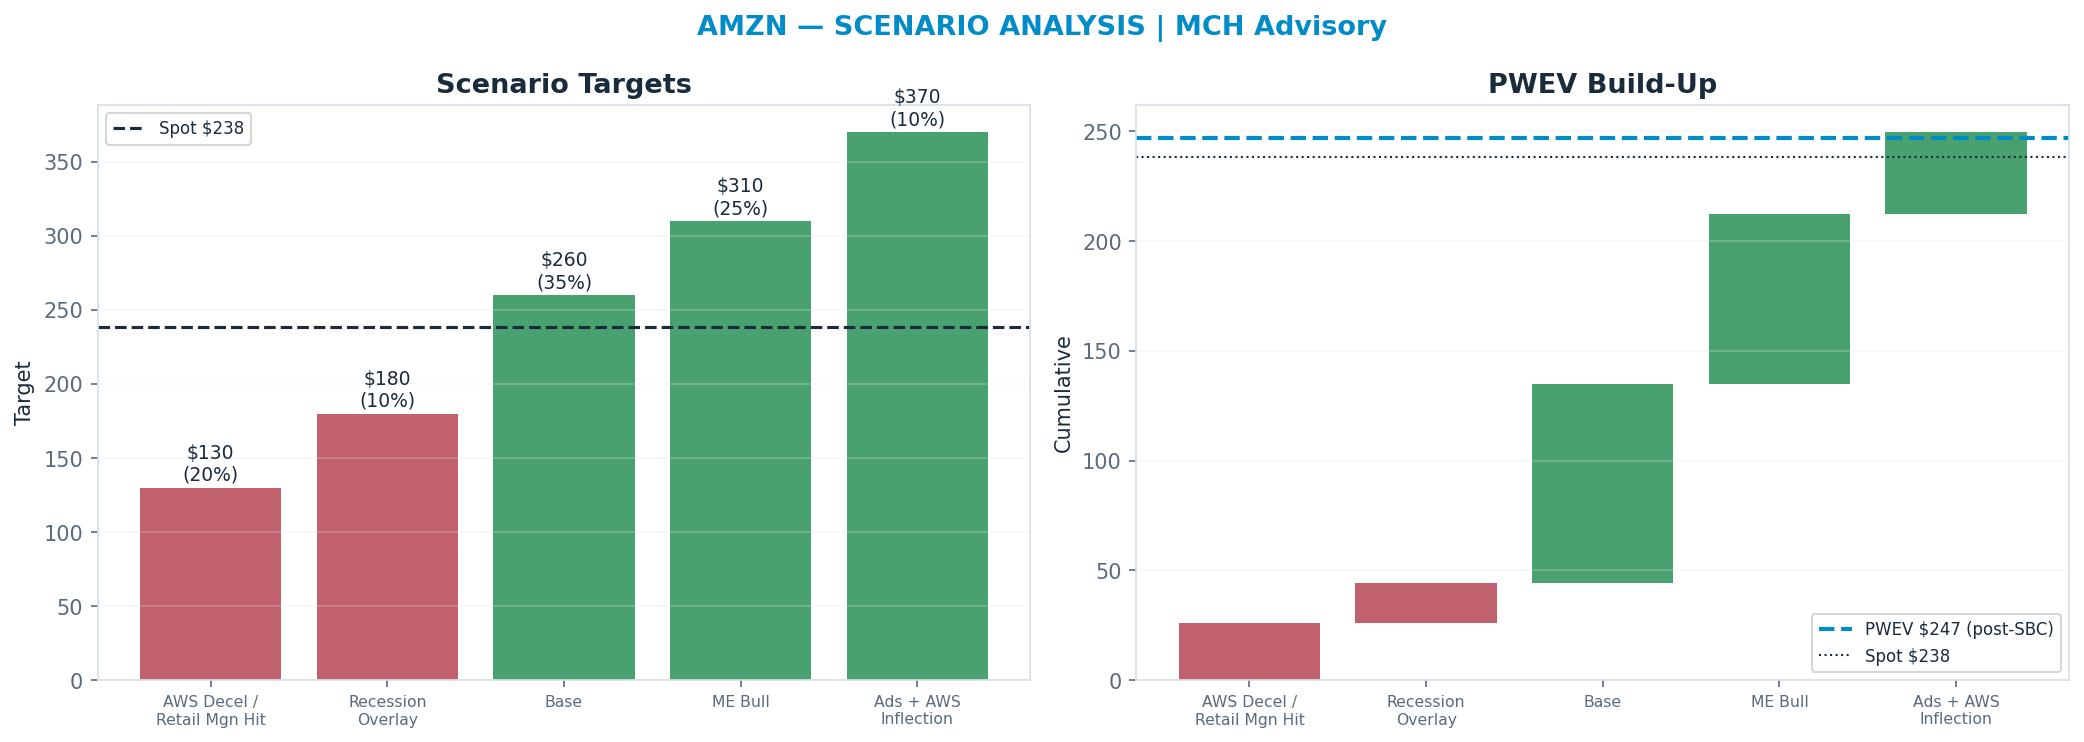
Scenario Analysis
The tree runs from a structural 'AWS Decel / Retail Mgn Hit' downside ($130) to a 'Ads + AWS Inflection' bull case ($370); the probability-weighted blend (PWEV $247) is +4% versus spot.
| Scenario | Probability | Target | Return |
|---|---|---|---|
| AWS Decel / Retail Mgn Hit | 20% | $130 | -45% |
| Recession Overlay | 10% | $180 | -24% |
| Base | 35% | $260 | +9% |
| ME Bull | 25% | $310 | +30% |
| Ads + AWS Inflection | 10% | $370 | +55% |
| Probability-Weighted (PWEV, after SBC dilution) | — | $247 | +4% |
SBC charge: scenario targets are gross per-share prices; the PWEV is reduced by one year of stock-based-compensation dilution (1.0% of shares, on SBC ≈ 4% of revenue), trimming the gross PWEV of $250 to $247 (-1.0%). SBC is charged once, as dilution — never also deducted from FCF.
Scenario rationale — what each probability buys (the driver path behind every target):
- AWS Decel / Retail Mgn Hit (20%, $130). AWS growth fades toward mid-teens as AI capacity outruns consumption while D&A from the build steps up, and North America retail margin gives back gains on cost-to-serve and competitive pricing. The AWS profit engine de-rates and the consolidated multiple compresses as the AI-capex thesis is questioned. The implied target sits below the 52-week low — a genuine structural impairment, not a pullback. Drivers — aws_growth: ~14%; aws_op_margin: ~30%; na_retail_margin: ~5%; group_multiple: compresses.
- Recession Overlay (10%, $180). A consumer/enterprise slowdown pressures retail units and advertising budgets while enterprises optimize AWS spend, capping group growth in the high-single digits. Margins hold better than revenue because regionalization and ad mix are structurally sticky, but the multiple stays capped until demand visibility returns. Drivers — aws_growth: ~16%; ad_growth: ~10%; na_retail_margin: ~6%; group_multiple: capped.
- Base (35%, $260). AWS holds ~20% on steady migration plus AI consumption, Advertising compounds ~20% at ~40% margin, and North America retail margin grinds higher on fulfillment efficiency. Operating income mix shifts further toward AWS + Ads (the profit pillars), and the consolidated multiple normalizes on proven AI monetization and FCF inflection. Drivers — aws_growth: ~20%; aws_op_margin: ~36%; ad_growth: ~20%; na_retail_margin: ~7%.
- ME Bull (25%, $310). Retail operating margin expands well above trend as regionalization, automation and 3P/ads mix compound, and AWS reaccelerates above 22% on AI consumption. Group operating income inflects faster than revenue as the high-margin pillars carry the mix, and the multiple re-rates on durable FCF. Drivers — aws_growth: >22%; aws_op_margin: ~38%; ad_growth: ~22%; na_retail_margin: ~9%.
- Ads + AWS Inflection (10%, $370). Advertising sustains 20%+ at 40%+ margins (Prime Video ads + DSP) and AWS AI consumption inflects — Bedrock and Trainium capacity convert to high-utilization revenue, vindicating the capex build and lifting AWS ROIC. The two highest-margin pillars drive disproportionate operating-income upside and a full multiple re-rate. Drivers — aws_growth: >25%; aws_op_margin: >38%; ad_growth: >22%; ad_op_margin: >40%.
Valuation Triangulation
Five anchors — but read them with their basis in mind. The Monte Carlo, the DCF terminal, and the peer re-rate all key off a market multiple, so they are not fully independent; only the discounted cash flows themselves are genuinely multiple-free. The discipline is to read the spread and weight the cash-based view, not to treat five numbers as five independent votes.
| Method | Basis | Fair Value | vs Spot |
|---|---|---|---|
| Monte Carlo median (Student-t + regime) | multiple | $215 | -10% |
| Sum-of-Parts | multiple | $348 | +46% |
| Peer P/E re-rate | multiple | $308 | +29% |
| Peer EV/Revenue re-rate | multiple | $329 | +38% |
| Scenario PWEV | multiple | $247 | +4% |
| DCF (5-year + terminal) | cash flow + terminal × | $200 | -16% |
| Triangulated (weighted) | — | $247 | +4% |
Monte Carlo — the distribution, not a point
10,000 paths, Student-t shocks (fat tails) with a regime-switching overlay. The median lands at $215 and 40% of paths finish above spot. The variance decomposition shows the p/e multiple is the dominant swing factor (66% of variance). Value is a multiple bet: fundamentals move the answer far less than the rating does.
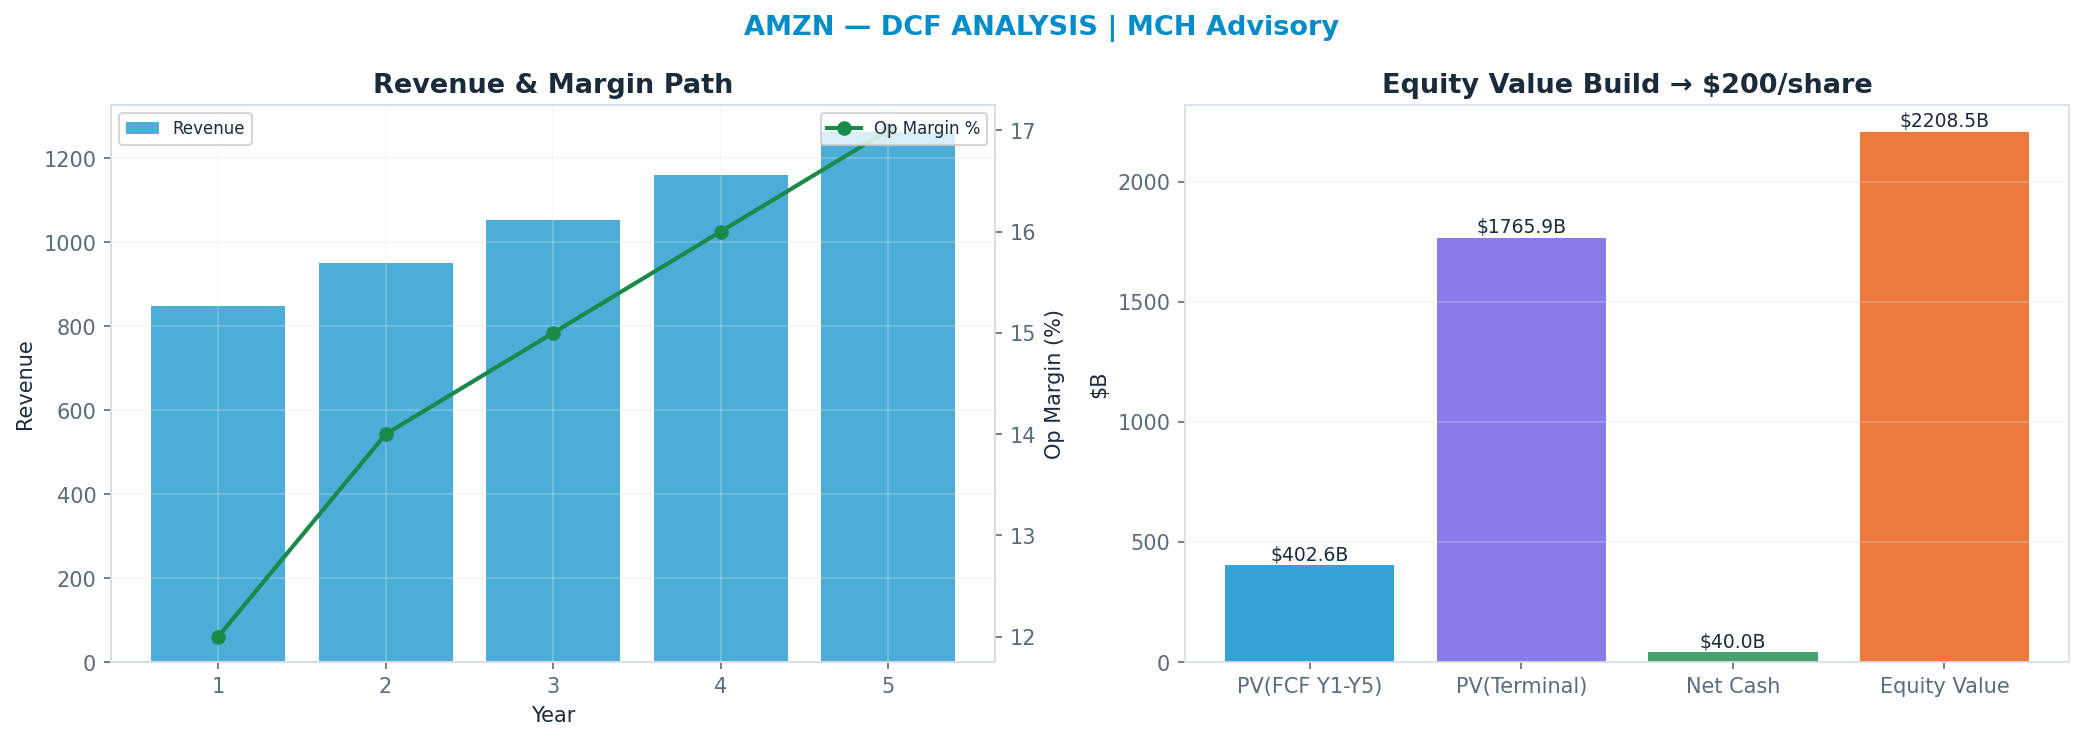
DCF — the cash-flow anchor
Independent of the market multiple: a 5-year path, WACC 9.5%, 20x terminal FCF multiple → $200. This anchor is deliberately the heaviest (35%): it is the valuation least hostage to the current multiple regime.
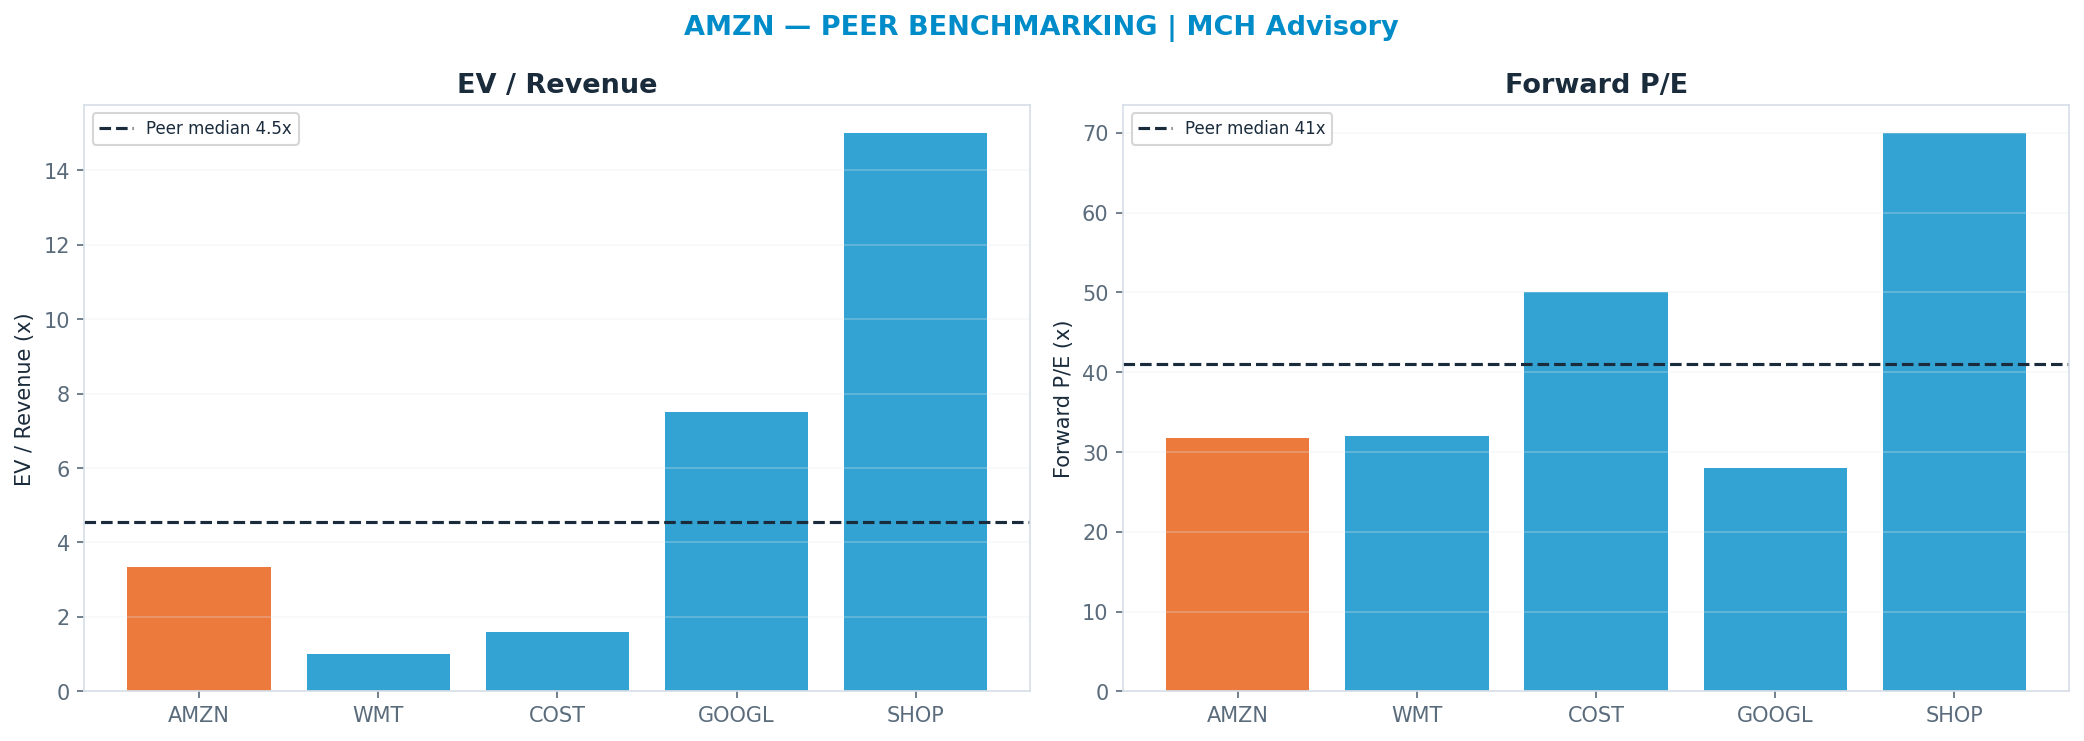
Peer benchmarking — relative value
Against the peer cohort, re-rating to the peer-median forward multiple (P/E 41.0x) implies $308. A premium is only justified by superior growth/margins; otherwise it is multiple risk. Weighted just 10% so the market's mood does not drive the fair value.
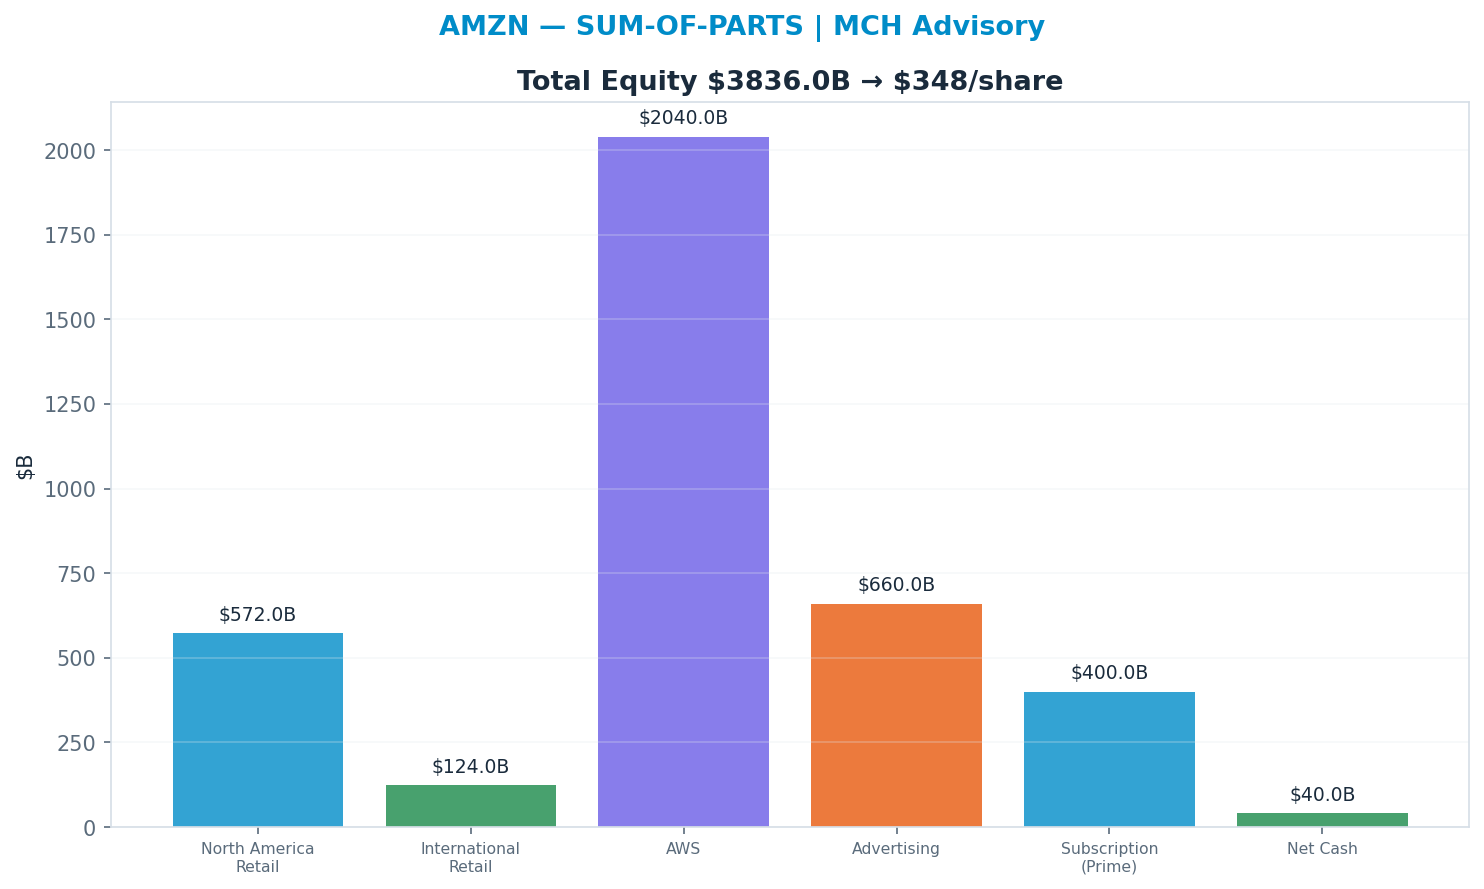
Sum-of-parts
Valuing each piece at the multiple it deserves (North America Retail 1x, International Retail 1x, AWS 17x, Advertising 12x, Subscription (Prime) 8x) → $348. 'AWS' dominates at 17.0× → $2,040B (54% of EV) — the segment whose multiple matters most.
Across all anchors the spread is wide (genuine disagreement — low valuation confidence).
Revenue-Segment Breakdown
The company-specific drivers behind the valuation — each segment carries its own growth, margin, multiple and capex intensity. (Tags: FACT reported · ESTIMATE from disclosures · INFERENCE judgment.)
| Segment | Revenue | Mix | Growth | Op margin | Multiple | Capex % | Tag |
|---|---|---|---|---|---|---|---|
| North America Retail | $450B | 53% | 9% | 7% | 0.8x | 6% | FACT/ESTIMATE |
| International Retail | $160B | 19% | 10% | 3% | 0.7x | 5% | FACT/ESTIMATE |
| AWS | $140B | 16% | 20% | 36% | 9x | 45% | FACT/ESTIMATE |
| Advertising | $60B | 7% | 20% | 40% | 7x | 3% | FACT/ESTIMATE |
| Subscription / Prime | $50B | 6% | 11% | 25% | 5x | 2% | FACT/ESTIMATE |
AI revenue, decomposed — the AI lines broken out (Azure-AI / Copilot / model-API / pass-through style), so the AI contribution is auditable:
| AI line | Run-rate | Growth | Gross margin | Capex % | Tag |
|---|---|---|---|---|---|
| AWS AI total (Bedrock + SageMaker + AI compute) | $18B | 70% | 45% | 50% | ESTIMATE |
| Bedrock (model / API) | $6B | 80% | 50% | 40% | ESTIMATE |
| Trainium / Inferentia (custom silicon) | $5B | 90% | 55% | 55% | ESTIMATE/INFERENCE |
| SageMaker (ML platform) | $4B | 40% | 55% | 35% | ESTIMATE |
| Anthropic-linked AWS compute pass-through | $8B | 60% | 20% | 55% | INFERENCE |
- AWS AI total (Bedrock + SageMaker + AI compute): Aggregate AWS AI/ML run-rate; the lines below decompose it and are SUBSETS — NOT additive
- Bedrock (model / API): SUBSET of AWS AI total — managed foundation-model API (Anthropic, Amazon Nova, Llama, etc.); consumption-priced
- Trainium / Inferentia (custom silicon): SUBSET — in-house accelerators; structural cost/margin advantage vs merchant GPU (lower $/training-hour, less Nvidia dependence). Capacity sold as Trn/Inf instances
- SageMaker (ML platform): SUBSET — build/train/deploy ML platform; more mature, slower-growing than Bedrock
- Anthropic-linked AWS compute pass-through: AWS revenue from Anthropic's own training/inference on Trainium under the compute commitment; capacity/cost-plus economics — low margin. Direct analog to the OpenAI/Azure pass-through; partly circular with Amazon's investment
Named Exposures
Anthropic relationship (FACT/ESTIMATE/INFERENCE)
| Dimension | Assessment |
|---|---|
| Investment | ~$8B total cumulative equity investment (convertible notes / minority stake); Amazon is a primary cloud and primary training partner |
| Compute commitments | Anthropic committed to AWS as a primary training partner; multi-year, multi-billion compute consumption on Trainium (Project Rainier-class clusters) |
| Trainium adoption | Anthropic is the anchor Trainium customer — validates Amazon's custom silicon and lowers its Nvidia dependence; a strategic moat datapoint |
| Margin impact | Pass-through compute is low-margin (capacity/cost-plus); some revenue is effectively round-tripped from Amazon's own investment — flatters AWS growth optics, not AWS margin |
| Substitution risk | Moderate-rising — Anthropic also uses Google TPUs and is not AWS-exclusive; if Anthropic diversifies compute, Trainium validation and pass-through revenue both soften |
AI capex & depreciation (ESTIMATE/INFERENCE)
| Dimension | Assessment |
|---|---|
| Capex run-rate | ~$100B+/yr (est.); the majority is AWS AI datacenter / accelerators; consolidated capex weighs on group FCF |
| Useful life | Server/accelerator useful life ~6 yrs (extended from ~5) — flatters near-term D&A and operating income |
| Depreciation drag | Rising D&A from the build compresses AWS margin if AI consumption lags capacity; also a near-term retail-margin and FCF drag at the consolidated level |
| ROIC risk | Incremental ROIC on the AI build is unproven — capacity ahead of demand is the core bear case; Amazon's own-silicon route improves unit economics if utilization holds |
Industry Context — AI Compute Stack
This name sits in the AI Compute Stack as a buyer (hyperscaler). AWS capex (Trainium/Inferentia reduce NVDA reliance); a bust helps retail-blended FCF but caps the AWS-AI re-rate. Its scenarios are not guessed in isolation — they inherit a single, shared view of the cluster's driver cycle, so the names that depend on the same event are mutually consistent.
Value chain: MSFT (buyer (hyperscaler)) · GOOGL (buyer (hyperscaler)) · AMZN (buyer (hyperscaler)) · META (buyer (hyperscaler)) · NVDA (supplier — AI accelerators) · LRCX (supplier — wafer-fab equipment) · MU (supplier — HBM / memory)
| Shared state | Capex path | House view | This name implies |
|---|---|---|---|
| AI Capex Bust | FY27 aggregate −30%+ (to ~$350B) | 22% | 20% |
| Digestion | FY27 flat / plateau (~$430-460B) | 20% | 10% |
| Sustained Build | FY27 +15-20% (to ~$500B) | 38% | 35% |
| Supercycle | FY27 +30%+ (to ~$600B+) | 20% | 35% |
On the cluster's key downside — AI Capex Bust (FY27 aggregate −30%+ (to ~$350B)) — this name implies 20% vs the cluster house view of 22% (in line with the house). The cluster's full cross-stock reconciliation governs that the names which ride the same capex cycle assign it comparable odds.
Structure: Concentration — Demand: 4 hyperscalers ≈ 60-70% of AI capex. Supply: NVDA dominates accelerators; TSMC is the single leading-edge fab; 3 HBM makers. (FACT/ESTIMATE) Barriers — CUDA software lock-in, HBM/CoWoS packaging supply, leading-edge fab access, networking (NVLink). (FACT) Pricing Power — Sits with NVDA today (~75% gross margin); erodes if custom ASICs (Google TPU, AWS Trainium, Meta MTIA) and AMD take share, or inference shifts to cheaper compute. (INFERENCE) Substitution Risk — Custom silicon, model-efficiency gains (DeepSeek-style $/token collapse), inference-vs-training mix shift, and the circular vendor-financing of neoclouds/OpenAI. (INFERENCE)
Model Appendix
DCF — line items
| Year | Revenue | Op income | − Capex | + D&A | FCF | PV(FCF) |
|---|---|---|---|---|---|---|
| FY+1 | $847B | $102B | $99B | $99B | $79B | $72B |
| FY+2 | $949B | $133B | $111B | $101B | $94B | $78B |
| FY+3 | $1054B | $158B | $123B | $105B | $105B | $80B |
| FY+4 | $1159B | $185B | $136B | $111B | $120B | $84B |
| FY+5 | $1263B | $215B | $148B | $120B | $139B | $88B |
| Terminal | — | — | — | — | $139B × 20x | $1766B |
FCF is bridged: NOPAT + D&A − Capex − ΔNWC (capex intensity 12% of revenue, weighted from the segments) — not a single conversion fudge.
WACC 9.5% · Σ PV(FCF) $403B + PV(terminal) $1766B = EV $2169B; + net cash → equity $2209B ÷ diluted shares 11.04B = $200/share (exit-multiple terminal).
- Gordon (perpetuity-growth) terminal at 2.5% → $157/share — a genuinely non-multiple, cash-based cross-check; the exit-multiple and Gordon values bracket the terminal-value risk.
- Incremental ROIC on the forecast capex ≈ 14% vs WACC 10% → above WACC — the build is value-creative.
Peer set
| Peer | EV/Rev | Fwd P/E | Growth | Op margin |
|---|---|---|---|---|
| WMT | 1.0x | 32x | 5% | 4% |
| COST | 1.6x | 50x | 8% | 3% |
| GOOGL | 7.5x | 28x | 14% | 32% |
| SHOP | 15.0x | 70x | 25% | 17% |
| Median | 4.55x | 41.0x | — | — |
Peer-median fwd P/E → $308; EV/Rev → $329.
Weighted fair-value math
| Anchor | Value | Weight | Contribution |
|---|---|---|---|
| DCF | $200 | 35% | $70 |
| Scenario PWEV | $247 | 25% | $62 |
| Monte Carlo median | $215 | 15% | $32 |
| Sum-of-parts | $348 | 15% | $52 |
| Peer P/E | $308 | 10% | $31 |
| Triangulated | — | 100% | $247 |
Sensitivity
DCF/share — WACC × terminal multiple
| WACC \ Term× | 14.0x | 17.0x | 20.0x | 23.0x | 26.0x |
|---|---|---|---|---|---|
| 8% | $165 | $191 | $218 | $244 | $270 |
| 8% | $158 | $184 | $209 | $234 | $259 |
| 10% | $152 | $176 | $200 | $224 | $248 |
| 10% | $146 | $169 | $192 | $215 | $238 |
| 12% | $140 | $162 | $184 | $206 | $228 |
DCF/share — revenue CAGR Δ × op-margin Δ
| CAGRΔ \ MgnΔ | -3.0pp | -1.5pp | +0.0pp | +1.5pp | +3.0pp |
|---|---|---|---|---|---|
| -3.0pp | $148 | $166 | $185 | $204 | $223 |
| -1.5pp | $153 | $173 | $192 | $212 | $232 |
| +0.0pp | $158 | $179 | $200 | $221 | $243 |
| +1.5pp | $163 | $185 | $208 | $231 | $253 |
| +3.0pp | $168 | $192 | $216 | $240 | $264 |
Tornado — DCF/share swing by driver (widest first)
| Driver | Low | High | Swing |
|---|---|---|---|
| Op margin ±3pp | $158 | $243 | $85 |
| Terminal × ±15% | $176 | $224 | $48 |
| Revenue CAGR ±3pp | $185 | $216 | $31 |
| WACC ±1pp | $192 | $209 | $17 |
| FCF conversion ±10% | $200 | $200 | $0 |
Company lever — SoP/share vs AWS multiple (AI re-rating) (base 9x)
| Multiple | 6.3x | 7.6x | 9.0x | 10.3x | 11.7x |
|---|---|---|---|---|---|
| SoP/share | $197 | $214 | $233 | $250 | $269 |
Load-Bearing Assumptions
DCF: WACC 10%, terminal multiple 20×, FY+5 revenue $1,263B. Triangulation leans 35% on DCF, 25% on PWEV.
Reasons the Thesis Could Fail (Falsifiable)
The valuation is multiple-dependent (66% of variance); a de-rating toward the DCF anchor ($200) implies -16%.
Fact / Inference / Speculation
- FACT: Spot $238; 52-week range $140–$260; engine rating HOLD; base-case target $257 (+8%).
- INFERENCE: Triangulated FV $247 (+4%). P/E Multiple explains 66% of Monte Carlo outcome variance — i.e. value is set by the multiple the market will pay, a rate/sentiment regime bet as much as an earnings bet.
- SPECULATION: At current prices the embedded bet is that the multiple holds or expands — P/E Multiple carries 66% of outcome variance.
Recommendation: HOLD
Balanced: triangulated fair value $247 (+4% vs spot); the outcome hinges on P/E Multiple. The debate is P/E Multiple (66% of variance) — fundamentally a multiple/regime call. SBC runs 26000M TTM (disclosed in the appendix).