Rating: HOLD
| Metric | Value |
|---|---|
| Current Price | $357 |
| Triangulated Fair Value | $295 |
| 12-mo Scenario PWEV | $315 |
| Implied Return | -18% |
| Forward P/E | 25.3x |
| Market Cap | $4.36T |
| 52-Week Range | $171 – $408 |
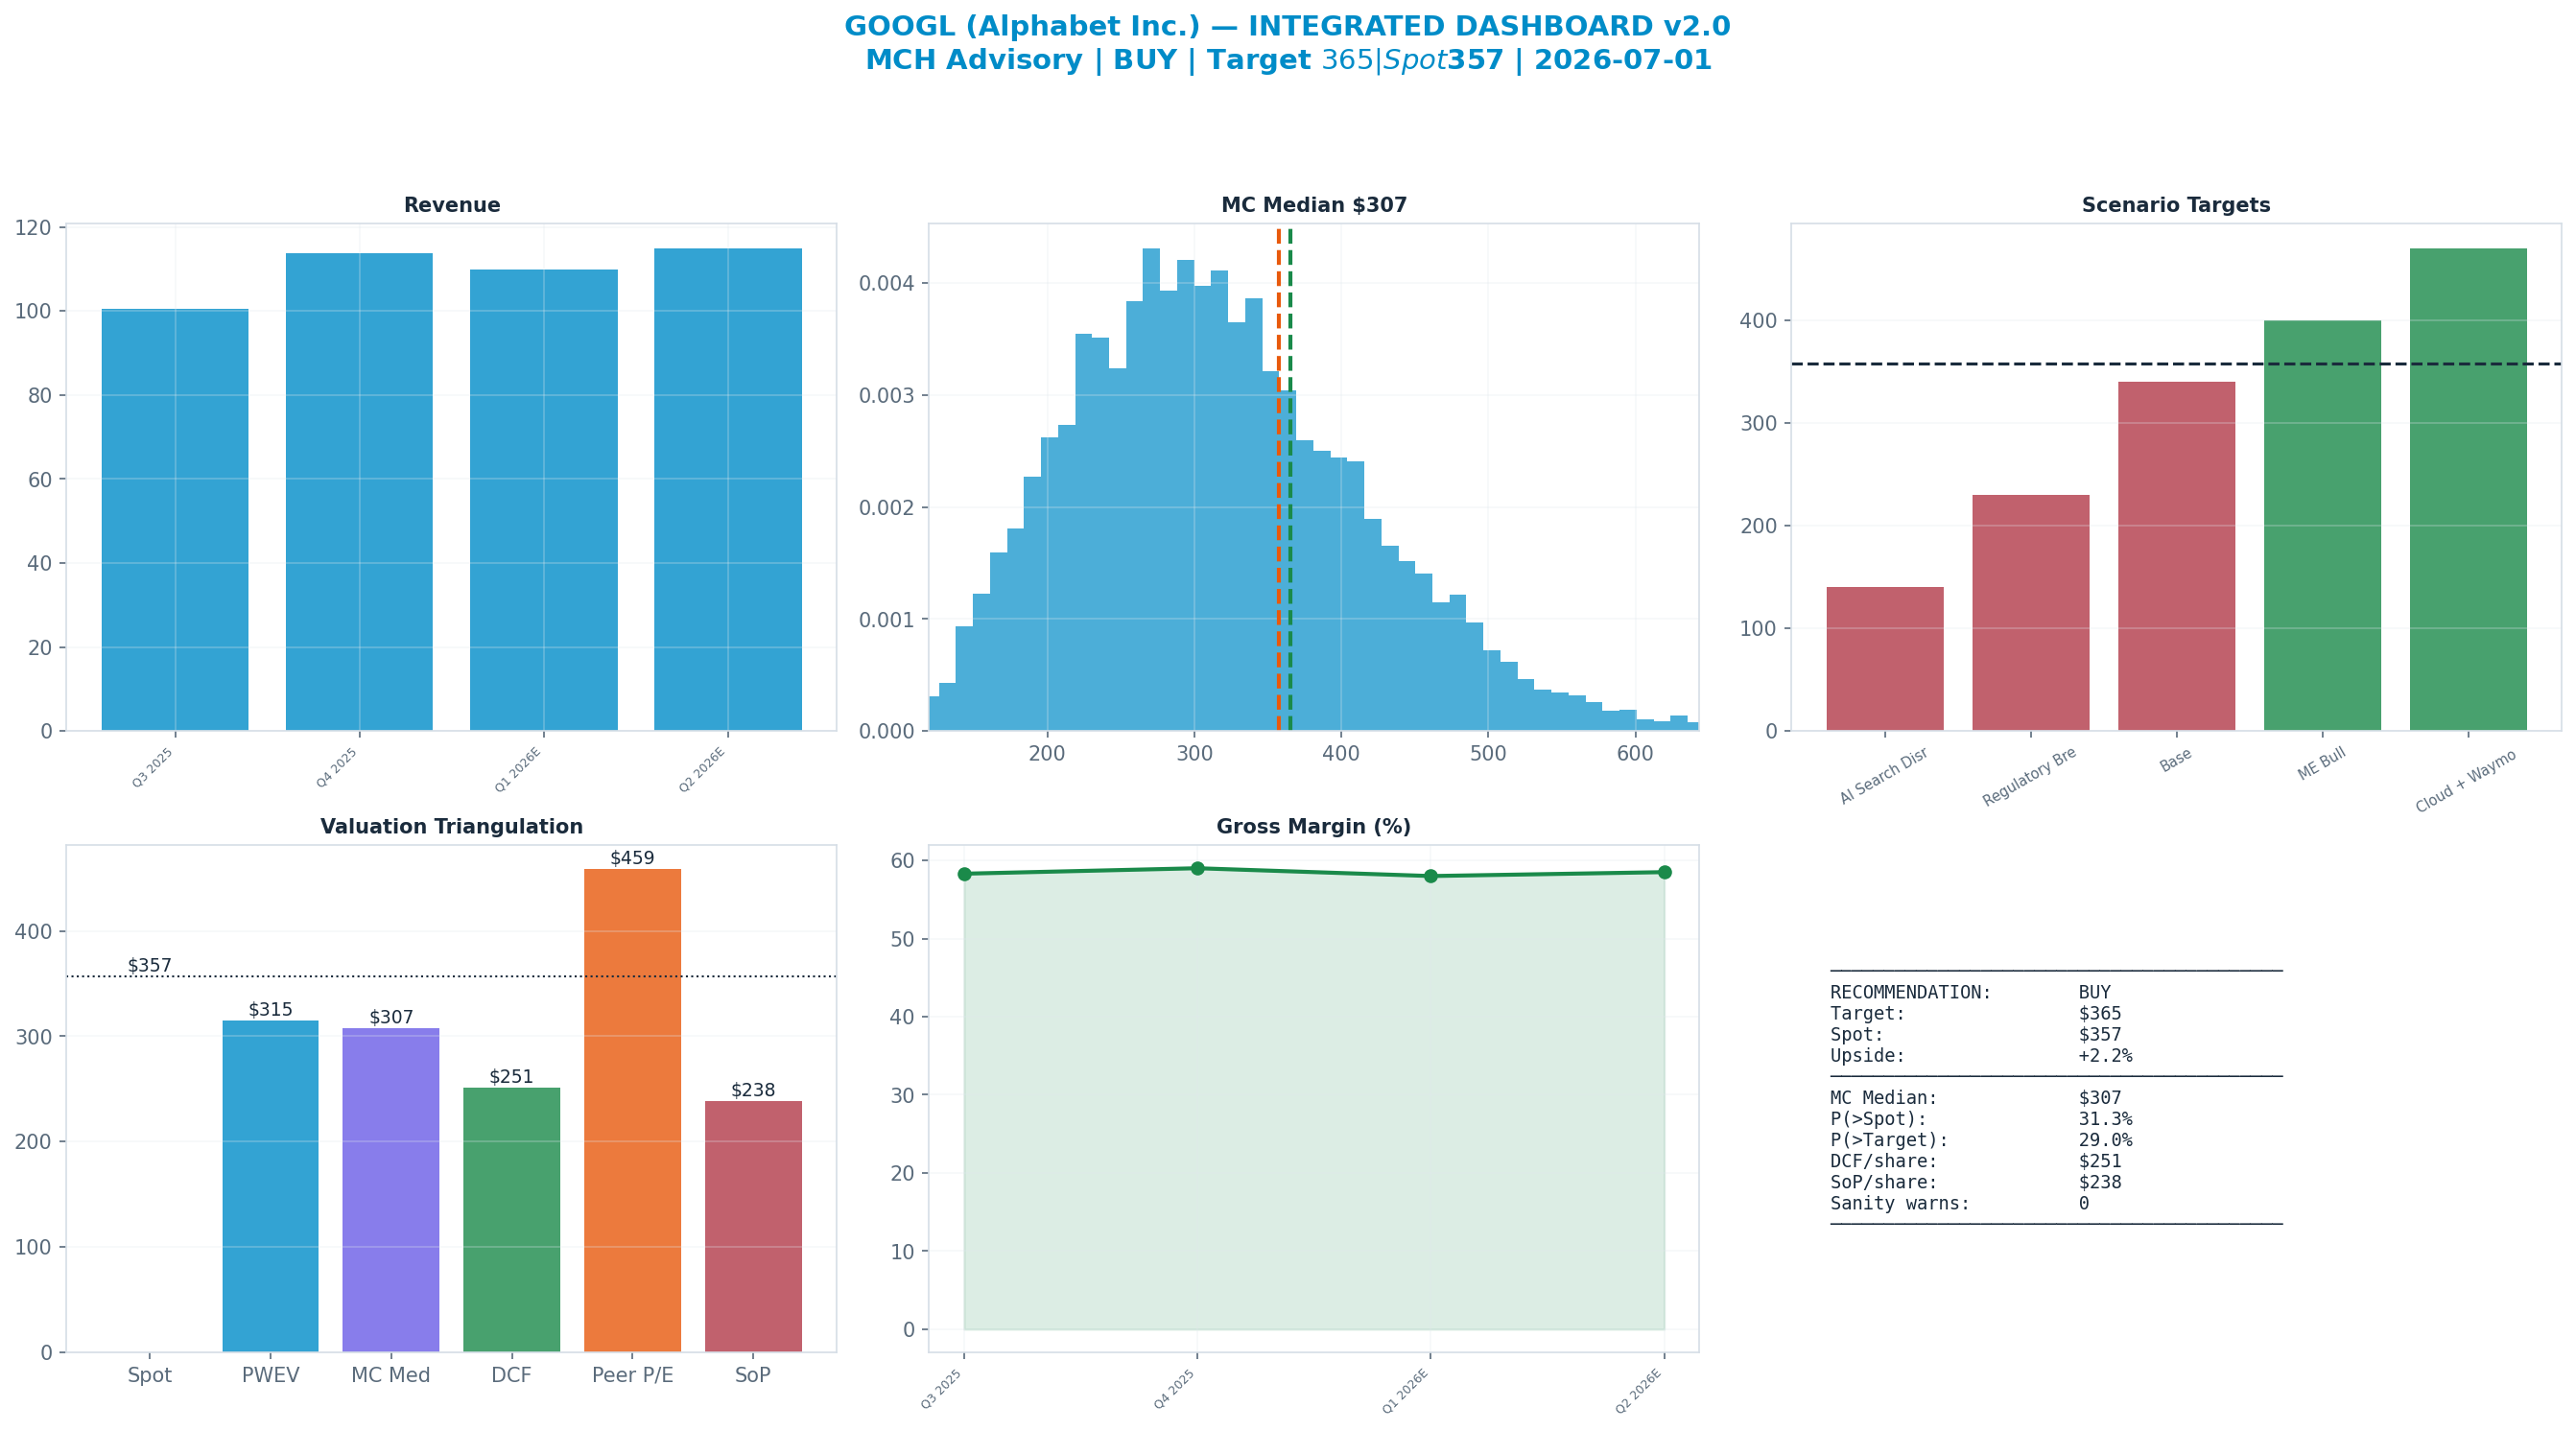
Methodology: Valuation triangulated across five independent anchors — Monte Carlo (Student-t + regime switching), an independent DCF, peer re-rating, a sum-of-parts, and a scenario-weighted PWEV. Figures reconciled to mch_weekly_run live prices. Each chart below sits with the part of the thesis it evidences.
Investment Thesis
The bull case — 'Cloud + Waymo Win' (10% weight) — targets $470, +32% vs spot. It needs the multiple to hold or expand.
The dashboard below is the whole argument on one page: spot ($357) against each valuation anchor, the scenario tree, technicals and the options-implied move.
Anti-Thesis (The Real Bear Case)
The structural case — 'AI Search Disruption' (20%) — targets $140, -61% vs spot. This sits below the 52-week low — a genuine structural impairment, not a mild pullback.
Key Debate
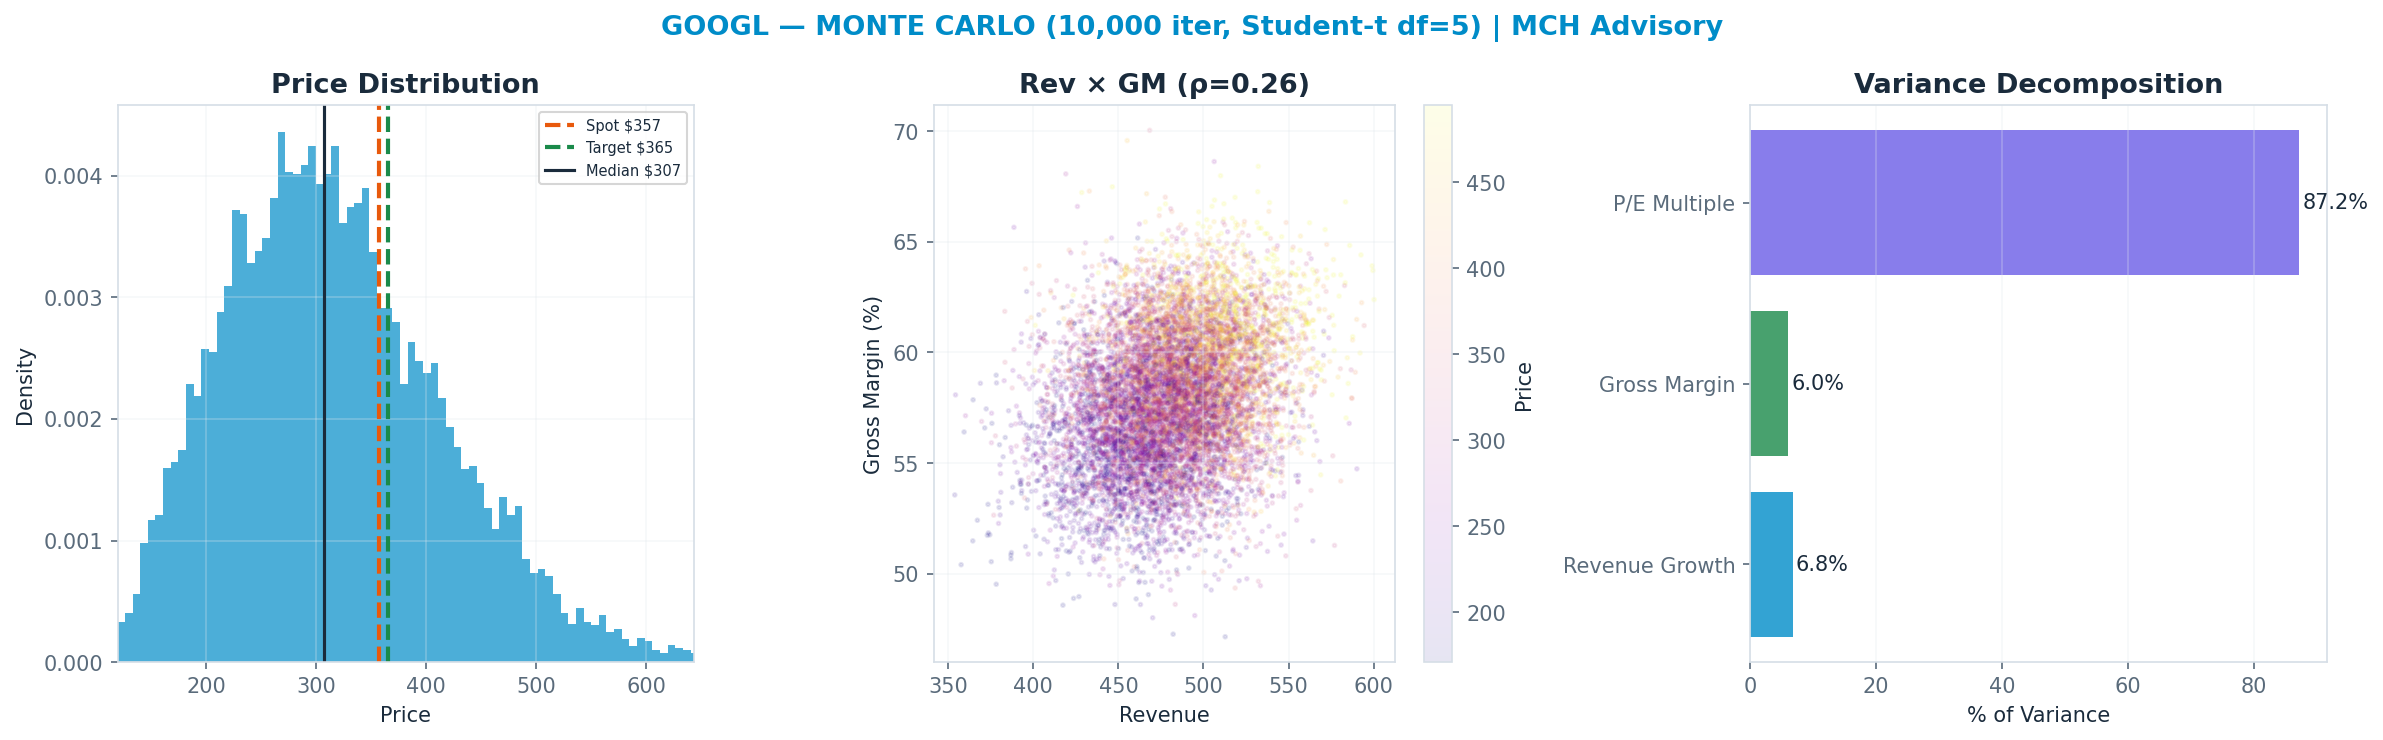
P/E Multiple explains 87% of Monte Carlo outcome variance — i.e. value is set by the multiple the market will pay, a rate/sentiment regime bet as much as an earnings bet.
Earnings-Call Disconfirmation & Sentiment
Derived signals from the MCH market-data store (Alpha Vantage transcripts + news). Quantitative tone only — a disconfirmation flag, not a substitute for reading the call.
Management vs analyst tone (2026Q1): management +0.55 vs analyst floor +0.00 → delta +0.55 (n=19 mgmt / 10 Q&A; 81th pctile across the S&P book, z +0.9).
Flag: TYPICAL — management-vs-analyst tone within the normal cross-sectional range.
| Quarter | Mgmt | Analyst | Delta |
|---|---|---|---|
| 2026Q1 | +0.55 | +0.00 | +0.55 |
| 2025Q4 | +0.49 | +0.33 | +0.16 |
| 2025Q3 | +0.48 | +0.10 | +0.38 |
| 2025Q2 | +0.59 | +0.00 | +0.59 |
News (last 365d, 1000 articles): avg ticker sentiment +0.12 (bullish 7% / bearish 2%)
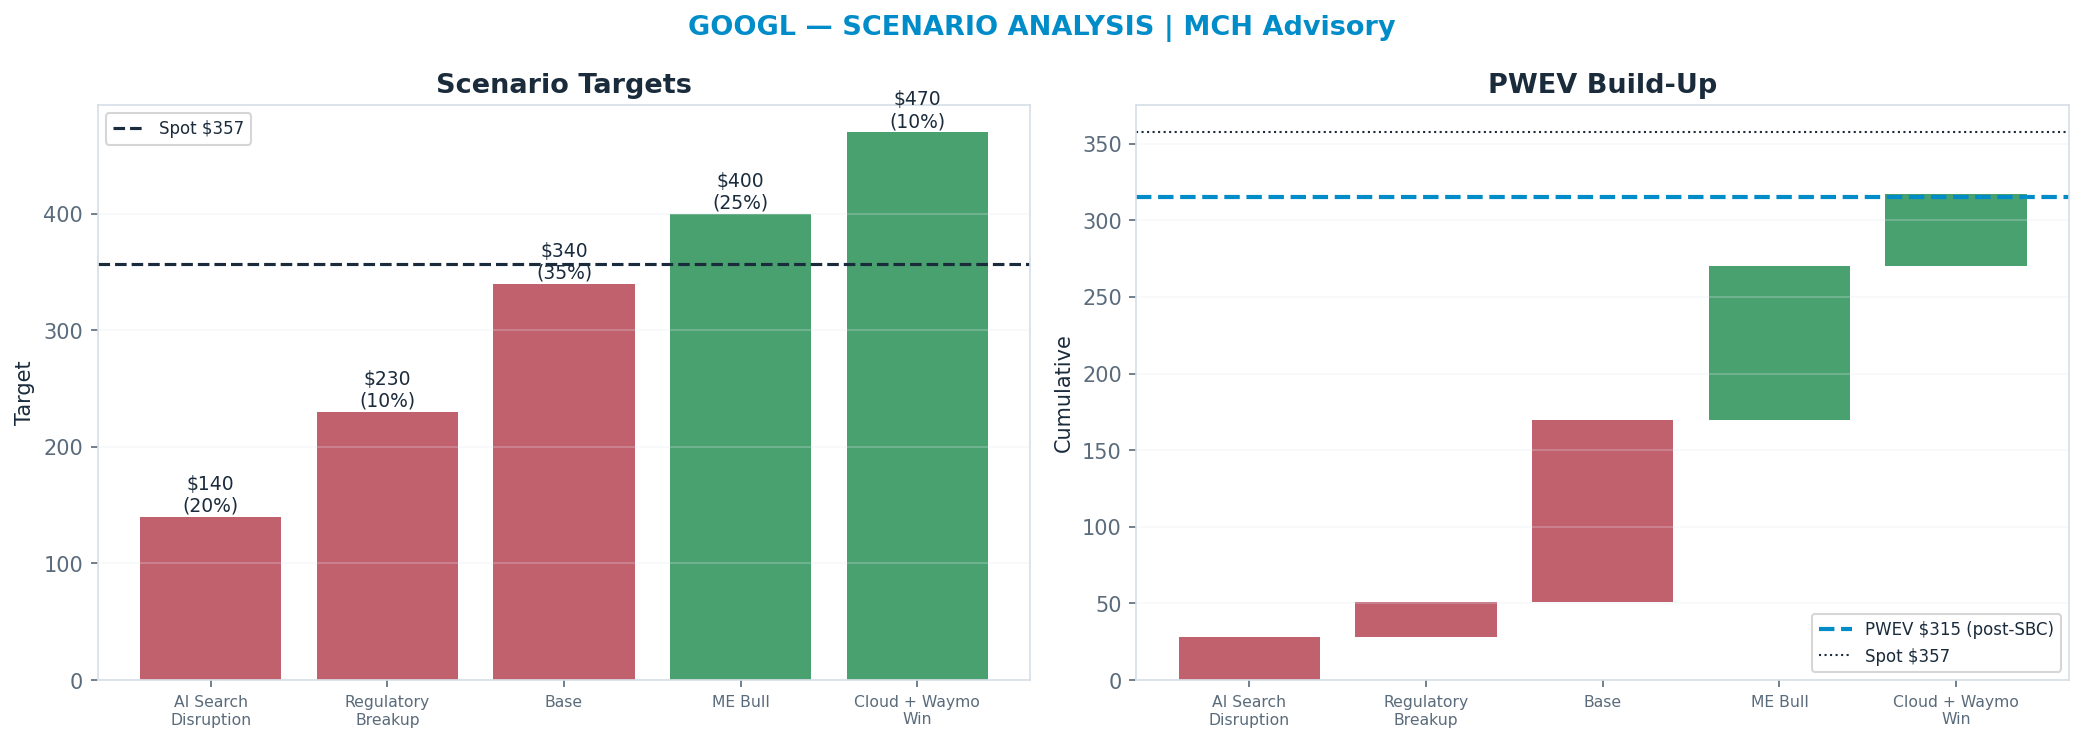
Scenario Analysis
The tree runs from a structural 'AI Search Disruption' downside ($140) to a 'Cloud + Waymo Win' bull case ($470); the probability-weighted blend (PWEV $315) is -12% versus spot.
| Scenario | Probability | Target | Return |
|---|---|---|---|
| AI Search Disruption | 20% | $140 | -61% |
| Regulatory Breakup | 10% | $230 | -36% |
| Base | 35% | $340 | -5% |
| ME Bull | 25% | $400 | +12% |
| Cloud + Waymo Win | 10% | $470 | +32% |
| Probability-Weighted (PWEV, after SBC dilution) | — | $315 | -12% |
SBC charge: scenario targets are gross per-share prices; the PWEV is reduced by one year of stock-based-compensation dilution (0.5% of shares, on SBC ≈ 6% of revenue), trimming the gross PWEV of $317 to $315 (-0.5%). SBC is charged once, as dilution — never also deducted from FCF.
Scenario rationale — what each probability buys (the driver path behind every target):
- AI Search Disruption (20%, $140). Generative assistants (ChatGPT, Perplexity, Gemini chat itself) capture informational and commercial query share; AI Overviews lower monetization per query faster than new ad formats backfill. Search ad growth stalls to low-single-digits, Services margin compresses on AI-serving cost, and the multiple de-rates to ~13x as the core franchise looks structurally impaired. Target sits below the 52-week low — a genuine impairment of the cash engine, not a pullback. Drivers — search_growth: ~2%; services_op_margin: ~35%; cloud_growth: ~28%; multiple: ~13x.
- Regulatory Breakup (10%, $230). Adverse remedies force loss of search default-payment deals and/or divestiture of Chrome or the ad-tech stack; distribution moat weakens and a piece of high-margin revenue is severed or impaired. Near-term EPS and the consolidated multiple both compress on uncertainty and lost operating leverage; multiple ~14x. Forced separation could surface sum-of-parts value over time, but the transition is value-destructive in the modeled window. Drivers — revenue_growth: ~8%; op_margin: ~32%; multiple: ~14x.
- Base (35%, $340). Search grows high-single to low-double digits as AI Overviews monetize roughly in line with legacy queries; Cloud compounds ~28-30% with margins drifting toward the low-20s; capex stays heavy but ROIC holds. The multiple normalizes toward ~18x on proven AI defense of Search plus a credible Cloud margin path. Drivers — search_growth: ~10%; cloud_growth: ~30%; cloud_op_margin: ~20%; multiple: ~18x.
- ME Bull (25%, $400). AI Overviews and new ad formats lift Search monetization above the legacy baseline, Cloud sustains ~30%+ with operating leverage expanding margins toward the mid-20s, and TPU cost advantage widens AI-serving margins versus GPU-bound peers. Operating leverage and durable growth re-rate the multiple to ~22x. Drivers — search_growth: ~13%; cloud_growth: ~33%; cloud_op_margin: ~24%; multiple: ~22x.
- Cloud + Waymo Win (10%, $470). Google Cloud inflects as the default enterprise AI platform (Vertex/Gemini share gains) with margins approaching hyperscaler peers, and Waymo scales from optionality to a credible, separately-valued autonomy franchise. The sum-of-parts (Cloud at a premium AI multiple + Waymo option crystallizing) drives a consolidated re-rate to ~25x. Drivers — cloud_growth: >35%; cloud_op_margin: ~27%; waymo: scales to material value; multiple: ~25x.
Valuation Triangulation
Five anchors — but read them with their basis in mind. The Monte Carlo, the DCF terminal, and the peer re-rate all key off a market multiple, so they are not fully independent; only the discounted cash flows themselves are genuinely multiple-free. The discipline is to read the spread and weight the cash-based view, not to treat five numbers as five independent votes.
| Method | Basis | Fair Value | vs Spot |
|---|---|---|---|
| Monte Carlo median (Student-t + regime) | multiple | $307 | -14% |
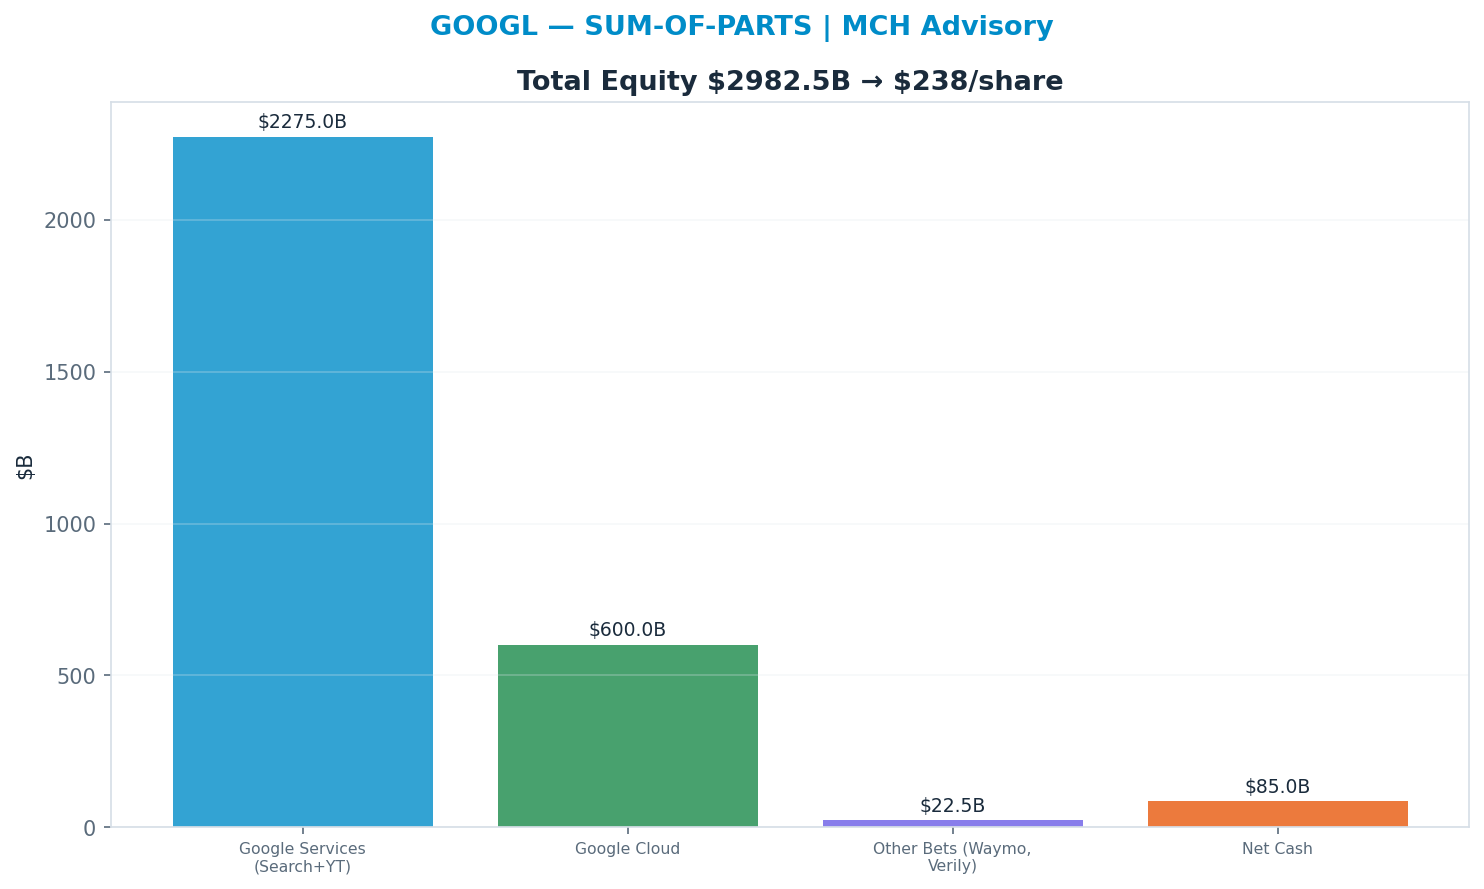
| Sum-of-Parts | multiple | $238 | -33% |
| Peer P/E re-rate | multiple | $459 | +28% |
| Peer EV/Revenue re-rate | multiple | $370 | +4% |
| Scenario PWEV | multiple | $315 | -12% |
| DCF (5-year + terminal) | cash flow + terminal × | $251 | -30% |
| Triangulated (weighted) | — | $295 | -18% |
Rating vs blend — the key debate. The rating tracks the multiple-discipline fair value (Monte Carlo $307 + scenario PWEV $315, ≈ spot); the weighted blend $295 (-18%) sits below it because the cash-flow DCF ($251) is materially more conservative than the market multiple. Whether the current multiple is justified is the central question for this name — and the principal downside risk to the rating.
Monte Carlo — the distribution, not a point
10,000 paths, Student-t shocks (fat tails) with a regime-switching overlay. The median lands at $307 and 31% of paths finish above spot. The variance decomposition shows the p/e multiple is the dominant swing factor (87% of variance). Value is a multiple bet: fundamentals move the answer far less than the rating does.
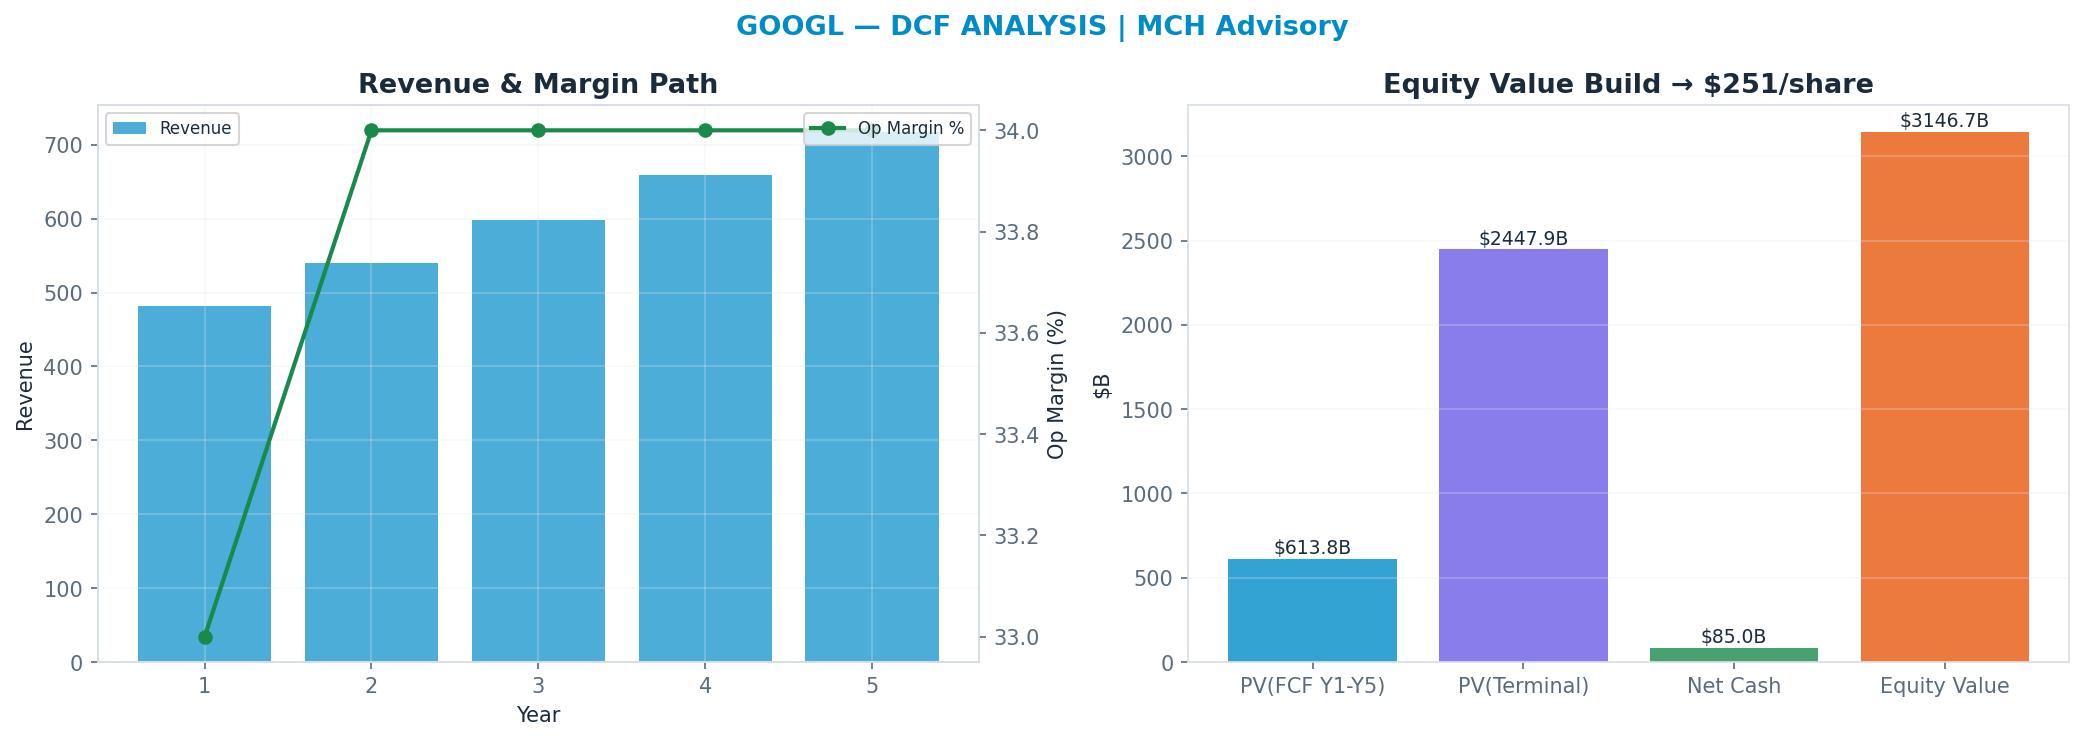
DCF — the cash-flow anchor
Independent of the market multiple: a 5-year path, WACC 9.0%, 20x terminal FCF multiple → $251. This anchor is deliberately the heaviest (35%): it is the valuation least hostage to the current multiple regime.
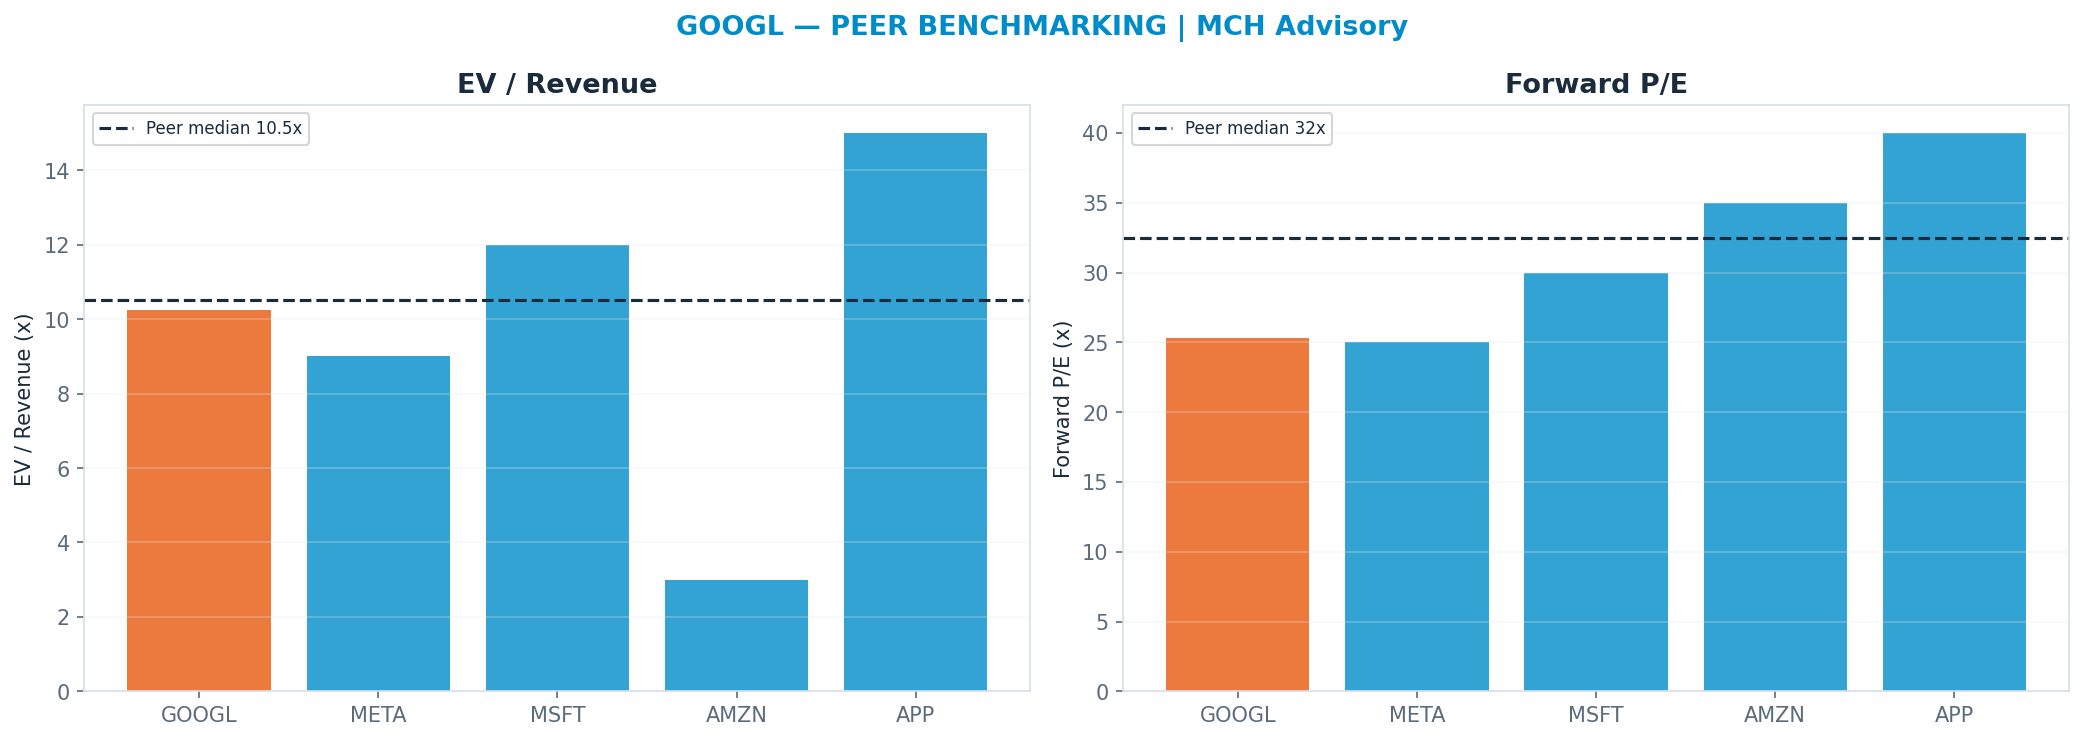
Peer benchmarking — relative value
Against the peer cohort, re-rating to the peer-median forward multiple (P/E 32.5x) implies $459. A premium is only justified by superior growth/margins; otherwise it is multiple risk. Weighted just 10% so the market's mood does not drive the fair value.
Sum-of-parts
Valuing each piece at the multiple it deserves (Google Services (Search+YT) 7x, Google Cloud 12x, Other Bets (Waymo, Verily) 15x) → $238. 'Google Services (Search+YT)' dominates at 7.0× → $2,275B (79% of EV) — the segment whose multiple matters most.
Across all anchors the spread is wide (genuine disagreement — low valuation confidence).
Revenue-Segment Breakdown
The company-specific drivers behind the valuation — each segment carries its own growth, margin, multiple and capex intensity. (Tags: FACT reported · ESTIMATE from disclosures · INFERENCE judgment.)
| Segment | Revenue | Mix | Growth | Op margin | Multiple | Capex % | Tag |
|---|---|---|---|---|---|---|---|
| Google Services | $330B | 85% | 11% | 39% | 16x | 4% | FACT/ESTIMATE |
| Google Cloud | $58B | 15% | 32% | 17% | 22x | 45% | FACT/ESTIMATE |
| Other Bets | $2B | 0% | 20% | -200% | 5x | 50% | FACT/INFERENCE |
AI revenue, decomposed — the AI lines broken out (Azure-AI / Copilot / model-API / pass-through style), so the AI contribution is auditable:
| AI line | Run-rate | Growth | Gross margin | Capex % | Tag |
|---|---|---|---|---|---|
| Google Cloud AI / Vertex | $16B | 50% | 45% | 45% | ESTIMATE |
| Gemini in Search (AI Overviews) | $0B | 0% | 55% | 30% | INFERENCE |
| Workspace Gemini seats | $4B | 40% | 70% | 5% | ESTIMATE |
| DeepMind / TPU cost advantage | $0B | 0% | 0% | 40% | INFERENCE |
- Google Cloud AI / Vertex: Vertex AI + Gemini model/API consumption + AI-infra; SUBSET of Google Cloud revenue, not additive to the segment line
- Gemini in Search (AI Overviews): AI Overviews monetize WITHIN existing Search ad revenue — both a monetization risk (lower query monetization) and opportunity (new ad formats). Not a separable revenue line; shown for transparency, NOT additive
- Workspace Gemini seats: Gemini add-ons / seat uplift on the Workspace base; SUBSET of Google Cloud (Workspace), not additive
- DeepMind / TPU cost advantage: In-house TPU + DeepMind is a COST/CAPABILITY advantage, not a direct revenue line — lowers AI-infra unit cost vs GPU-dependent peers. Tagged INFERENCE, NOT additive to revenue
Named Exposures
AI Search disruption (ESTIMATE/INFERENCE)
| Dimension | Assessment |
|---|---|
| Search revenue share | Search & other advertising is ~55-60% of total revenue (est.); Google Services ~83% — the cash engine is concentrated in Search |
| Query-shift risk | Generative answers (AI Overviews, chat) compress clicks and may lower monetization per query if commercial intent migrates to answer formats |
| Monetization offset | New AI-format ad units and higher engagement could offset; net monetization effect unproven and the core debate |
| Substitution | ChatGPT, Perplexity and other assistants take share of informational queries; Google retains distribution (Chrome, Android, default deals) but those defaults face antitrust pressure |
| Default-deal risk | Apple/Safari and other traffic-acquisition default payments (~$20B+/yr est.) are an antitrust remedy target — loss would dent Search reach and economics |
Antitrust / regulatory (FACT/INFERENCE)
| Dimension | Assessment |
|---|---|
| Search monopoly ruling | US v. Google (Search) — liability found; remedies phase covers default-payment restrictions and potential data/Chrome remedies |
| Ad-tech case | Separate US ad-tech monopolization finding; remedies could force divestiture of parts of the ad-exchange / publisher-ad-server stack |
| Breakup risk | Structural remedies (Chrome divestiture, ad-tech separation) are on the table; probability contested but non-trivial |
| EU / global | DMA gatekeeper obligations + EU ad-tech and Android cases add ongoing fine and conduct risk |
| Revenue at risk | Ad-tech (Network) is a smaller, lower-growth slice; the larger economic risk is Search default-deal and data remedies that weaken the distribution moat |
Industry Context — AI Compute Stack
This name sits in the AI Compute Stack as a buyer (hyperscaler). Self-funds TPUs (lower NVDA dependence); capex pressures FCF but Cloud AI + search defense are the payoff. Its scenarios are not guessed in isolation — they inherit a single, shared view of the cluster's driver cycle, so the names that depend on the same event are mutually consistent.
Value chain: MSFT (buyer (hyperscaler)) · GOOGL (buyer (hyperscaler)) · AMZN (buyer (hyperscaler)) · META (buyer (hyperscaler)) · NVDA (supplier — AI accelerators) · LRCX (supplier — wafer-fab equipment) · MU (supplier — HBM / memory)
| Shared state | Capex path | House view | This name implies |
|---|---|---|---|
| AI Capex Bust | FY27 aggregate −30%+ (to ~$350B) | 22% | — |
| Digestion | FY27 flat / plateau (~$430-460B) | 20% | — |
| Sustained Build | FY27 +15-20% (to ~$500B) | 38% | — |
| Supercycle | FY27 +30%+ (to ~$600B+) | 20% | — |
Structure: Concentration — Demand: 4 hyperscalers ≈ 60-70% of AI capex. Supply: NVDA dominates accelerators; TSMC is the single leading-edge fab; 3 HBM makers. (FACT/ESTIMATE) Barriers — CUDA software lock-in, HBM/CoWoS packaging supply, leading-edge fab access, networking (NVLink). (FACT) Pricing Power — Sits with NVDA today (~75% gross margin); erodes if custom ASICs (Google TPU, AWS Trainium, Meta MTIA) and AMD take share, or inference shifts to cheaper compute. (INFERENCE) Substitution Risk — Custom silicon, model-efficiency gains (DeepSeek-style $/token collapse), inference-vs-training mix shift, and the circular vendor-financing of neoclouds/OpenAI. (INFERENCE)
Model Appendix
DCF — line items
| Year | Revenue | Op income | − Capex | + D&A | FCF | PV(FCF) |
|---|---|---|---|---|---|---|
| FY+1 | $482B | $159B | $50B | $50B | $132B | $121B |
| FY+2 | $539B | $183B | $56B | $51B | $147B | $124B |
| FY+3 | $599B | $204B | $62B | $53B | $160B | $123B |
| FY+4 | $659B | $224B | $68B | $56B | $174B | $123B |
| FY+5 | $718B | $244B | $74B | $60B | $188B | $122B |
| Terminal | — | — | — | — | $188B × 20x | $2448B |
FCF is bridged: NOPAT + D&A − Capex − ΔNWC (capex intensity 10% of revenue, weighted from the segments) — not a single conversion fudge.
WACC 9.0% · Σ PV(FCF) $614B + PV(terminal) $2448B = EV $3062B; + net cash → equity $3147B ÷ diluted shares 12.52B = $251/share (exit-multiple terminal).
- Gordon (perpetuity-growth) terminal at 2.5% → $210/share — a genuinely non-multiple, cash-based cross-check; the exit-multiple and Gordon values bracket the terminal-value risk.
- Incremental ROIC on the forecast capex ≈ 23% vs WACC 9% → above WACC — the build is value-creative.
Peer set
| Peer | EV/Rev | Fwd P/E | Growth | Op margin |
|---|---|---|---|---|
| META | 9.0x | 25x | 20% | 42% |
| MSFT | 12.0x | 30x | 16% | 45% |
| AMZN | 3.0x | 35x | 13% | 11% |
| APP | 15.0x | 40x | 35% | 40% |
| Median | 10.5x | 32.5x | — | — |
Peer-median fwd P/E → $459; EV/Rev → $370.
Weighted fair-value math
| Anchor | Value | Weight | Contribution |
|---|---|---|---|
| DCF | $251 | 35% | $88 |
| Scenario PWEV | $315 | 25% | $79 |
| Monte Carlo median | $307 | 15% | $46 |
| Sum-of-parts | $238 | 15% | $36 |
| Peer P/E | $459 | 10% | $46 |
| Triangulated | — | 100% | $295 |
Sensitivity
DCF/share — WACC × terminal multiple
| WACC \ Term× | 14.0x | 17.0x | 20.0x | 23.0x | 26.0x |
|---|---|---|---|---|---|
| 7% | $209 | $241 | $273 | $305 | $337 |
| 8% | $200 | $231 | $262 | $293 | $323 |
| 9% | $193 | $222 | $251 | $281 | $310 |
| 10% | $185 | $213 | $241 | $269 | $297 |
| 11% | $178 | $205 | $232 | $259 | $285 |
DCF/share — revenue CAGR Δ × op-margin Δ
| CAGRΔ \ MgnΔ | -3.0pp | -1.5pp | +0.0pp | +1.5pp | +3.0pp |
|---|---|---|---|---|---|
| -3.0pp | $206 | $216 | $226 | $237 | $247 |
| -1.5pp | $217 | $228 | $239 | $249 | $260 |
| +0.0pp | $228 | $240 | $251 | $263 | $274 |
| +1.5pp | $240 | $252 | $265 | $277 | $289 |
| +3.0pp | $253 | $266 | $279 | $292 | $305 |
Tornado — DCF/share swing by driver (widest first)
| Driver | Low | High | Swing |
|---|---|---|---|
| Terminal × ±15% | $222 | $281 | $59 |
| Revenue CAGR ±3pp | $226 | $279 | $52 |
| Op margin ±3pp | $228 | $274 | $46 |
| WACC ±1pp | $241 | $262 | $21 |
| FCF conversion ±10% | $251 | $251 | $0 |
Company lever — SoP/share vs Other Bets multiple (AI re-rating) (base 5x)
| Multiple | 3.5x | 4.2x | 5.0x | 5.8x | 6.5x |
|---|---|---|---|---|---|
| SoP/share | $544 | $544 | $545 | $545 | $545 |
Load-Bearing Assumptions
DCF: WACC 9%, terminal multiple 20×, FY+5 revenue $718B. Triangulation leans 35% on DCF, 25% on PWEV.
Reasons the Thesis Could Fail (Falsifiable)
The valuation is multiple-dependent (87% of variance); a de-rating toward the DCF anchor ($251) implies -30%.
Fact / Inference / Speculation
- FACT: Spot $357; 52-week range $171–$408; engine rating HOLD; base-case target $365 (+2%).
- INFERENCE: Triangulated FV $295 (-18%). P/E Multiple explains 87% of Monte Carlo outcome variance — i.e. value is set by the multiple the market will pay, a rate/sentiment regime bet as much as an earnings bet.
- SPECULATION: At current prices the embedded bet is that the multiple holds or expands — P/E Multiple carries 87% of outcome variance.
Recommendation: HOLD
Balanced: triangulated fair value $295 (-18% vs spot); the outcome hinges on P/E Multiple. The debate is P/E Multiple (87% of variance) — fundamentally a multiple/regime call. SBC runs 24000M TTM (disclosed in the appendix).