Investment Committee Summary
| Rating | SELL |
| Internal 5-tier | SELL |
| Classification · conviction | cyclical compounder · high |
| Evidence | 8/8 load-bearing inputs sourced |
| Triangulated fair value | $295 (-17% vs spot · triangulated FV) |
| 12-mo scenario PWEV | $279 (-22% vs spot · 12m PWEV) |
| Next catalyst | 2026-10-31 — AI-product / payments-monetization launch and attach |
| Primary thesis-break | Organic recurring-revenue (subscriptions) growth, y/y < 0.065 (2 consecutive prints) |
Decision detail — rating tables & Research OS strip
Rating: SELL
Internal 5-tier: SELL · cyclical compounder · analyst conviction: high
| Metric | Value |
|---|---|
| Current Price | $356 |
| Triangulated Fair Value | $295 (-17% vs spot · triangulated FV) |
| 12-mo Scenario PWEV | $279 (-22% vs spot · 12m PWEV) |
| Forward P/E | 26.9x |
| Market Cap | $14B |
| 52-Week Range | $271–$621 |
EPS basis for the forward P/E and all scenario multiples: consensus forward EPS (broker-adjusted, non-GAAP).
Methodology: Valuation triangulated across three weighted anchors — an intrinsic DCF, a scenario-weighted PWEV and a Monte Carlo median (Student-t + regime switching). Anchors that share a market multiple are not independent evidence and are weighted as one view. Figures reconciled to Alpha Vantage 2026-08-24. Each chart below sits with the part of the thesis it evidences.
General research for a skeptical institutional reader. Not personalised investment advice; no position sizing or trade instructions. Figures as of the analysis date; verify before acting.
Decision Support — Research OS jump to detail ↓
| Research conviction | Exp. return (1y) | Rules stance | Preferred options | Next catalyst |
|---|---|---|---|---|
| 66.7/100 (83rd pct) | -22% 1yr expected | Hold | Collar | 67d — AI-product / payments-monetization launch and attach |
Research rating: SELL · Tactical / decision-rule stance: Hold — the stance is the machine decision-rules layer (hysteresis, kill-switches, freshness); the rating is the valuation verdict. They may diverge and are reconciled in the Decision Rules section below.
Full breakdown — conviction components, position sizing, probability-return distribution, decision rules, factor & portfolio interaction, options intelligence and the catalyst timeline — in the Decision Support sections below. Model output for research; not individualised advice.
📎 Download the full model (Excel) — DCF line items, scenarios, sensitivity, assumptions, and extended fundamentals.
Recommendation: SELL
Defensive: rating SELL; triangulated fair value $295 (-17% vs spot) — the risk/reward is skewed to the downside on P/E Multiple. The debate is P/E Multiple — fundamentally a multiple/regime call.
Investment Thesis
At $356 (25 August 2026) and roughly 27x forward earnings, the market prices Tyler as a durable compounder: steady seat and retention growth across a public-sector installed base, an orderly transition to subscription delivery, and no material disruption to the software layer. The engine largely agrees on the cash economics and is more cautious on the price. Its base path carries high-single-digit to low-double-digit revenue growth at an operating margin near 24%, producing a twelve-month base-case target of $291 below the quote, and the probability-weighted value of $279 sits lower still. The independent discounted-cash-flow anchor is the one that clears spot, and only just; blended with the rest it gives a fair value of $295, -17% against spot, which leaves the shares trading rich to our estimate of intrinsic value while the weighted valuation carries the rating to SELL. The peer read is unhelpful here — the software median is inflated by names with quite different margin structures — so this is a judgement about the multiple, not a comparables exercise. The single most damaging risk is multiple compression: the earnings multiple drives most of the modelled dispersion, so a de-rating of the software group would hurt Tyler even if seats and retention hold.
Narrative drafted 2026-08-16 by claude-opus-5 under supervision; reviewed by Marinus 2026-08-16.
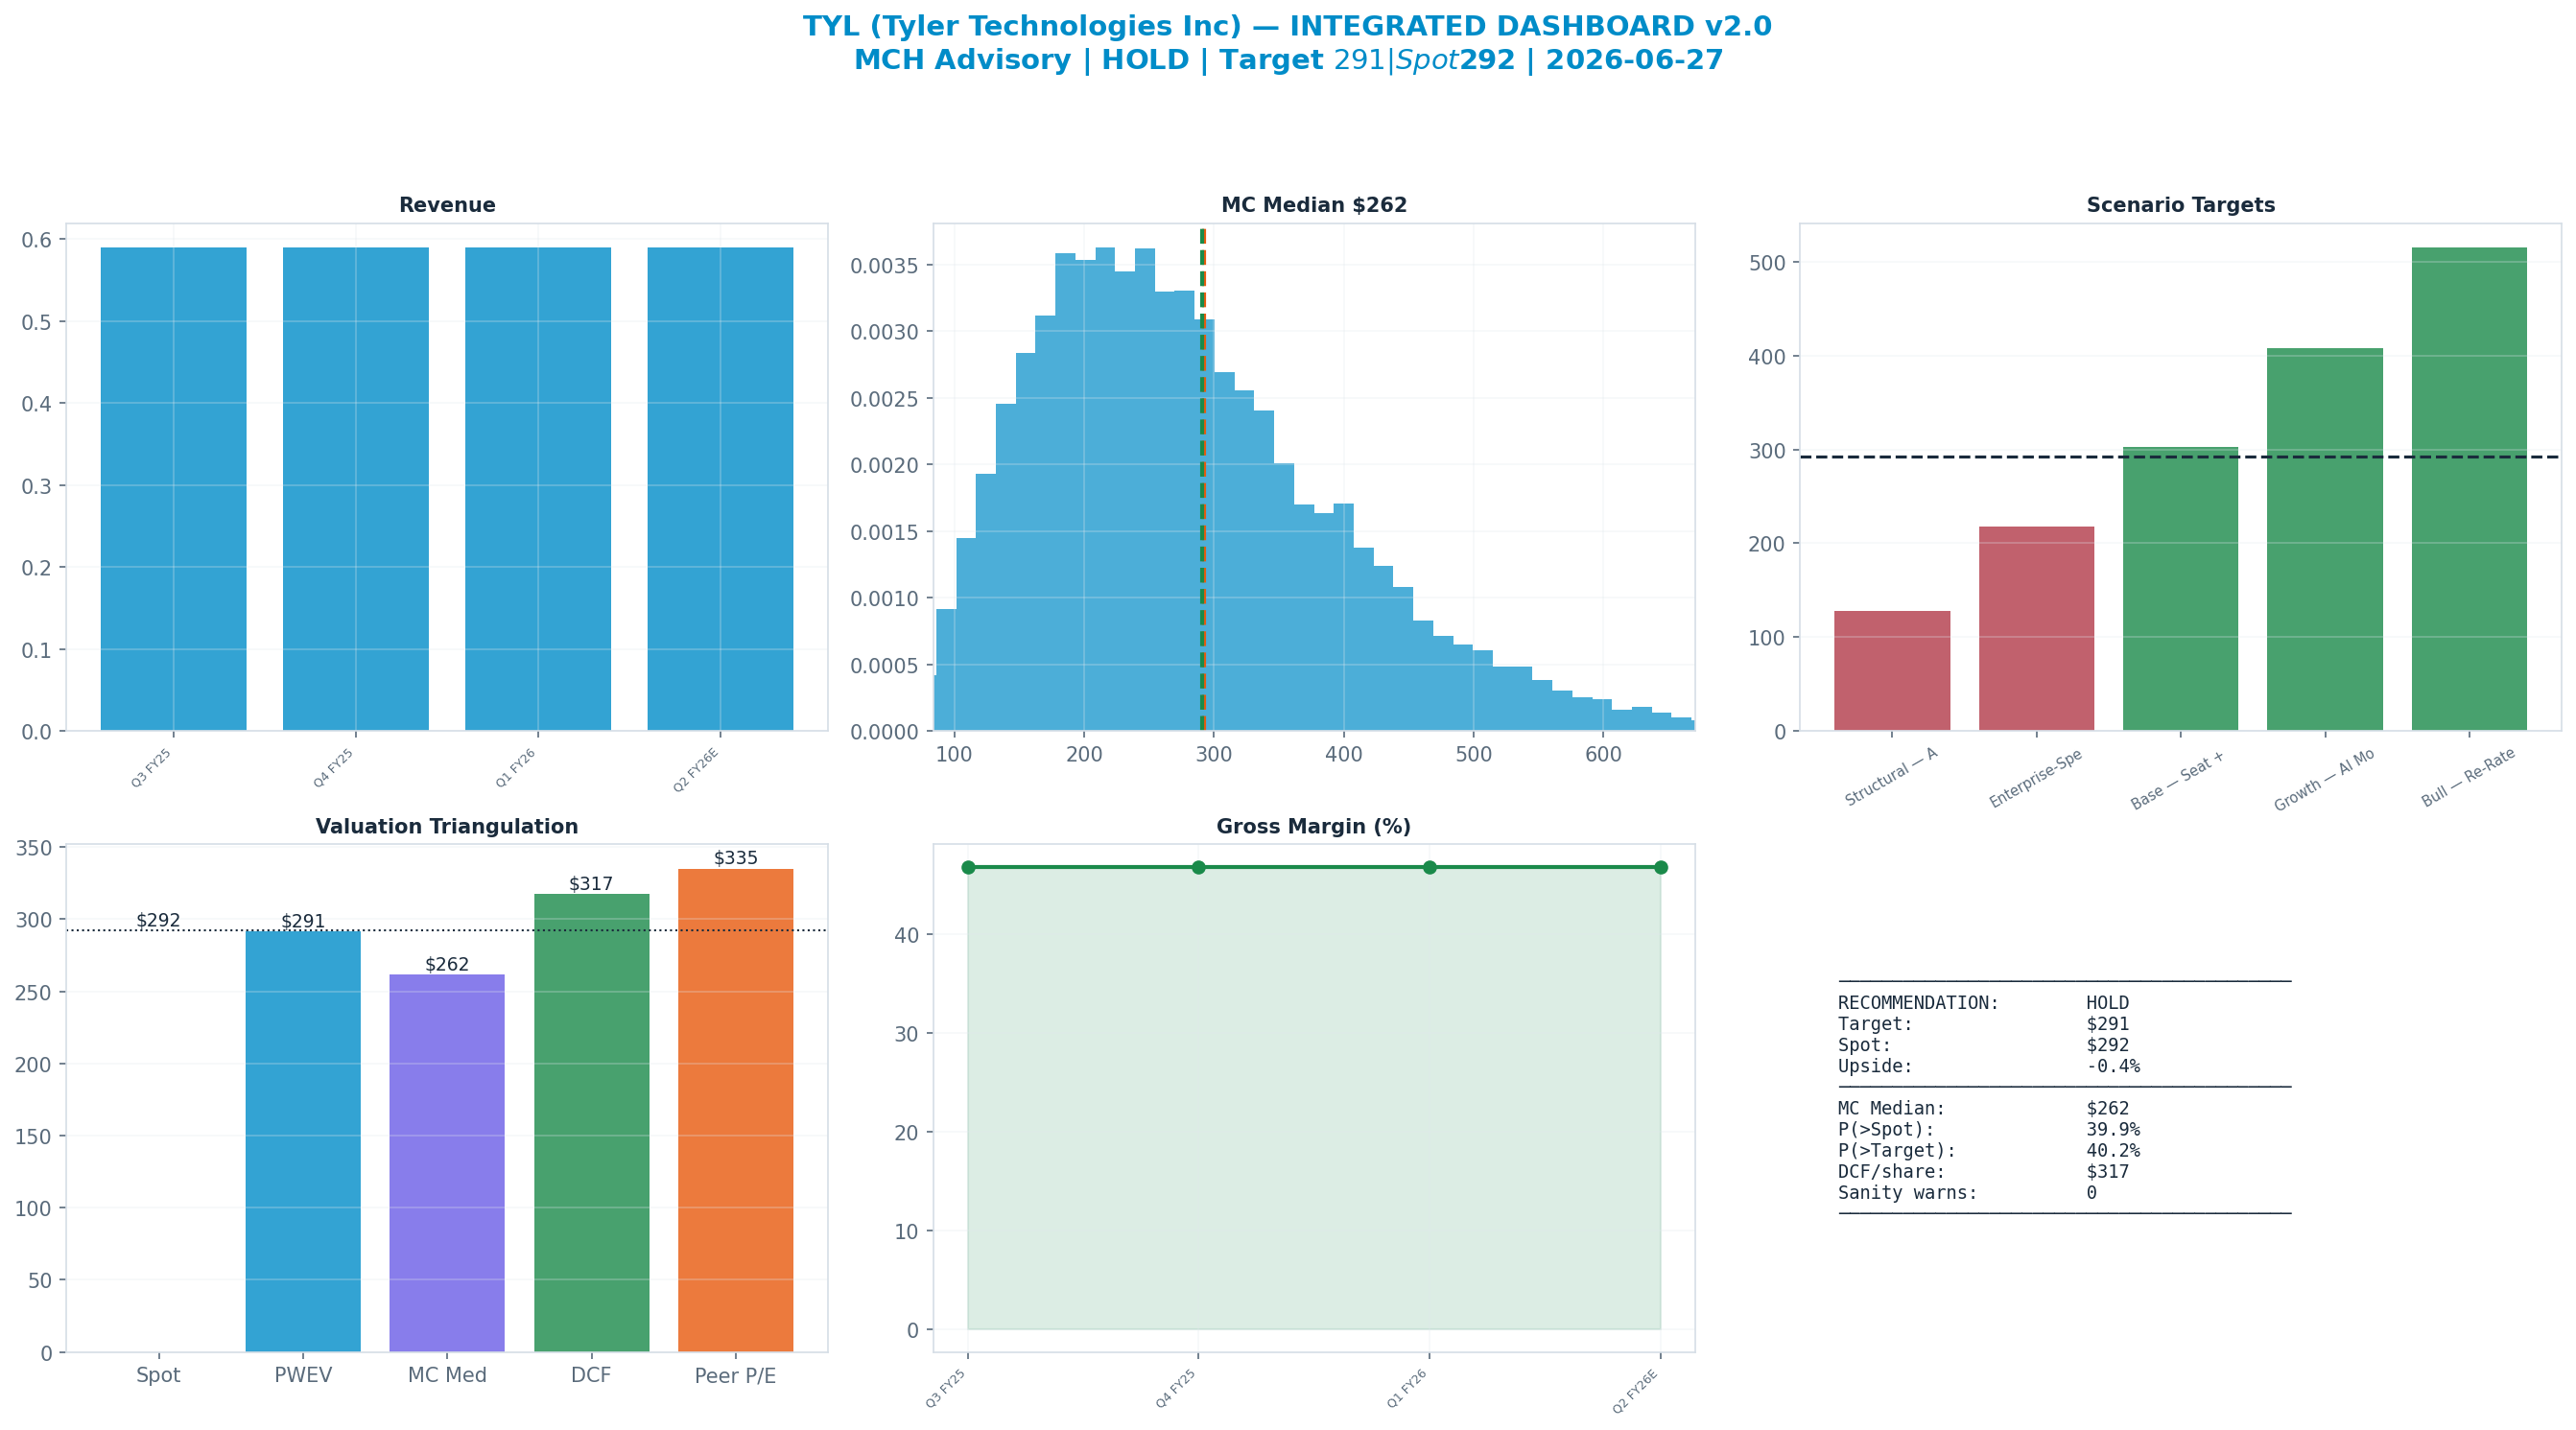
The dashboard below is the whole argument on one page: spot ($356) against each valuation anchor, the scenario tree, technicals and the options-implied move.
Anti-Thesis (The Real Bear Case)
The highest-probability bear is a combined disruption and de-rating state, and the mechanism is not a demand collapse but a slow erosion of pricing power. If AI-assisted tooling lets smaller vendors replicate courts, permitting and payments workflows, the switching-cost moat in local government softens at renewal. Net retention drifts toward flat, growth fades to low single digits, and the operating margin gives back gains from 24% as the company spends to defend the platform. Crucially, the multiple compresses at the same time: a lower exit rating on a lower earnings base drives the structural target below the 52-week low. Public-sector budgets are politically exposed too — a procurement freeze does not care how good the product is. Earnings and rating fall together, which is how quality software names actually break, and net cash of ~$0.3B is too small to change the outcome either way.
Key Debate
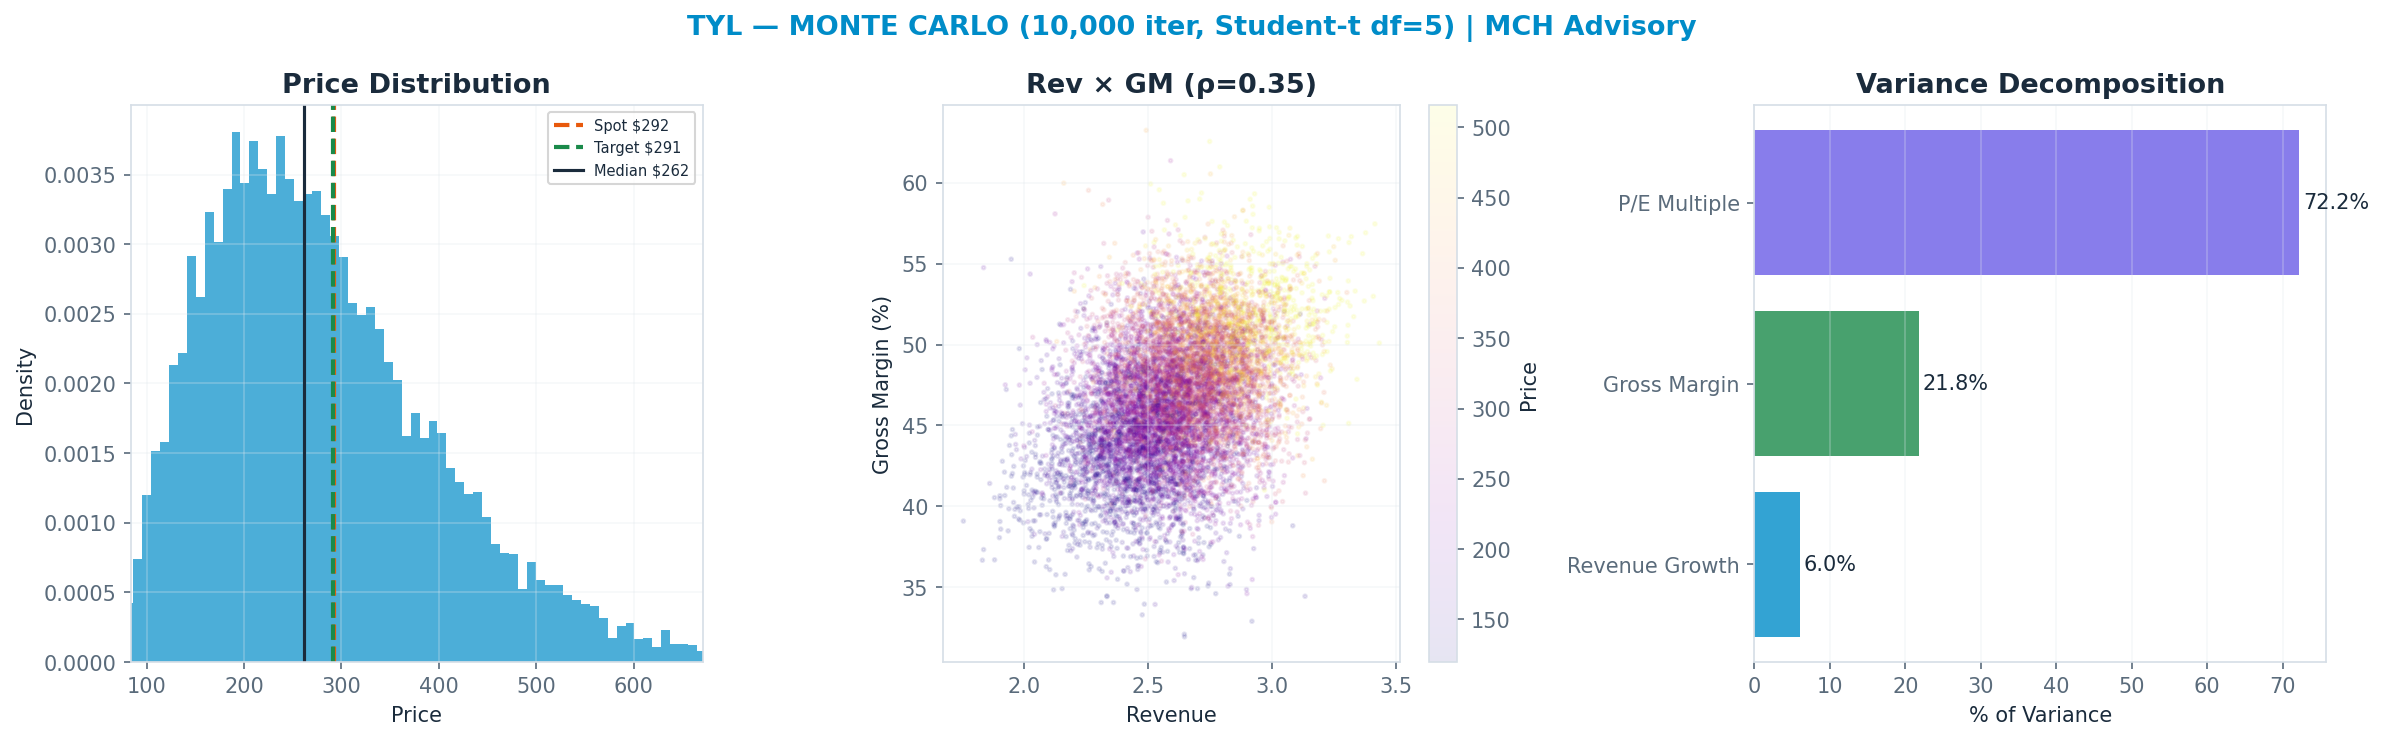
P/E Multiple explains 72% of Monte Carlo outcome variance — i.e. value is set by the multiple the market will pay, a rate/sentiment regime bet as much as an earnings bet.
What the Market Is Pricing In
At the current price, the market pays 27.2× consensus forward EPS, vs the house DCF terminal 19.0×, and a peer median 25.3×. The house DCF sits 10% below spot, so the market is pricing in more than the house case — roughly 1.2pp of revenue CAGR.
Variant perception: the house view is below-consensus, and the thesis is primarily FCF-driven.
| Metric | Consensus | House | Importance |
|---|---|---|---|
| Revenue | 2.5 | 2.6 | High |
| EPS | 13.1 | 13.2 | Medium |
| Target price | 426.6 | 291.3 | Medium |
Scenario Analysis
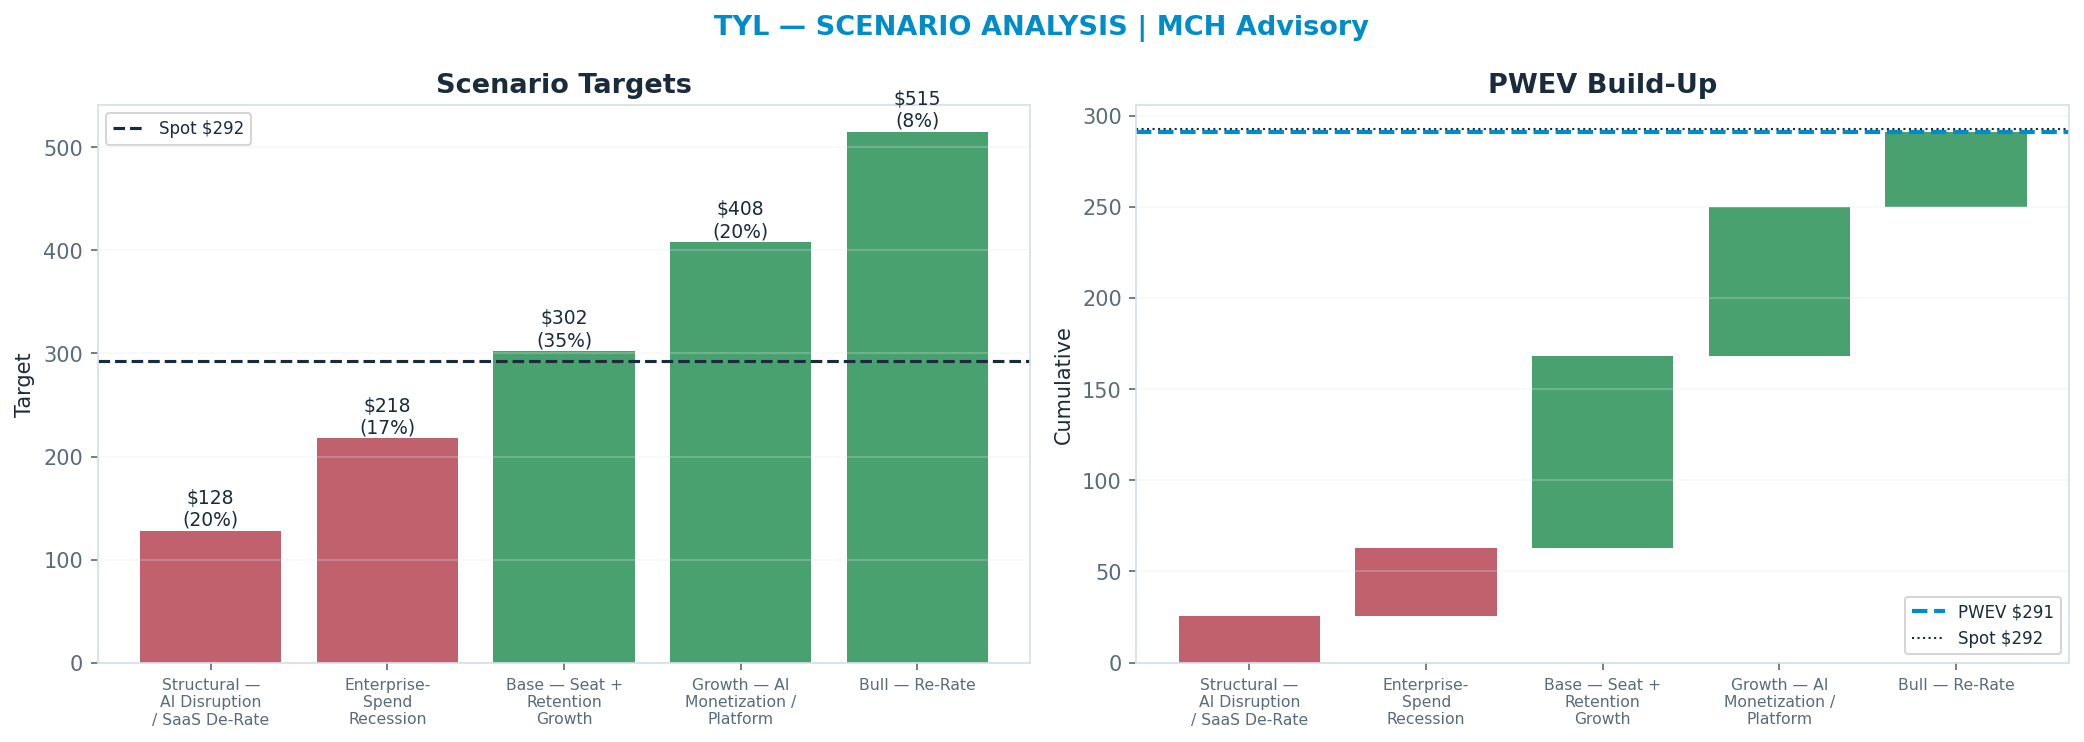
The scenario tree spans a structural 'Structural — AI Disruption / SaaS De-Rate' downside ($128) to a 'Bull — Re-Rate' bull case ($495); the probability-weighted blend (PWEV $279) is -22% versus spot.
| Scenario | Probability | Target | Return vs spot |
|---|---|---|---|
| Structural — AI Disruption / SaaS De-Rate | 20% | $128 | -64% |
| Enterprise-Spend Recession | 17% | $215 | -39% |
| Base — Seat + Retention Growth | 35% | $284 | -20% |
| Growth — AI Monetization / Platform | 20% | $389 | +9% |
| Bull — Re-Rate | 8% | $495 | +39% |
| Probability-Weighted (PWEV) | — | $279 | -22% |
Share-count charge: none applied. The probability-weighted value above is the gross per-share figure — no annual dilution is deducted — stock-based compensation runs at 6.3% of revenue; free cash flow net of SBC is $0.49B. SBC is therefore disclosed, not charged: read the per-share figures as before dilution.
Scenario rationale — the driver path behind every target:
- Structural — AI Disruption / SaaS De-Rate (20%, $128). Structural impairment — AI disruption / SaaS de-rate: earnings AND the multiple compress together. Target sits below the 52-week low by construction.
- Enterprise-Spend Recession (17%, $215). Cyclical downturn — software/SaaS spend + net retention + AI monetization vs AI disruption weakens for 1–2 years before normalising.
- Base — Seat + Retention Growth (35%, $284). Mid-cycle — normalised software/SaaS spend + net retention + AI monetization vs AI disruption; disciplined capital allocation; steady returns.
- Growth — AI Monetization / Platform (20%, $389). Upside — AI monetization + platform expansion lifts earnings above mid-cycle; the multiple expands modestly.
- Bull — Re-Rate (8%, $495). Upside tail — sustained tight conditions or a structural re-rate on AI monetization + platform expansion.
Valuation Triangulation
Three weighted anchors — an intrinsic dcf, a scenario-weighted pwev and a monte carlo median (student-t + regime switching) — read them with their basis in mind. The Monte Carlo, the DCF terminal and any peer re-rate key off a market multiple, so they are not fully independent; only discounted cash flows themselves are genuinely multiple-free. The discipline is to read the spread and weight the cash-based view, not to treat three numbers as three independent votes.
| Method | Basis | Fair Value | vs Spot | Weight in this name's blend |
|---|---|---|---|---|
| Monte Carlo median (Student-t + regime) | multiple | $262 | -26% | 20% (declared 15%) |
| Peer EV/Revenue re-rate | multiple | $611 | +72% | 0% — cross-check only |
| Scenario PWEV | multiple | $279 | -22% | 33% (declared 25%) |
| DCF (5-year + terminal) | cash flow + terminal × | $322 | -10% | 47% (declared 35%) |
| Triangulated (weighted) | — | $295 | -17% | 100% |
The house blend DECLARES five anchor weights — DCF 35%, scenario PWEV 25%, Monte Carlo 15%, sum-of-parts 15%, peer re-rate 10%. For this name sum-of-parts, peer P/E re-rate are not computed, so 25% of the declared weight is redistributed across the anchors that exist — which is why the weights above differ from the declared ones. The fair value is unaffected by this disclosure; the blend has always worked this way.
Peer EV/Revenue re-rate — 0% weight: it duplicates the peer-multiple information already carried by the Peer P/E anchor while ignoring margin mix; weighting both would double-count the peer view. Shown as a cross-check.
Monte Carlo — the outcome distribution
10,000 paths, Student-t shocks (fat tails) with a regime-switching overlay. The median lands at $262 and 24% of paths finish above spot. The variance decomposition shows the p/e multiple is the dominant swing factor (72% of variance). Value is a multiple bet: fundamentals move the answer far less than the rating does.
DCF — the cash-flow anchor
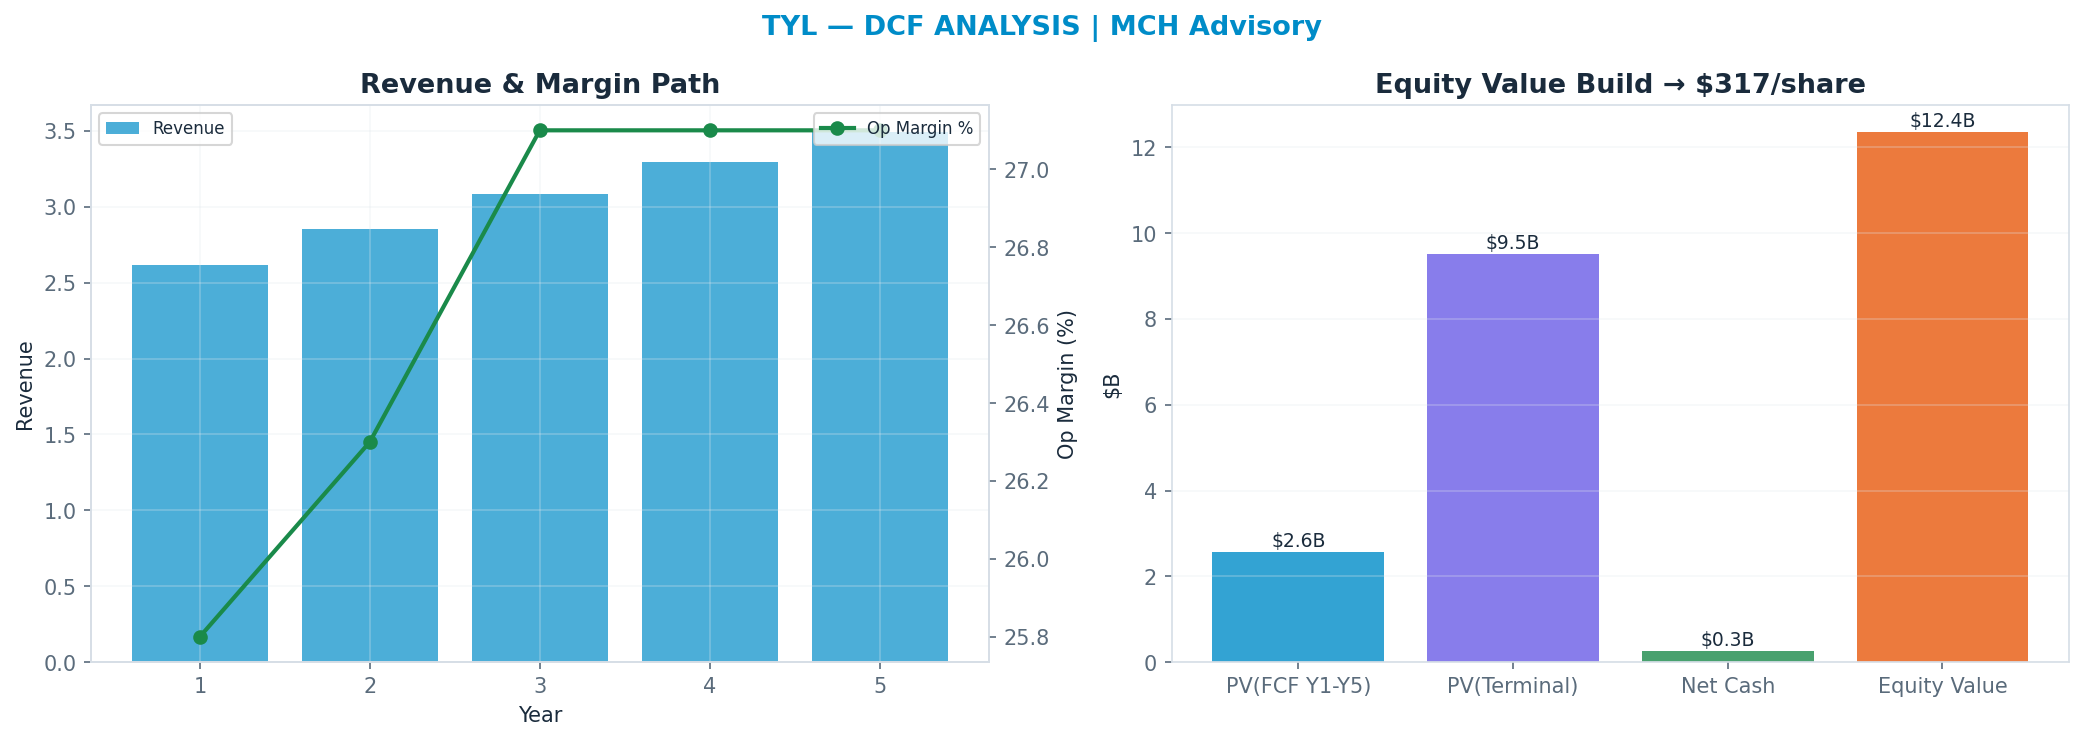
Independent of the market multiple: a 5-year path, WACC 9.0%, 19.0x terminal FCF multiple → $322. This anchor is deliberately the heaviest (47%): it is the valuation least hostage to the current multiple regime.
Peer benchmarking — relative value
Against the peer cohort, re-rating to the peer-median EV/Revenue multiple implies $611; the peer-median forward P/E is 25.3x, but the engine carries no P/E-implied price for this name (no forward-EPS basis at the peer step). A premium is only justified by superior growth/margins; otherwise it is multiple risk. Excluded from the weighted blend — shown only as a market cross-check.
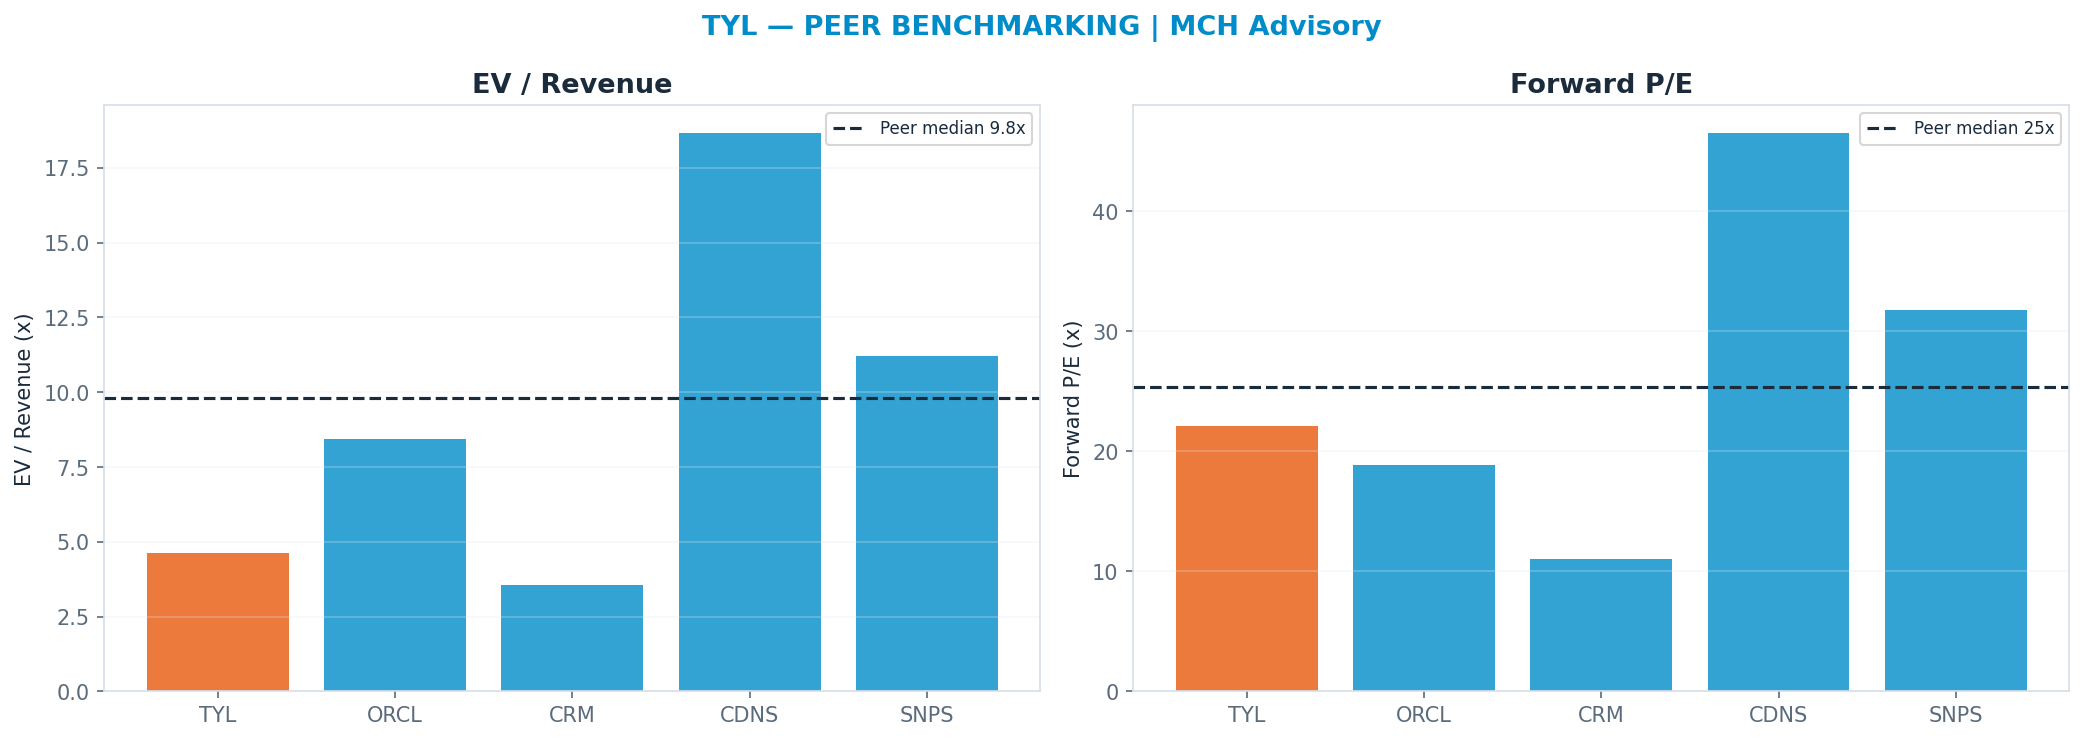
Across all anchors the spread is 109% of the median — wide (genuine disagreement — the blend carries low valuation confidence).
Sensitivity
DCF/share — WACC × terminal multiple
| WACC \ Term× | 13.3x | 16.1x | 19.0x | 21.8x | 24.7x |
|---|---|---|---|---|---|
| 7.0% | $268 | $308 | $350 | $390 | $431 |
| 8.0% | $257 | $296 | $335 | $374 | $413 |
| 9.0% | $247 | $284 | $322 | $358 | $396 |
| 10.0% | $238 | $273 | $309 | $344 | $380 |
| 11.0% | $229 | $262 | $297 | $330 | $365 |
DCF/share — revenue CAGR Δ × op-margin Δ
| CAGRΔ \ MgnΔ | -3.0pp | -1.5pp | +0.0pp | +1.5pp | +3.0pp |
|---|---|---|---|---|---|
| -3.0pp | $253 | $268 | $284 | $299 | $315 |
| -1.5pp | $269 | $286 | $302 | $319 | $335 |
| +0.0pp | $287 | $304 | $322 | $339 | $357 |
| +1.5pp | $305 | $324 | $342 | $361 | $380 |
| +3.0pp | $324 | $344 | $364 | $384 | $404 |
Tornado — DCF/share swing by driver (widest first)
| Driver | Low | High | Swing |
|---|---|---|---|
| Revenue CAGR ±3pp | $284 | $364 | $80.00 |
| Terminal × ±15% | $285 | $359 | $74.00 |
| Op margin ±3pp | $287 | $357 | $70.00 |
| WACC ±1pp | $309 | $335 | $26.00 |
| Capex intensity ±15% | $320 | $323 | $3.00 |
Company lever — SoP/share vs Enterprise Software multiple (AI re-rating) (base 22.0x)
| Multiple | 15.4x | 18.7x | 22.0x | 25.3x | 28.6x |
|---|---|---|---|---|---|
| SoP/share | $235 | $284 | $333 | $382 | $431 |
Peer Quality & Weighting
| Peer | Fwd P/E | Growth | Op margin | Quality | Weight cap |
|---|---|---|---|---|---|
| ORCL | 18.9× | 10% | 36% | segment | 50% |
| CRM | 11.0× | 10% | 22% | segment | 50% |
| CDNS | 46.5× | 10% | 30% | broad | 25% |
| SNPS | 31.8× | 10% | 10% | direct | 100% |
Quality-weighted forward P/E: 25.9× (simple median 25.3×). Direct peers count 100%, segment 50%, broad 25%.
Historical-range cross-check: 52-week range $271–$621, centre $410 (+15% vs spot); spot sits at the 24th percentile of the range. Low-weight mean-reversion cross-check, not a fundamental anchor.
Risk / Reward & Margin of Safety
| Metric | Value |
|---|---|
| Upside to triangulated FV | $295 (-17% vs spot · triangulated FV) |
| Downside to bear case (Structural — AI Disruption / SaaS De-Rate) | $128 (-64% vs spot · bear scenario) |
| Reward-to-risk ratio | withheld — the triangulated FV is at or below spot, so there is no reward leg to divide by the risk leg |
| Margin of safety (FV vs spot) | -20% |
| P(price > spot) — Monte Carlo | 24% |
That ratio compares triangulated upside against the probability-weighted bear target, not the extreme tail; with a leg missing it is withheld rather than computed from a magnitude. Bull case (Bull — Re-Rate): $495.
Company Overview & Business Model
Tyler Technologies Inc — TECHNOLOGY · SOFTWARE - APPLICATION. Tyler Technologies, Inc., based in Plano, Texas, is the largest provider of software to the United States public sector.
How it makes money.
| Segment | Rev mix | Growth | Op margin | Key driver |
|---|---|---|---|---|
| Enterprise Software | 100% | +10% | 24% | software/SaaS spend + net retention + AI monetization vs AI disruption |
Edge. Wide moat. Authored moat rationale withheld pending re-authoring.
Revenue-Segment Breakdown
The company-specific drivers behind the valuation — each segment carries its own growth, margin, multiple and capex intensity. (Tags: FACT reported · ESTIMATE from disclosures · INFERENCE judgment.)
| Segment | Revenue | Mix | Growth | Op margin | EBIT | Multiple | Capex % | Tag |
|---|---|---|---|---|---|---|---|---|
| Enterprise Software | $2.4B | 100% | 10% | 24% | $0.6B | 22.0x | 3% | ESTIMATE |
| EBIT = segment revenue × operating margin (segment EBITDA not shown — per-segment D&A is not separately disclosed). |
Named Exposures
Demand & pricing cycle (FACT/ESTIMATE)
| Dimension | Assessment |
|---|---|
| driver | software/SaaS spend + net retention + AI monetization vs AI disruption |
| net_debt_or_cash_b | 0.27 |
Capital intensity & shareholder returns (ESTIMATE)
| Dimension | Assessment |
|---|---|
| capex_pct_revenue | 0.03 |
| div_yield | — |
Structural risk vs optionality (INFERENCE)
| Dimension | Assessment |
|---|---|
| downside | AI disruption / SaaS de-rate |
| upside | AI monetization + platform expansion |
Balance Sheet & Liquidity
| Metric | Value |
|---|---|
| Net debt | $-0.4B — net cash |
| Net debt / EBITDA | -0.92x |
| Interest coverage (EBIT / interest) | 79.0x |
| Current ratio | 1.05x |
| Lease obligations | $0.0B |
| Cash & ST investments | $1.1B |
Balance-sheet data as of 2025-12-31 (Alpha Vantage).
Capital Allocation
| Metric | Value |
|---|---|
| Free cash flow | $0.6B |
| Buybacks / dividends | $0.1B / $0.0B |
| Total shareholder yield | 1.1% |
| Payout as % of FCF | 24.0% |
| Reinvestment (capex / OCF) | 2.4% |
| SBC as % of FCF | 23.7% |
| Allocation stance | reinvesting |
Free-Cash-Flow Quality
| Metric | Value |
|---|---|
| FCF margin | 26.6% |
| FCF conversion (FCF / net income) | 201.9% |
| FCF yield | 4.6% |
| Capex intensity (capex / revenue) | 0.7% |
| FCF − SBC (diagnostic) | $0.5B |
| Capex split (maint / growth) | 45% / 55% — Capital-light SaaS (~3% capex/rev); growth tilt is cloud-infrastructure migration and product/AI development, not fixed plant. |
Accounting quality: SBC 1% of revenue; cash conversion (OCF/NI) 207% — cash-backed.
Competitive Moat
Moat sources:
- Mission-critical local-government software (courts, permitting, ERP) with high switching costs
- Long procurement cycles + government risk-aversion create incumbency lock-in
- Payments monetization layer (Tyler/NIC) attached to the installed base
- Near-100% recurring-revenue renewal on a sticky public-sector base
Earnings-Call Disconfirmation & Sentiment
Derived signals from the MCH market-data store (Alpha Vantage transcripts + news). Quantitative tone only — a disconfirmation flag, not a substitute for reading the call.
Management vs analyst tone (2026Q2): management +0.45 vs analyst floor +0.00 → delta +0.45 (n=46 mgmt / 34 Q&A; 59th pctile across the S&P book, z +0.3).
Flag: TYPICAL — management-vs-analyst tone within the normal cross-sectional range.
| Quarter | Mgmt | Analyst | Delta |
|---|---|---|---|
| 2026Q2 | +0.45 | +0.00 | +0.45 |
| 2026Q1 | +0.64 | +0.12 | +0.52 |
| 2025Q4 | +0.45 | +0.19 | +0.26 |
| 2025Q3 | +0.45 | +0.15 | +0.30 |
News (last 365d, 1302 articles): avg ticker sentiment +0.20 (bullish 33% / bearish 4%)
Consensus & Market Expectations
| Reference | Value |
|---|---|
| Street target (mean) | $427 (+20% vs spot · street) |
| House target | $291 (-31.7% vs street) |
| Sell-side coverage | 22 analysts (SB 5 / B 13 / H 4 / S 0 / SS 0; net score 0.52) |
| Consensus FY EPS | $13.10 (reference only — house values on EV/EBITDA) |
| Consensus FY revenue | $2.5B; house in-line (+1.8%) |
_Consensus figures: Alpha Vantage sell-side aggregates. Where the house view sits materially above or below the street, the divergence is itself a datum — see the thesis.
Catalyst Calendar
- 2026-10-31 (~68d) — AI-product / payments-monetization launch and attach (authored)
- 2027-03-31 (~219d) — Large state/local ERP contract renewal cohort (authored)
Forecast Track Record
- EPS surprise: beat 62% of the last 8 quarters; average surprise +2.0%.
- Prior-forecast backtest (13 snapshots, 2026-06-27→2026-08-20): directional hit-rate 8%; mean predicted -5.6% vs realised +15.3%. Disconfirming track record is reported, not suppressed.
Catalyst Timeline
5 catalysts in the next 90 days (of 14 tracked). Importance 1–3; confidence 0–1.
| When | Catalyst | Type | Importance | Confidence |
|---|---|---|---|---|
| 2026-09-16 (in 22d) | FOMC rate decision + SEP dot plot | macro | ●● | 0.8 |
| 2026-09-18 (in 24d) | Quarterly options-expiry cluster (3rd Friday) | opex_cluster | ● | 1.0 |
| 2026-10-14 (in 50d) | September CPI | macro | ●● | 0.8 |
| 2026-10-28 (in 64d) | FOMC rate decision + press conference | macro | ●● | 0.8 |
| 2026-10-31 (in 67d) | AI-product / payments-monetization launch and attach | authored | ● | 0.7 |
| 2026-12-09 (in 106d) | FOMC rate decision + SEP dot plot | macro | ●● | 0.8 |
| 2026-12-18 (in 115d) | Quarterly options-expiry cluster (3rd Friday) | opex_cluster | ● | 1.0 |
| 2027-01-27 (in 155d) | FOMC rate decision + press conference | macro | ●● | 0.8 |
| 2027-03-17 (in 204d) | FOMC rate decision + SEP dot plot | macro | ●● | 0.8 |
| 2027-03-19 (in 206d) | Quarterly options-expiry cluster (3rd Friday) | opex_cluster | ● | 1.0 |
| 2027-03-31 (in 218d) | Large state/local ERP contract renewal cohort | authored | ● | 0.7 |
| 2027-04-28 (in 246d) | FOMC rate decision + press conference | macro | ●● | 0.8 |
| 2027-06-09 (in 288d) | FOMC rate decision + SEP dot plot | macro | ●● | 0.8 |
| 2027-06-18 (in 297d) | Quarterly options-expiry cluster (3rd Friday) | opex_cluster | ● | 1.0 |
_Sources: extended.catalysts, data/catalysts/
Regulatory & Legal Risk
| Issue | Probability | Valuation sensitivity | Horizon |
|---|---|---|---|
| Government procurement / data-sovereignty and cybersecurity mandates (FedRAMP/StateRAMP) for public-sector cloud | medium (~35%) | medium - compliance cost is a moat-widener but a barrier to SaaS margin; ~5% of FV | 12-24m |
| Public-sector budget / municipal-finance pressure limiting software spend | medium (~40%) | medium - government budgets are counter-cyclical but not immune; ~5-8% of FV | 12-24m |
Probabilities and sensitivities are analyst estimates, not market-implied.
Scenario Macro & Key Risks
| Scenario | Macro assumption | Key risk |
|---|---|---|
| Structural — AI Disruption / SaaS De-Rate | AI-assisted tooling lets smaller vendors replicate courts/permitting/payments workflows; the whole SaaS complex de-rates. | Slow erosion of pricing power (not a demand collapse) narrows the switching-cost moat AND compresses the multiple together. |
| Enterprise-Spend Recession | Broad enterprise/government software-spend recession slows seat growth and new logos for 1-2 years. | Even counter-cyclical government budgets defer discretionary modules and slow the SaaS transition. |
| Growth — AI Monetization / Platform | Tyler monetizes AI/payments across the installed base and expands the platform above trend. | Requires AI to be net-accretive (offense) rather than a pricing-erosion threat (defense) — the central debate. |
| Bull — Re-Rate | Market re-rates Tyler as a durable public-sector compounder with widening payments monetization. | Prices a compounder re-rate above the current ~22x that AI-disruption fears currently cap. |
Scenario-macro rows withheld pending re-authoring: 1 carrying another cluster's vocabulary or a frozen figure — recorded in the narrative quarantine ledger.
Decision Rules (Machine-Checked)
Stance: Hold — 0 bullish / 1 bearish / 0 caution rules triggered of 6 evaluable (0 lacked data).
| Rule | Condition | Observed | Triggered |
|---|---|---|---|
| R1-valuation-stretch | expected return vs fair value < -12 (upside_pct) |
-18.13 | YES |
| R2-valuation-opportunity | expected return vs fair value > 15 (upside_pct) |
-18.13 | no |
| R3-street-revisions | street net rating stance < -0.25 (extended.consensus.street_score) |
0.52 | no |
| R4-earnings-quality | cash conversion of earnings < 80 (extended.accounting_quality.cash_conversion_pct) |
207.0 | no |
| R5-technical-breakdown | price vs 200-day SMA < 0.85 (technicals.sma_200) |
0.98 | no |
| R6-vol-regime-shift | IV/RV vol-risk premium > 1.4 (options_overlay.iv_rv) |
1.04 | no |
Machine-checked rules over disclosed inputs. The authored falsification triggers elsewhere in this report are analyst judgment and are NOT evaluated here. The stance is a portfolio-management signal and does not modify the published research rating.
Reasons the Thesis Could Fail (Falsifiable)
Pre-registered signals that would break the thesis — each polices a specific scenario boundary and is checked at every earnings update:
- Organic recurring-revenue (subscriptions) growth, y/y < 0.065 (2 consecutive prints). (rationale withheld pending re-authoring — frozen figure or verdict)
- Non-GAAP operating margin < 0.215 (2 consecutive prints). (rationale withheld pending re-authoring — frozen figure or verdict)
- Dollar-based net revenue retention < 1.05 (2 consecutive prints). (rationale withheld pending re-authoring — frozen figure or verdict)
- SaaS bookings / new-client deal count, y/y < 0.0 (2 consecutive prints). The cloud-transition thesis needs new-logo and flip momentum. Two consecutive quarters of declining SaaS bookings would show the transition, not just the cycle, is rolling over.
- Forward P/E multiple (software group re-rating) < 18.0 (single event). (rationale withheld pending re-authoring — frozen figure or verdict)
Fact / Inference / Speculation
- FACT: Spot $356; 52-week range $271–$621; engine rating SELL; house target $291 (-18%). (source: Alpha Vantage 2026-08-24, 25 August 2026)
- INFERENCE: Triangulated FV $295 (-17% vs spot · triangulated FV); the rating tracks the Monte-Carlo + scenario-PWEV core; the cash-flow anchor sits above the multiple-discipline core.
- SPECULATION: At current prices the embedded bet is that the market keeps paying the current multiple through the capex cycle — a regime call the engine cannot verify from fundamentals alone.
Conviction Score
Research Conviction measures the strength and quality of the research setup — input coverage, financial quality, valuation support, process agreement. It is NOT the probability that the recommendation succeeds; the forecast track record section is the evidence on that.
66.7/100 (confidence band 53.5–79.9), 83rd percentile of 858 covered names (as of 2026-08-24). Weighted composite under config ros-1.19.0 — every component and its inputs below.
| Component | Score (0–100) | Weight | Inputs |
|---|---|---|---|
| business quality | 94 | 15% | extended.fcf_quality.fcf_margin_pct, extended.balance_sheet.net_debt_to_ebitda, extended.accounting_quality.cash_conversion_pct |
| financial strength | 92 | 10% | extended.balance_sheet.net_debt_to_ebitda, extended.balance_sheet.interest_coverage |
| valuation | 32 | 15% | upside_pct |
| growth | 61 | 10% | reconciliation.ttm_revenue_billions, reconciliation.fy_guide_revenue_billions |
| earnings visibility | 62 | 10% | extended.forecast_accuracy.eps_surprise.beat_rate_pct |
| moat | 85 | 10% | enrichment.moat.rating |
| technical trend (heuristic — no validation record; weight change reserved for AM-060) | 65 | 10% | technicals.rsi, technicals.sma_50, technicals.sma_200 |
| macro tailwinds | — | 10% | industry_context.house |
| risk profile | 45 | 10% | monte_carlo.prob_above_current, monte_carlo.p10, monte_carlo.p90, monte_carlo.median |
Missing inputs (macro tailwinds) are excluded and the remaining weights renormalised; the confidence band widens accordingly.
Score history: 67.4 → 67.4 → 67.9 → 67.0 → 67.0 → 66.5 → 67.0 → 67.0.
Probability-Weighted Return Profile
Horizon: 1 year — at this horizon CAGR equals total return by definition. Expected values are the probability-weighted sums over the full scenario set below.
| Scenario | Probability | Target | Total return | Contribution |
|---|---|---|---|---|
| Structural — AI Disruption / SaaS De-Rate | 20% | $128 | -64.1% | -12.8pp |
| Enterprise-Spend Recession | 17% | $215 | -39.5% | -6.7pp |
| Base — Seat + Retention Growth | 35% | $284 | -20.3% | -7.1pp |
| Growth — AI Monetization / Platform | 20% | $389 | +9.4% | +1.9pp |
| Bull — Re-Rate | 8% | $495 | +39.1% | +3.1pp |
| Aggregate | Value |
|---|---|
| Expected return (gross, 1y) | -21.6% |
| Expected return net of SBC dilution | -21.6% |
| Outcome dispersion (σ, from MC p10–p90) | 33.3% |
| Expected Sharpe (rf 4%) | -0.77 |
| Downside expectation (prob-weighted loss branches) | -26.6% |
The gross expected return is the probability-weighted scenario return (it reconciles to the gross PWEV); the diluted figure applies the SBC share-count charge and matches the published PWEV-based target.
Expected Alpha
Expected return minus the return this name is REQUIRED to deliver for its risk (1-year horizon). Constants are pre-registered (preregistered-static (amendment #2, 2026-07-29); not fitted to MCH outcomes).
| Component | Value |
|---|---|
| Expected return (gross, 1y) | -21.6% |
| Risk-free rate | 4.01% (1y proxy (3m/2y midpoint; AV lacks a 1y tenor), as of 2026-08-13) |
| Beta (shrunk, 1y vs SPY) | 0.37 (as of 2026-08-24) |
| Equity risk premium | 4.5% |
| Required return | 5.7% |
| Expected alpha | -27.3% |
| Alpha per unit risk (EA/σ) | -0.82 |
A negative expected alpha does not change the rating — it says the expected return does not clear the risk-adjusted hurdle at today's price. Rating mechanics are unchanged by this section.
Probability Cross-Checks
Not authoritative. The scenario probabilities in this report are AUTHORED — a judgement about how the world might go, not a measurement. Nothing below modifies them, the target, the rating or any position size. These checks ask only whether anything outside our own model agrees with us; where it does not, that is information for the reader, not a correction we have quietly applied.
| Cross-check | Ours | Comparator | Reading |
|---|---|---|---|
| Scenario spread vs options market | 30.0% (1σ) | 37.1% implied | broadly consistent with the market's implied uncertainty |
| Mass above spot: scenarios vs our own MC | 28.0% | 24.0% | the two expressions of our own view agree |
| Realised scenario frequency | 23 dated anchors | — | 23 dated anchors available; realised-vs-prior comparison is now meaningful. |
Authored set: 5 scenarios, probabilities summing to 1.0, mean target $278.82.
Factor Exposures
Cross-sectional percentiles over 858 covered names (style scores sector-demeaned; thematic = return-beta to the theme's proxy ETF). 50 = estate median.
| Style | Percentile | Theme | Percentile | |
|---|---|---|---|---|
| Growth | 11 | AI | 15 | |
| Value | 41 | Cloud | 93 | |
| Quality | 92 | Semis | 1 | |
| Momentum | 1 | Consumer | 22 | |
| Low-Vol | 92 | Rates | 25 | |
| USD | 85 | |||
| Energy | 76 |
Market interaction: correlation vs SPY +0.27, vs QQQ +0.19 (trailing ~1y daily returns).
Options Intelligence
Preferred structure: Collar. The selector reads the equity view (direction) and the volatility surface — nothing here re-prices the chain.
- bearish with rich premium — finance downside protection by selling an expensive call (collar)
- Direction bearish from the overlay conviction/rating (read-only input).
- IV/RV at the 71st percentile of the cross-section → high vol bucket. This is the measure that selects the structure above: it ranks how rich this name's implied vol is against its own realised vol, relative to other names.
- Reported alongside and not used to select: this name's own ATM IV sits at the 83rd percentile of its own month-end history (decile 9).
IV term structure (flat, slope -0.9pp): 25-DTE 47% · 116-DTE 45% · 207-DTE 46%
| Priced structure | Value |
|---|---|
| Legs | Long 320 P, Short 390 C |
| Expiry | 2027-03-19 |
Economics copied verbatim from the options overlay (priced from the listed chain (EOD marks)); the selector does not re-price.
Alternatives: Protective Put. IV rank shown via the name's own monthly IV history (advisory); structure selected on the cross-sectional IV/RV percentile. Model output for research and education only — not individualised investment advice. Position-sizing and stance figures are mechanical outputs of the disclosed rules and inputs; they do not consider any person's objectives, financial situation, or tax status.
Position Sizing Framework
research rating is SELL-tier — the model carries no long position.
| Parameter | Value |
|---|---|
| Initial position | 0.00% NAV |
| Maximum position | 0.00% NAV |
| Risk budget | 0.00% NAV |
| Annualized outcome σ (MC) | 33.3% |
| Indicative holding period | 3–12 months |
| Liquidity | high, ~$280M ADV (adv usd 21 (split-adjusted 21d average, AM-046)) |
| Rebalancing trigger | position drifts ±25% from target weight, or the decision-rules stance changes |
Model output for research and education only — not individualised investment advice. Position-sizing and stance figures are mechanical outputs of the disclosed rules and inputs; they do not consider any person's objectives, financial situation, or tax status.
Options Overlay
A defined-risk way to express the SELL equity view. Chain as of 2026-08-24 — end-of-day marks — indicative, not executable quotes.
Market signals — ATM IV 47.3% (moderate regime) · expected move ±9.7% (2026-09-18) · put/call OI 0.46 · ATM Δ 0.50 / Θ -0.38 / ν 0.37. Direction: SHORT/HEDGE (implied return -17.0% to triangulated fair value $295.42).
Bear Put Spread (Bearish) — Long 360 P / Short 300 P · 2027-03-19 · net debit $24.6 · max profit $35.40 · breakeven $335.40 · RoR 144.0% · max loss $24.60 · priced from the listed chain (EOD marks)
Defined-risk downside expression: the debit caps the loss, with the position gaining as the stock falls toward the lower strike — a way to act on a bearish view without shorting stock. Illustrative — no outcome is implied or guaranteed.
Protective Put (if held) (Hedge) — Long 360 P · 2027-03-19 · premium $46.25 · floor 1.0% · max loss $46.25 · priced from the listed chain (EOD marks)
Insurance for an existing holding — a known premium buys a floor while leaving the upside intact. A way to hold through a binary event or volatility with defined downside.
Protective Collar (if held) (Hedge) — Long 320 P / Short 390 C · 2027-03-19 · net $10.6 · floor -10.0% · cap +10.0% · priced from the listed chain (EOD marks)
For a holder who wants to stay invested but cap risk: the sold call funds most of the protective put, fencing the position into a band — a way to ride out a de-rating without selling.
Indicative options structures — a defined-risk expression of the equity view, model-and-market illustrated from the last-close chain. NOT personalised advice or an executable quote; premiums, IV and greeks move intraday. Options carry the risk of total loss of premium. Not a registered financial adviser.
Rating Bridge
Rating = SELL because:
- Probability-weighted scenario value implies -22% vs spot
- Monte Carlo median implies -26% vs spot
- DCF fair value implies -10% vs spot
- Bear case (Structural — AI Disruption / SaaS De-Rate) downside is -64% vs spot
- Net: the valuation anchor itself sits 17.0% below spot, so there is no reward leg to weigh against the bear case and the reward-to-risk ratio is withheld rather than computed off a negative upside. The rating warrants a Sell.
Model Appendix
DCF — line items
| Year | Revenue | Op income | − Capex | + D&A | FCF | PV(FCF) |
|---|---|---|---|---|---|---|
| FY+1 | $3B | $1B | $0B | $0B | $1B | $1B |
| FY+2 | $3B | $1B | $0B | $0B | $1B | $1B |
| FY+3 | $3B | $1B | $0B | $0B | $1B | $1B |
| FY+4 | $3B | $1B | $0B | $0B | $1B | $1B |
| FY+5 | $3B | $1B | $0B | $0B | $1B | $1B |
| Terminal | — | — | — | — | $1B × 19.0x | $10B |
FCF is bridged: NOPAT + D&A − Capex − ΔNWC (capex intensity 3% of revenue, weighted from the segments) — not a single conversion fudge.
WACC 9.0% · Σ PV(FCF) $3B + PV(terminal) $10B = EV $12B; + net cash $0.3B → equity $13B ÷ diluted shares $0.04B = $322/share (exit-multiple terminal).
- Gordon terminal at 2.5% → $280/share — a genuinely non-multiple, cash-based cross-check; the exit-multiple and Gordon values bracket the terminal-value risk.
- Incremental ROIC on the forecast capex ≈ 226% vs WACC 9.0% → above WACC — the build is value-creative.
Peer set
| Peer | EV/Rev | Fwd P/E | Growth | Op margin |
|---|---|---|---|---|
| ORCL | 8.4x | 18.9x | 10% | 36% |
| CRM | 3.6x | 11.0x | 10% | 22% |
| CDNS | 18.7x | 46.5x | 10% | 30% |
| SNPS | 11.2x | 31.8x | 10% | 10% |
| Median | 9.8x | 25.3x | — | — |
Implied prices at the peer medians: EV/Rev → $611 (no P/E-implied price — no forward-EPS basis at the peer step).
Weighted fair-value math
| Anchor | Value | Weight | Contribution |
|---|---|---|---|
| DCF | $322 | 47% | $150 |
| Scenario PWEV | $279 | 33% | $92.94 |
| Monte Carlo median | $262 | 20% | $52.34 |
| Triangulated | — | 100% | $295 |
Assumption Register
| Assumption | Value | Used in | Source |
|---|---|---|---|
| WACC | 9.0% | DCF discount rate | estimate (CAPM) |
| Terminal multiple | 19× | DCF exit value | estimate (peer-anchored) |
| Terminal growth | 2.5% | DCF Gordon terminal | estimate |
| SBC dilution | 0.0%/yr | PWEV, MC, DCF (charged once) | estimate (from SBC/rev) |
| EPS basis | consensus forward EPS (broker-adjusted, non-GAAP) | all forward P/E & scenario multiples | definition |
Sensitivity-ranked drivers (widest fair-value swing first): Revenue CAGR ±3pp (80.0); Terminal × ±15% (74.0); Op margin ±3pp (70.0); WACC ±1pp (26.0); Capex intensity ±15% (3.0).
Inputs, Sources & Confidence
Every load-bearing input, labelled by type and confidence. (reported fact · company guidance · consensus estimate · market data · house estimate · inference.)
| Input | Value | Type | Source | Confidence | Used in |
|---|---|---|---|---|---|
| Revenue TTM | $2.4B | reported fact | 10-K/10-Q via AV | High | Forecast base, EV/Rev |
| FY+1 guided revenue | $2.6B | company guidance | Company guidance | Medium | Forecast, SoP |
| Consensus FY EPS | $13.0989 | consensus estimate | Sell-side consensus via AV | Medium | Variant perception |
| Diluted shares | 0.039B | reported fact | 10-K via AV | High | Market cap, per-share |
| Net debt / cash | $-0.421B | reported fact | Balance sheet via AV | High | EV, DCF equity bridge |
| WACC | 9.0% | house estimate | CAPM (beta/rf) | Medium | DCF discount rate |
| Terminal multiple | 19× | house estimate | Peer/historical range | Medium | DCF exit value |
| Terminal growth | 2.5% | house estimate | Long-run GDP+ | Medium | DCF Gordon terminal |
Research Provenance
| Field | Value |
|---|---|
| Quantitative engine | mch_stock_engine v2.0 |
| Research OS config | ros-1.19.0 |
| Analysis as-of | 2026-08-25 (prices 2026-08-24) |
| Narrative authorship | claude-opus-5 · Claude Code, supervised, drafted 2026-08-16 |
| Human review | Marinus 2026-08-16 |
| Evidence | 8/8 load-bearing inputs sourced; 13/14 mandated claims cited |
| QA | scanned post-emit by the document-QA layer; the publication label (Draft / Research / Decision-level) is stamped on the published page, not authored here |
Load-Bearing Assumptions
DCF: WACC 9.0%, terminal multiple 19×, FY+5 revenue $3B. Triangulation leans 47% on DCF, 33% on PWEV, 20% on the Monte Carlo median.
Appendix & audit trail — source log, data provenance, disclosures
Source Log
| Source | Type | Date | Used for | Reference |
|---|---|---|---|---|
| Alpha Vantage — GLOBAL_QUOTE / OVERVIEW | market data | 2026-08-24 | Price, market cap, EV, 52-week range, forward P/E | Alpha Vantage 2026-08-24 |
| Company income statement (10-K / 10-Q) via Alpha Vantage | reported fact | 2026-08-24 | Revenue, gross/operating margin, EBIT, interest expense | INCOME_STATEMENT / latest annual |
| Company balance sheet (10-K / 10-Q) via Alpha Vantage | reported fact | 2026-08-24 | Cash, debt, net debt, leases, equity, coverage | BALANCE_SHEET / latest annual |
| Company cash-flow statement (10-K / 10-Q) via Alpha Vantage | reported fact | 2026-08-24 | Operating cash flow, capex, FCF, buybacks, dividends, SBC | CASH_FLOW / latest annual |
| Company earnings releases via Alpha Vantage | reported fact | 2026-08-24 | Reported EPS, surprise history | EARNINGS / quarterly |
| Sell-side consensus via Alpha Vantage | consensus estimate | 2026-08-24 | Forward revenue/EPS consensus, analyst count | EARNINGS_ESTIMATES |
| Earnings calendar via Alpha Vantage | market data | 2026-08-24 | Next earnings date, catalyst timing | EARNINGS_CALENDAR |
| Company guidance | company guidance | 2026-08-24 | FY guided revenue / non-GAAP EPS basis | company guidance / earnings call |
| MCH segment model (from filings & disclosures) | house estimate | 2026-08-24 | Segment revenue, margins, multiples, AI decomposition | company_context (authored, tagged) |
| MCH qualitative analysis | inference | 2026-08-24 | Moat, regulatory risk, scenario macro, catalysts | company_context enrichment (authored) |
| MCH investment thesis & falsification triggers | house estimate | 2026-08-24 | Thesis, anti-thesis, thesis-break signals | authored §5.3 |
Citation coverage: 13/14 mandated claims sourced. Filing URLs are not available via the market-data provider; company statements are cited as 10-K/10-Q via Alpha Vantage.
Data Sources
- Prices, fundamentals, options chain, earnings — Alpha Vantage.
- Company filings (10-K / 10-Q) — SEC filings via EDGAR.
Disclosures & Limitations
This report is for informational and research purposes only. It is not personalised investment advice and does not consider any investor's objectives, financial situation, risk tolerance, tax position, or liquidity needs.
- This report is produced by the MCH Advisory quantitative research engine — valuation, scenarios, Monte Carlo and the decision layer are generated systematically from the disclosed inputs and the archetype/industry driver sets, and reviewed rather than written name-by-name. Every figure reconciles to the appendix and every score exposes its inputs.
- No suitability assessment has been performed for any individual.
- Market data may be delayed or inaccurate; figures are as of the analysis date.
- Model outputs (fair values, targets, scenario probabilities) are estimates and may be wrong.
- Forecasts are uncertain; past performance is not indicative of future returns.
- The author or publisher may hold positions in securities mentioned.
- Users should verify information against primary sources (company filings) before acting.
- Investing involves risk of loss; there is no guarantee any target price is achieved.
- Ratings follow a defined research methodology (12-month expected-return thresholds), not individual circumstances.