Rating: HOLD
| Metric | Value |
|---|---|
| Current Price | $421 |
| Triangulated Fair Value | $291 |
| 12-mo Scenario PWEV | $375 |
| Implied Return | -31% |
| Forward P/E | 211.4x |
| Market Cap | $1.58T |
| 52-Week Range | $289 – $499 |
Methodology: Valuation triangulated across five independent anchors — Monte Carlo (Student-t + regime switching), an independent DCF, peer re-rating, a sum-of-parts, and a scenario-weighted PWEV. Figures reconciled to mch_weekly_run live prices. Each chart below sits with the part of the thesis it evidences.
Investment Thesis
The bull case — 'Robotaxi Launch' (30% weight) — targets $550, +31% vs spot. It needs Gross Margin to surprise to the upside.
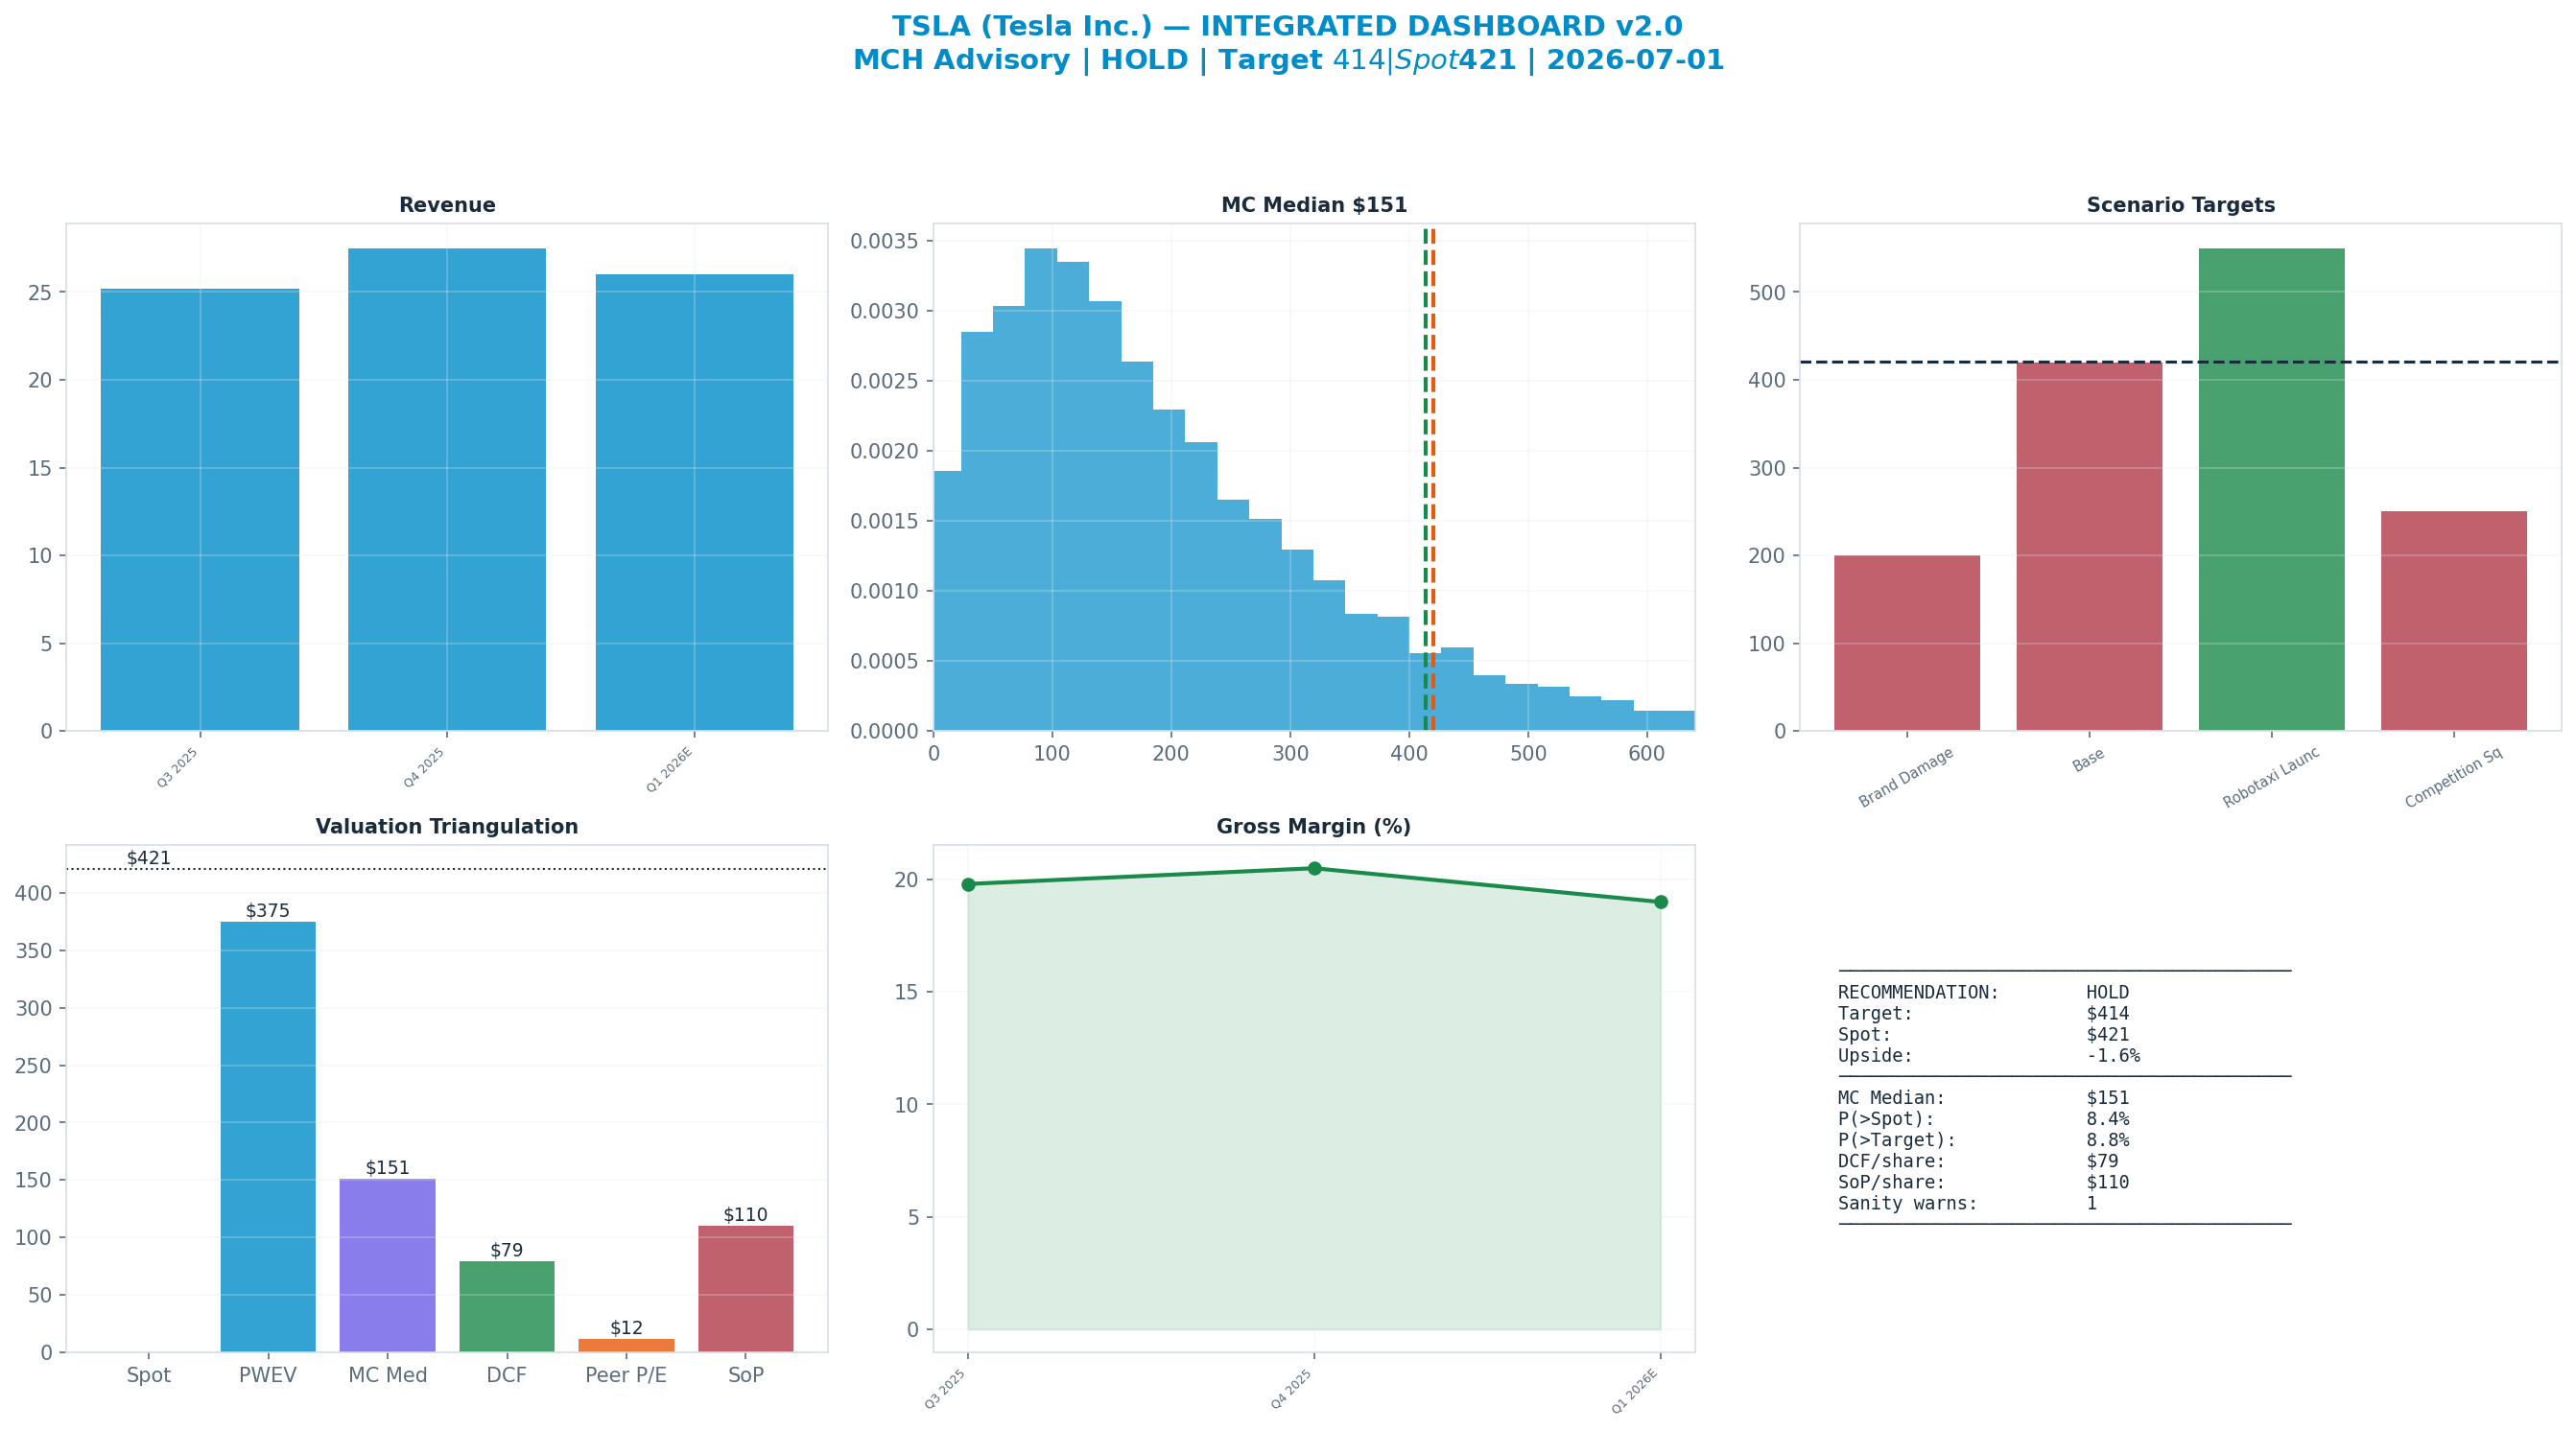
The dashboard below is the whole argument on one page: spot ($421) against each valuation anchor, the scenario tree, technicals and the options-implied move.
Anti-Thesis (The Real Bear Case)
The structural case — 'Brand Damage' (20%) — targets $200, -52% vs spot. This sits below the 52-week low — a genuine structural impairment, not a mild pullback.
Key Debate
Gross Margin explains 58% of Monte Carlo outcome variance — the single variable that decides which side is right.
Earnings-Call Disconfirmation & Sentiment
Derived signals from the MCH market-data store (Alpha Vantage transcripts + news). Quantitative tone only — a disconfirmation flag, not a substitute for reading the call.
Management vs analyst tone (2026Q1): management +0.22 vs analyst floor +0.00 → delta +0.22 (n=51 mgmt / 10 Q&A; 16th pctile across the S&P book, z -1.1).
Flag: CANDID — management unusually candid/cautious vs peers (relatively low spin).
| Quarter | Mgmt | Analyst | Delta |
|---|---|---|---|
| 2026Q1 | +0.22 | +0.00 | +0.22 |
| 2025Q4 | +0.38 | +0.00 | +0.38 |
| 2025Q3 | +0.41 | +0.00 | +0.41 |
| 2025Q2 | +0.45 | +0.18 | +0.27 |
News (last 365d, 1000 articles): avg ticker sentiment +0.06 (bullish 8% / bearish 7%)
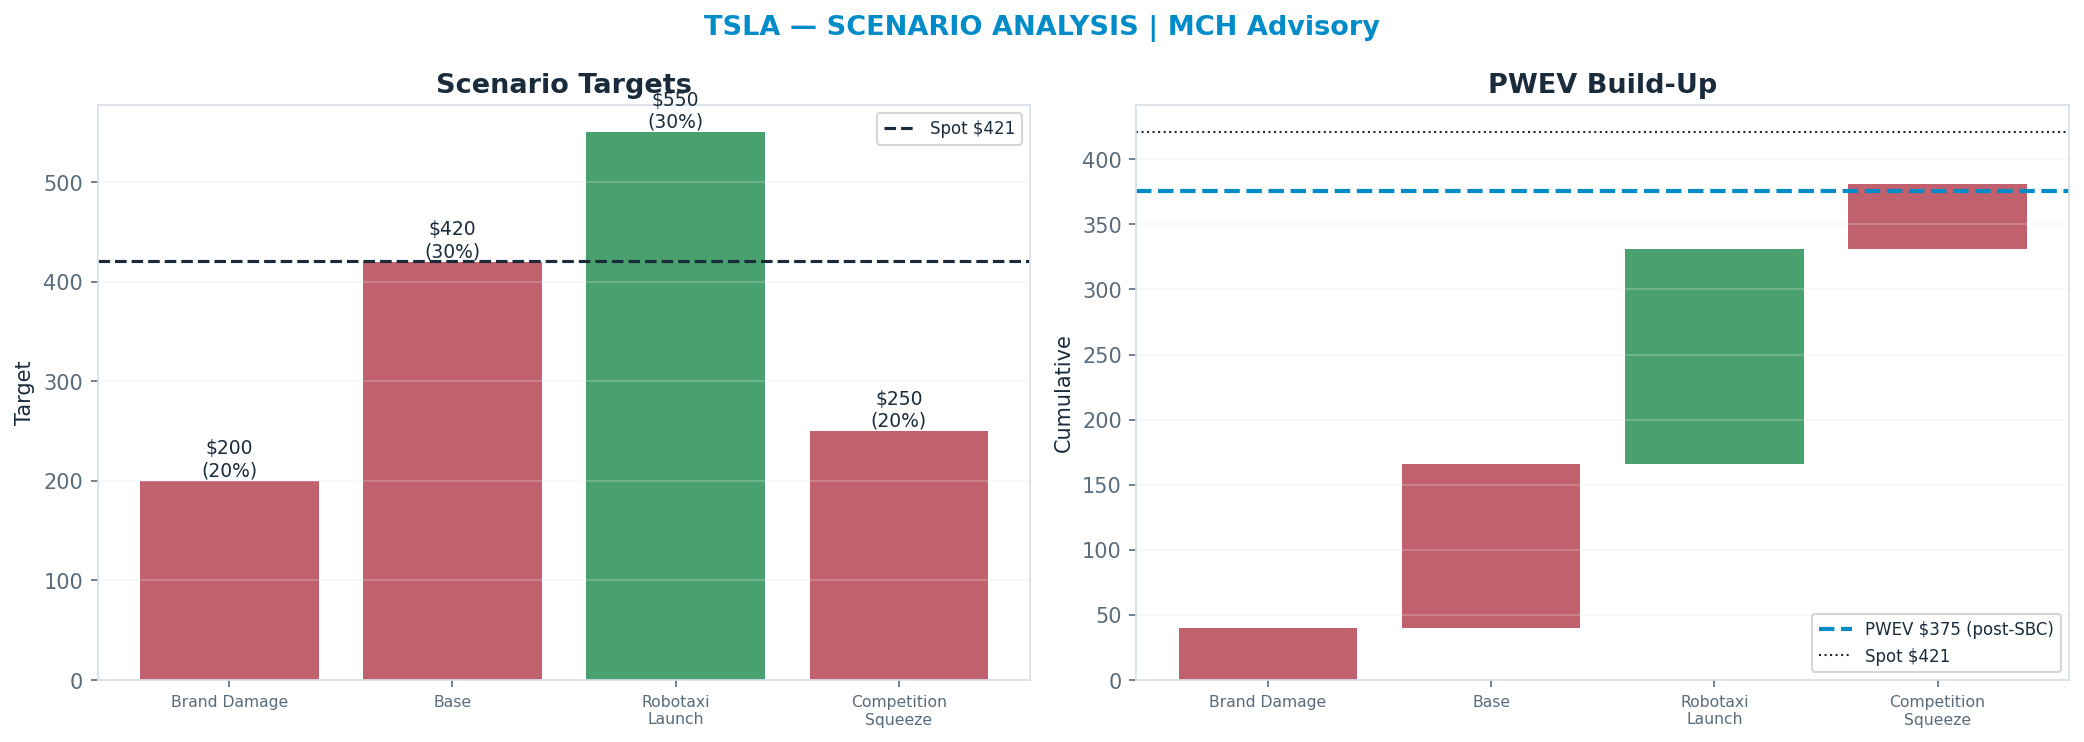
Scenario Analysis
The tree runs from a structural 'Brand Damage' downside ($200) to a 'Robotaxi Launch' bull case ($550); the probability-weighted blend (PWEV $375) is -11% versus spot.
| Scenario | Probability | Target | Return |
|---|---|---|---|
| Brand Damage | 20% | $200 | -52% |
| Base | 30% | $420 | -0% |
| Robotaxi Launch | 30% | $550 | +31% |
| Competition Squeeze | 20% | $250 | -41% |
| Probability-Weighted (PWEV, after SBC dilution) | — | $375 | -11% |
SBC charge: scenario targets are gross per-share prices; the PWEV is reduced by one year of stock-based-compensation dilution (1.5% of shares, on SBC ≈ 2% of revenue), trimming the gross PWEV of $381 to $375 (-1.5%). SBC is charged once, as dilution — never also deducted from FCF.
Scenario rationale — what each probability buys (the driver path behind every target):
- Brand Damage (20%, $200). Musk political-brand polarisation and demand erosion drive deliveries down year-on-year while the price war keeps auto gross margin in the low-teens; the autonomy option de-rates as the market loses confidence in timeline and execution. The multiple collapses toward an industrial OEM level and the residual option value is heavily discounted, placing the target below the 52-week low — a structural-impairment outcome, not a pullback. Drivers — deliveries: down YoY; auto_gm_ex_credits: ~12-13%; robotaxi_option: de-rates sharply; multiple: OEM-like, option discounted to near zero.
- Base (30%, $420). Deliveries stabilise roughly flat, auto gross margin holds in the mid-teens, and energy/storage continues to grow as the higher-quality pillar; FSD recognised revenue grows modestly while Robotaxi remains early and unproven. The market keeps a meaningful but discounted autonomy option in the price — supporting a premium-to-OEM multiple without crediting full robotaxi success. Drivers — deliveries: ~flat; auto_gm_ex_credits: ~15-16%; robotaxi_option: partial credit, unproven; multiple: premium-to-OEM, option partially valued.
- Robotaxi Launch (30%, $550). Unsupervised FSD clears regulatory milestones and Robotaxi scales across multiple cities with credible per-mile economics, validating the network thesis; high-margin autonomy revenue inflects and the energy business compounds. The autonomy option converts from speculative to partly-realised, and the multiple expands as the market capitalises a software/network earnings stream on top of the auto base. Drivers — deliveries: stable+; auto_gm_ex_credits: ~16%+; robotaxi_option: begins to convert to revenue; multiple: expands on network/software economics.
- Competition Squeeze (20%, $250). BYD and Chinese/EU competitors take share and force continued price cuts; deliveries grow only marginally while auto gross margin compresses and regulatory credits fade. Autonomy slips in timeline but is not abandoned, so a thin option premium survives; the multiple compresses materially toward a cyclical-OEM level as the cash base deteriorates. Drivers — deliveries: marginal growth; auto_gm_ex_credits: ~13-14%; robotaxi_option: timeline slips, thin premium; multiple: compresses toward cyclical OEM.
Valuation Triangulation
Five anchors — but read them with their basis in mind. The Monte Carlo, the DCF terminal, and the peer re-rate all key off a market multiple, so they are not fully independent; only the discounted cash flows themselves are genuinely multiple-free. The discipline is to read the spread and weight the cash-based view, not to treat five numbers as five independent votes.
| Method | Basis | Fair Value | vs Spot |
|---|---|---|---|
| Monte Carlo median (Student-t + regime) | multiple | $151 | -64% |
| Sum-of-Parts | multiple | $110 | -74% |
| Peer P/E re-rate | multiple | $12 | -97% |
| Peer EV/Revenue re-rate | multiple | $54 | -87% |
| Scenario PWEV | multiple | $375 | -11% |
| DCF (5-year + terminal) | cash flow + terminal × | $79 | -81% |
| Triangulated (weighted) | — | $291 | -31% |
DCF, sum-of-parts, peer P/E re-rate excluded from the weighted blend — diverges >55% from the Monte-Carlo / scenario core. For a high-leverage equity the per-share DCF (enterprise value less large net debt) is hypersensitive to the terminal multiple; a peer re-rate across heterogeneous margins is apples-to-oranges. Shown above for reference; the blend leans on the multiple-discipline and scenario anchors.
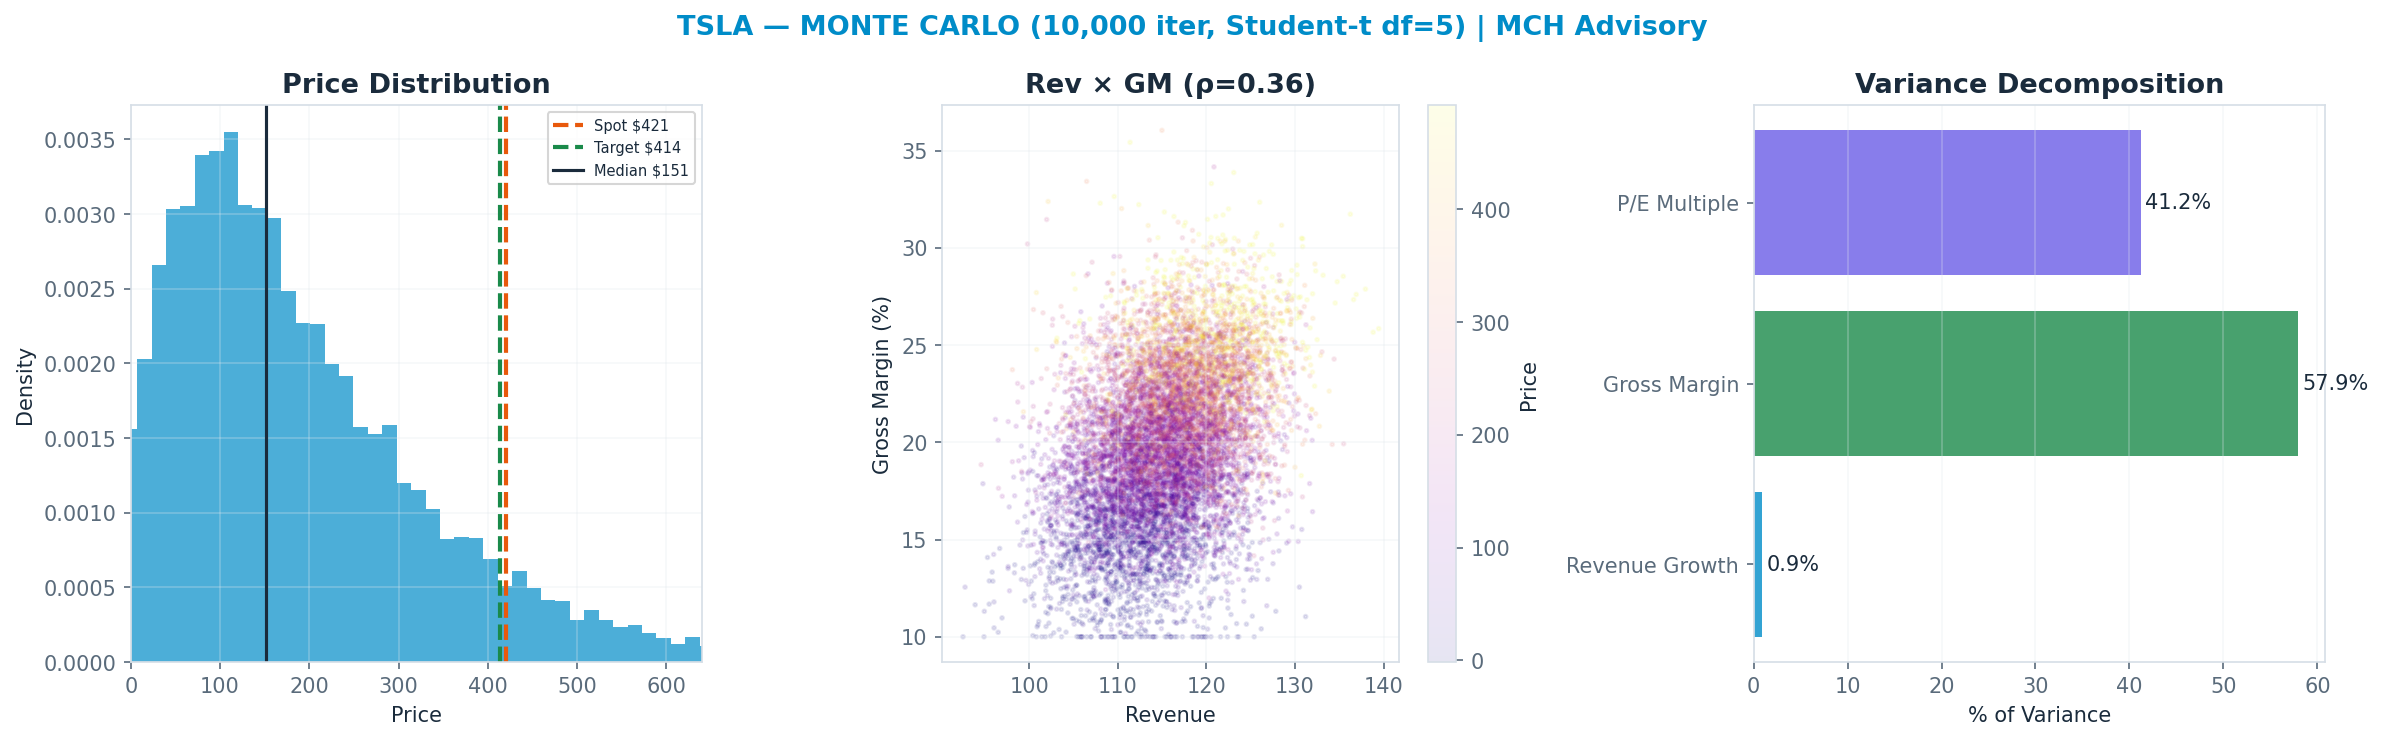
Monte Carlo — the distribution, not a point
10,000 paths, Student-t shocks (fat tails) with a regime-switching overlay. The median lands at $151 and 8% of paths finish above spot. The variance decomposition shows the gross margin is the dominant swing factor (58% of variance). The fundamental driver, not the multiple, sets the spread — a cleaner setup.
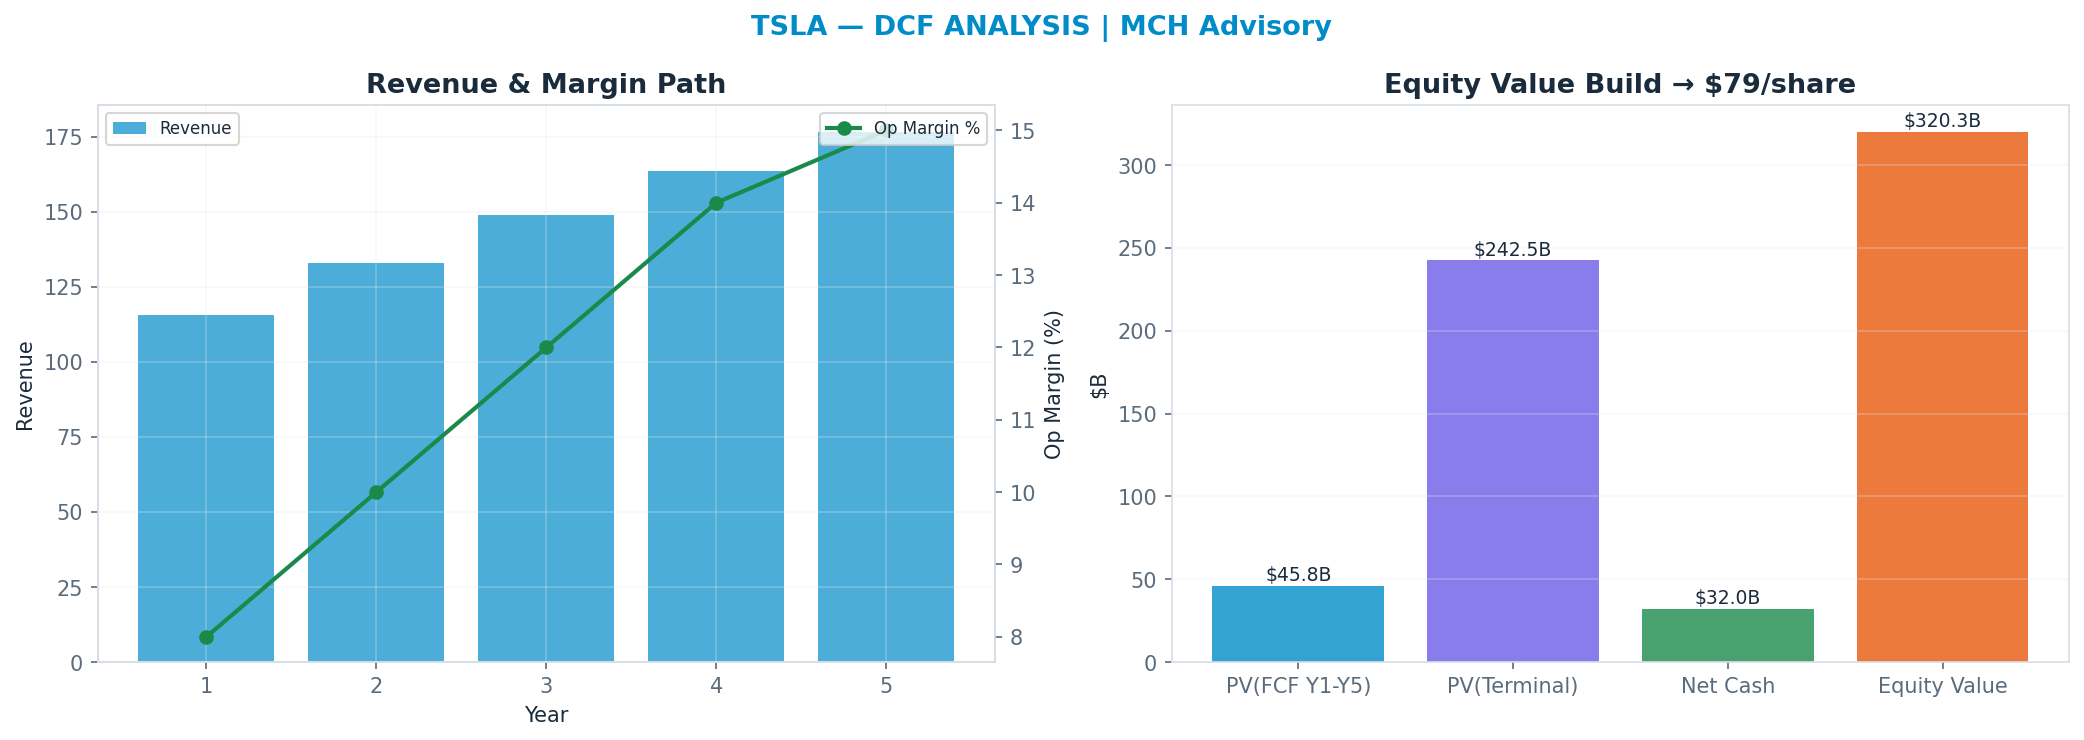
DCF — the cash-flow anchor
Independent of the market multiple: a 5-year path, WACC 12.0%, 22x terminal FCF multiple → $79. This anchor is deliberately the heaviest (35%): it is the valuation least hostage to the current multiple regime.
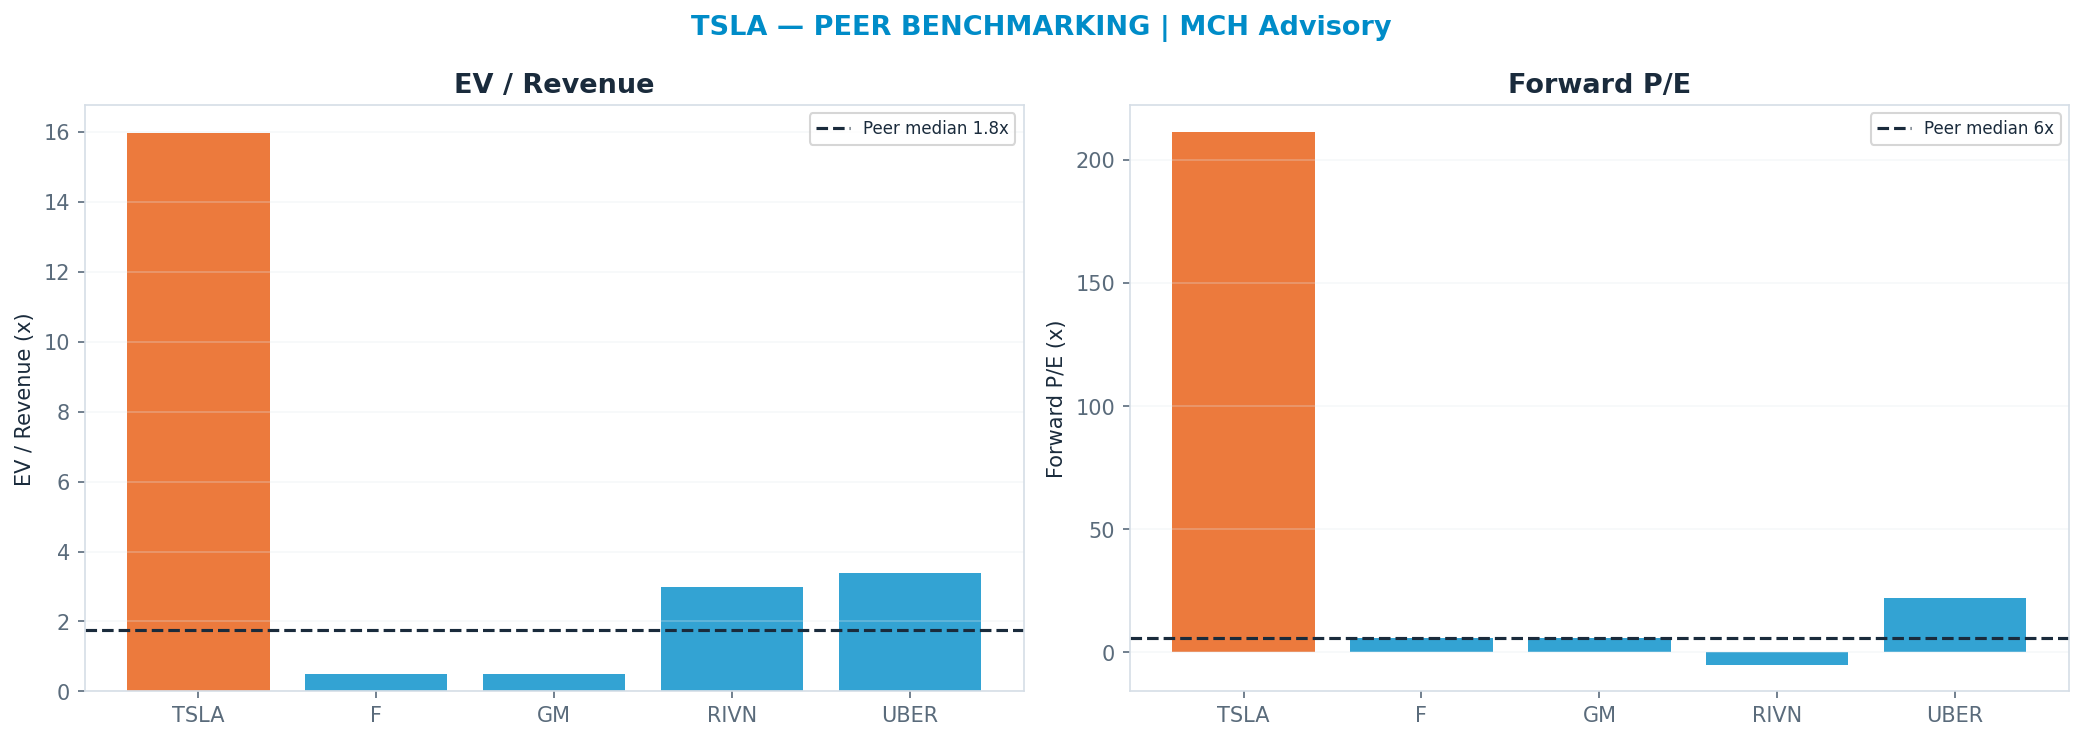
Peer benchmarking — relative value
Against the peer cohort, re-rating to the peer-median forward multiple (P/E 6.0x) implies $12. A premium is only justified by superior growth/margins; otherwise it is multiple risk. Weighted just 10% so the market's mood does not drive the fair value.
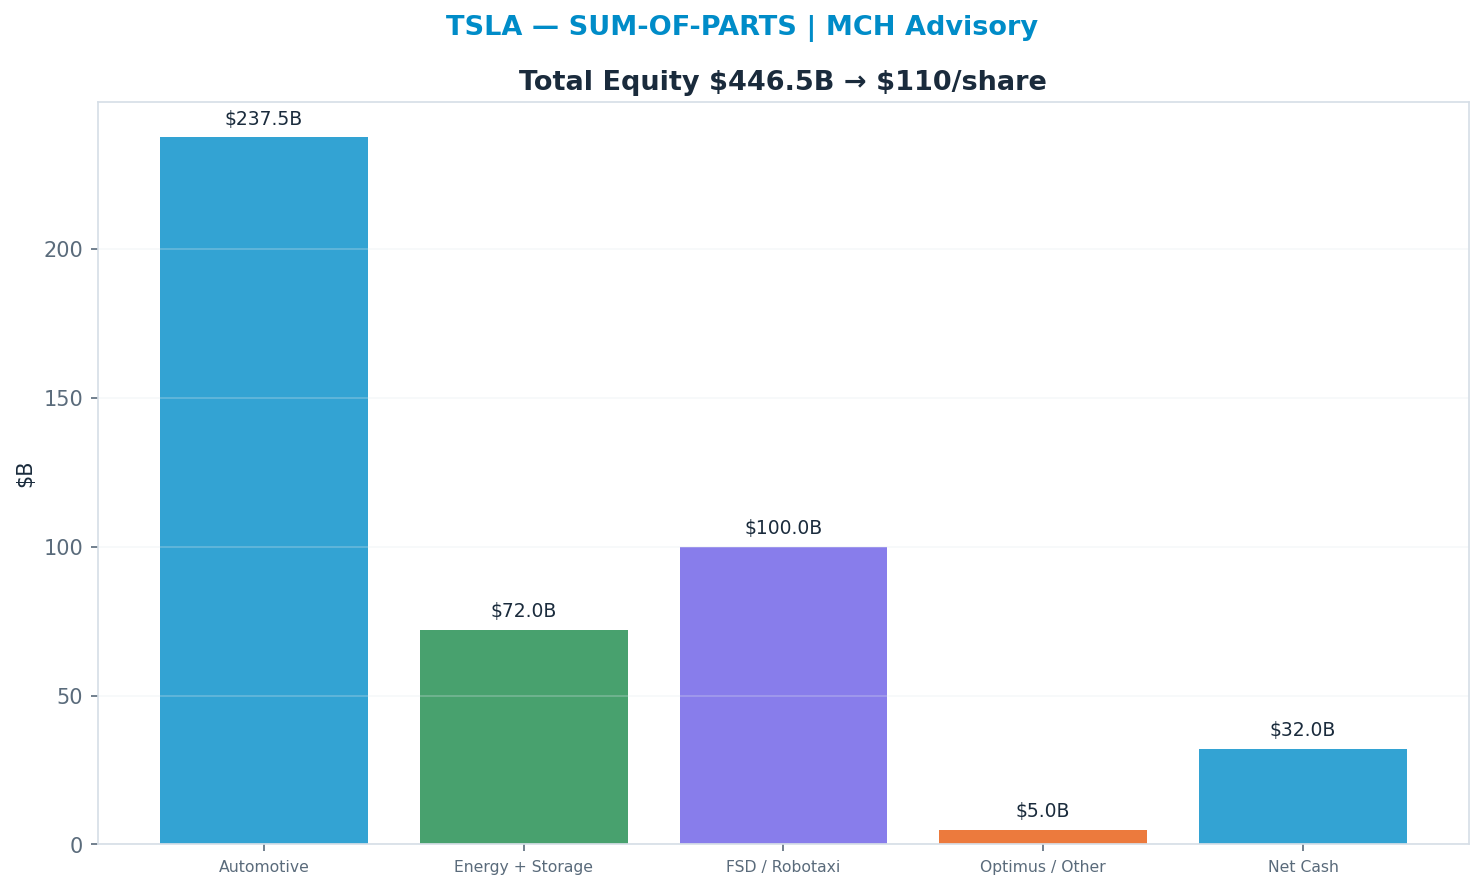
Sum-of-parts
Valuing each piece at the multiple it deserves (Automotive 2x, Energy + Storage 6x, FSD / Robotaxi 20x, Optimus / Other 10x) → $110. 'Automotive' dominates at 2.5× → $238B (57% of EV) — the segment whose multiple matters most.
Across all anchors the spread is wide (genuine disagreement — low valuation confidence).
Revenue-Segment Breakdown
The company-specific drivers behind the valuation — each segment carries its own growth, margin, multiple and capex intensity. (Tags: FACT reported · ESTIMATE from disclosures · INFERENCE judgment.)
| Segment | Revenue | Mix | Growth | Op margin | Multiple | Capex % | Tag |
|---|---|---|---|---|---|---|---|
| Automotive | $88B | 80% | 2% | 8% | 2.5x | 10% | FACT/ESTIMATE |
| Energy Generation & Storage | $15B | 14% | 40% | 12% | 5x | 8% | FACT/ESTIMATE |
| Services & Other | $11B | 10% | 20% | 5% | 2x | 3% | FACT/ESTIMATE |
| FSD / Robotaxi (autonomy) | $2B | 2% | 50% | 40% | 30x | 5% | INFERENCE |
| Optimus / other optionality | $0B | 0% | 0% | 0% | Nonex | 2% | INFERENCE |
AI revenue, decomposed — the AI lines broken out (Azure-AI / Copilot / model-API / pass-through style), so the AI contribution is auditable:
| AI line | Run-rate | Growth | Gross margin | Capex % | Tag |
|---|---|---|---|---|---|
| FSD software (recognised) | $2B | 30% | 85% | 5% | ESTIMATE |
| Robotaxi network | $0B | 0% | 0% | 20% | INFERENCE |
| Optimus (humanoid) | $0B | 0% | 0% | 10% | INFERENCE |
| Dojo / AI compute | $0B | 0% | 0% | 15% | INFERENCE |
- FSD software (recognised): High-margin, partly-recurring (subscription + deferred recognition on the installed base). The ONLY autonomy line with real revenue today; still small.
- Robotaxi network: PRE-REVENUE / SPECULATIVE. Network economics (per-mile take) are the bull's core driver of the implied value embedded in the ~180x multiple. Unproven at scale; gated on regulation, safety record and geographic rollout.
- Optimus (humanoid): PRE-REVENUE / SPECULATIVE. Production timeline and unit economics unproven. Value is a far-dated option, not a forecast.
- Dojo / AI compute: Internal training compute, NOT an external revenue line. Strategic input to FSD/Optimus, not a monetised product; cost centre today.
Named Exposures
Autonomy execution & valuation (INFERENCE)
| Dimension | Assessment |
|---|---|
| Option share of price | A large majority of the ~$376 is NOT explained by the auto + energy + services fundamentals; the residual is the autonomy/robotics option (est. well over half of equity value) |
| Auto-business implied value | Auto+energy+services on conservative OEM/industrial multiples support only a fraction of the market cap; the gap is the embedded Robotaxi/FSD/Optimus option |
| Execution risk | Robotaxi at scale, unsupervised FSD and Optimus are all unproven; each requires a step-change beyond current driver-assist capability |
| Regulatory / timeline risk | Unsupervised autonomy approval is state-by-state and NHTSA-gated; a single high-profile safety event can reset the timeline and re-rate the option toward zero |
| Sensitivity | Small changes in assumed robotaxi launch date, fleet size and per-mile take swing fair value dramatically — the valuation is option-like and path-dependent |
Auto demand, margin & key-man (FACT/ESTIMATE/INFERENCE)
| Dimension | Assessment |
|---|---|
| EV demand | Global EV demand growth has softened / matured; Tesla volume growth has stalled near flat after years of compounding |
| Price-war margin | Repeated price cuts compressed auto gross margin (ex-credits) to mid-teens from prior 25%+; further cuts trade margin for volume |
| Chinese competition | BYD and domestic Chinese OEMs undercut on price and out-iterate on models; share loss risk in China and EU |
| Regulatory credits | Declining regulatory-credit revenue removes a high-margin, non-operating earnings prop |
| Key-man / governance | Heavy dependence on Musk; compensation/governance disputes, attention split across ventures, and political-brand polarisation create demand and key-man risk not present at peer OEMs |
Industry Context — Autos & Autonomy
This name sits in the Autos & Autonomy as a EV maker + autonomy/robotics optionality. Two distinct drivers: (1) auto demand/margin (price war, BYD and Chinese OEM share gains, EV-credit and incentive roll-off compressing ASP and gross margin), and (2) the robotaxi/FSD option that dominates the valuation — a multi-hundred-billion-dollar slice of market cap that is contingent on FSD reaching genuine unsupervised autonomy and clearing regulators on a credible timeline. Bull if autonomy inflects and the option pays; bear if it slips or the auto base de-rates to a normal OEM multiple. Its scenarios are not guessed in isolation — they inherit a single, shared view of the cluster's driver cycle, so the names that depend on the same event are mutually consistent.
Value chain: TSLA (EV maker + autonomy/robotics optionality)
| Shared state | Capex path | House view | This name implies |
|---|---|---|---|
| Demand / Brand Collapse | EV demand stalls + brand/demand impairment | 25% | 20% |
| Auto Competition Squeeze | price war + BYD/Chinese OEM share loss | 22% | 20% |
| Base | auto stabilizes; autonomy progresses slowly | 33% | 30% |
| Autonomy Inflection | robotaxi scales + FSD unsupervised approval | 20% | 30% |
On the cluster's key downside — Demand / Brand Collapse (EV demand stalls + brand/demand impairment) — this name implies 20% vs the cluster house view of 25% (in line with the house). The cluster's full cross-stock reconciliation governs that the names which ride the same capex cycle assign it comparable odds.
Structure: Ev Demand Price — Global EV demand is decelerating off prior hyper-growth while price competition intensifies (Tesla price cuts, BYD and Chinese OEM share gains, incentive/credit roll-off). The auto business in isolation warrants a low, cyclical OEM-style multiple. (INFERENCE) Autonomy Option — Robotaxi/FSD is the swing factor: a high-payoff, low-base-rate option whose value hinges on FSD reaching true unsupervised autonomy, fleet economics actually closing, and regulators approving on a believable timeline. Largest source of both upside and timeline/regulatory risk. (INFERENCE) Energy Storage — Energy generation & storage (Megapack/Powerwall) is a real, faster-growing, structurally higher-margin pillar than autos, but too small today to anchor the valuation on its own. (FACT) Bimodal Valuation — The equity is bimodal: a cheap cyclical auto business stapled to an expensive autonomy/robotics call option. The market cap can only be reconciled by assigning most of it to the option, not the car company — so the stock trades on autonomy belief, not auto fundamentals. (INFERENCE)
Model Appendix
DCF — line items
| Year | Revenue | Op income | − Capex | + D&A | FCF | PV(FCF) |
|---|---|---|---|---|---|---|
| FY+1 | $115B | $9B | $10B | $10B | $8B | $7B |
| FY+2 | $133B | $13B | $12B | $11B | $10B | $8B |
| FY+3 | $149B | $18B | $13B | $11B | $13B | $9B |
| FY+4 | $164B | $23B | $15B | $12B | $17B | $11B |
| FY+5 | $177B | $27B | $16B | $13B | $19B | $11B |
| Terminal | — | — | — | — | $19B × 22x | $242B |
FCF is bridged: NOPAT + D&A − Capex − ΔNWC (capex intensity 9% of revenue, weighted from the segments) — not a single conversion fudge.
WACC 12.0% · Σ PV(FCF) $46B + PV(terminal) $242B = EV $288B; + net cash → equity $320B ÷ diluted shares 4.05B = $79/share (exit-multiple terminal).
- Gordon (perpetuity-growth) terminal at 2.5% → $49/share — a genuinely non-multiple, cash-based cross-check; the exit-multiple and Gordon values bracket the terminal-value risk.
- Incremental ROIC on the forecast capex ≈ 22% vs WACC 12% → above WACC — the build is value-creative.
Peer set
| Peer | EV/Rev | Fwd P/E | Growth | Op margin |
|---|---|---|---|---|
| F | 0.5x | 6x | 2% | 4% |
| GM | 0.5x | 6x | 3% | 6% |
| RIVN | 3.0x | -5x | 25% | -20% |
| UBER | 3.4x | 22x | 16% | 8% |
| Median | 1.75x | 6.0x | — | — |
Peer-median fwd P/E → $12; EV/Rev → $54.
Weighted fair-value math
| Anchor | Value | Weight | Contribution |
|---|---|---|---|
| Scenario PWEV | $375 | 62% | $235 |
| Monte Carlo median | $151 | 37% | $57 |
| Triangulated | — | 100% | $291 |
Sensitivity
DCF/share — WACC × terminal multiple
| WACC \ Term× | 15.4x | 18.7x | 22.0x | 25.3x | 28.6x |
|---|---|---|---|---|---|
| 10% | $66 | $76 | $85 | $95 | $105 |
| 11% | $63 | $73 | $82 | $92 | $101 |
| 12% | $61 | $70 | $79 | $88 | $97 |
| 13% | $59 | $68 | $76 | $85 | $93 |
| 14% | $57 | $65 | $73 | $82 | $90 |
DCF/share — revenue CAGR Δ × op-margin Δ
| CAGRΔ \ MgnΔ | -3.0pp | -1.5pp | +0.0pp | +1.5pp | +3.0pp |
|---|---|---|---|---|---|
| -3.0pp | $58 | $65 | $73 | $81 | $88 |
| -1.5pp | $60 | $68 | $76 | $84 | $92 |
| +0.0pp | $62 | $71 | $79 | $88 | $96 |
| +1.5pp | $64 | $73 | $82 | $92 | $101 |
| +3.0pp | $66 | $76 | $86 | $96 | $105 |
Tornado — DCF/share swing by driver (widest first)
| Driver | Low | High | Swing |
|---|---|---|---|
| Op margin ±3pp | $62 | $96 | $34 |
| Terminal × ±15% | $70 | $88 | $18 |
| Revenue CAGR ±3pp | $73 | $86 | $13 |
| WACC ±1pp | $76 | $82 | $6 |
| FCF conversion ±10% | $79 | $79 | $0 |
Company lever — SoP/share vs Automotive multiple (AI re-rating) (base 2.5x)
| Multiple | 1.8x | 2.1x | 2.5x | 2.9x | 3.2x |
|---|---|---|---|---|---|
| SoP/share | $92 | $100 | $109 | $118 | $125 |
Load-Bearing Assumptions
DCF: WACC 12%, terminal multiple 22×, FY+5 revenue $177B. Triangulation leans 35% on DCF, 25% on PWEV.
Reasons the Thesis Could Fail (Falsifiable)
P(>current)=8.4% below 30% band — bear weighting or opex may be too severe; verify. A miss on Gross Margin drops the case toward the structural target $200.
Fact / Inference / Speculation
- FACT: Spot $421; 52-week range $289–$499; engine rating HOLD; base-case target $414 (-2%).
- INFERENCE: Triangulated FV $291 (-31%). Gross Margin explains 58% of Monte Carlo outcome variance — the single variable that decides which side is right.
- SPECULATION: At current prices the embedded bet is that Gross Margin surprises to the upside — Gross Margin carries 58% of outcome variance.
Recommendation: HOLD
Balanced: triangulated fair value $162 (-61% vs spot); the outcome hinges on Gross Margin. The debate is Gross Margin (58% of variance) — a fundamental call. SBC runs 2100M TTM (disclosed in the appendix).