Rating: HOLD
| Metric | Value |
|---|---|
| Current Price | $289 |
| Triangulated Fair Value | $223 |
| 12-mo Scenario PWEV | $270 |
| Implied Return | -23% |
| Forward P/E | 34.0x |
| Market Cap | $4.28T |
| 52-Week Range | $185 – $305 |
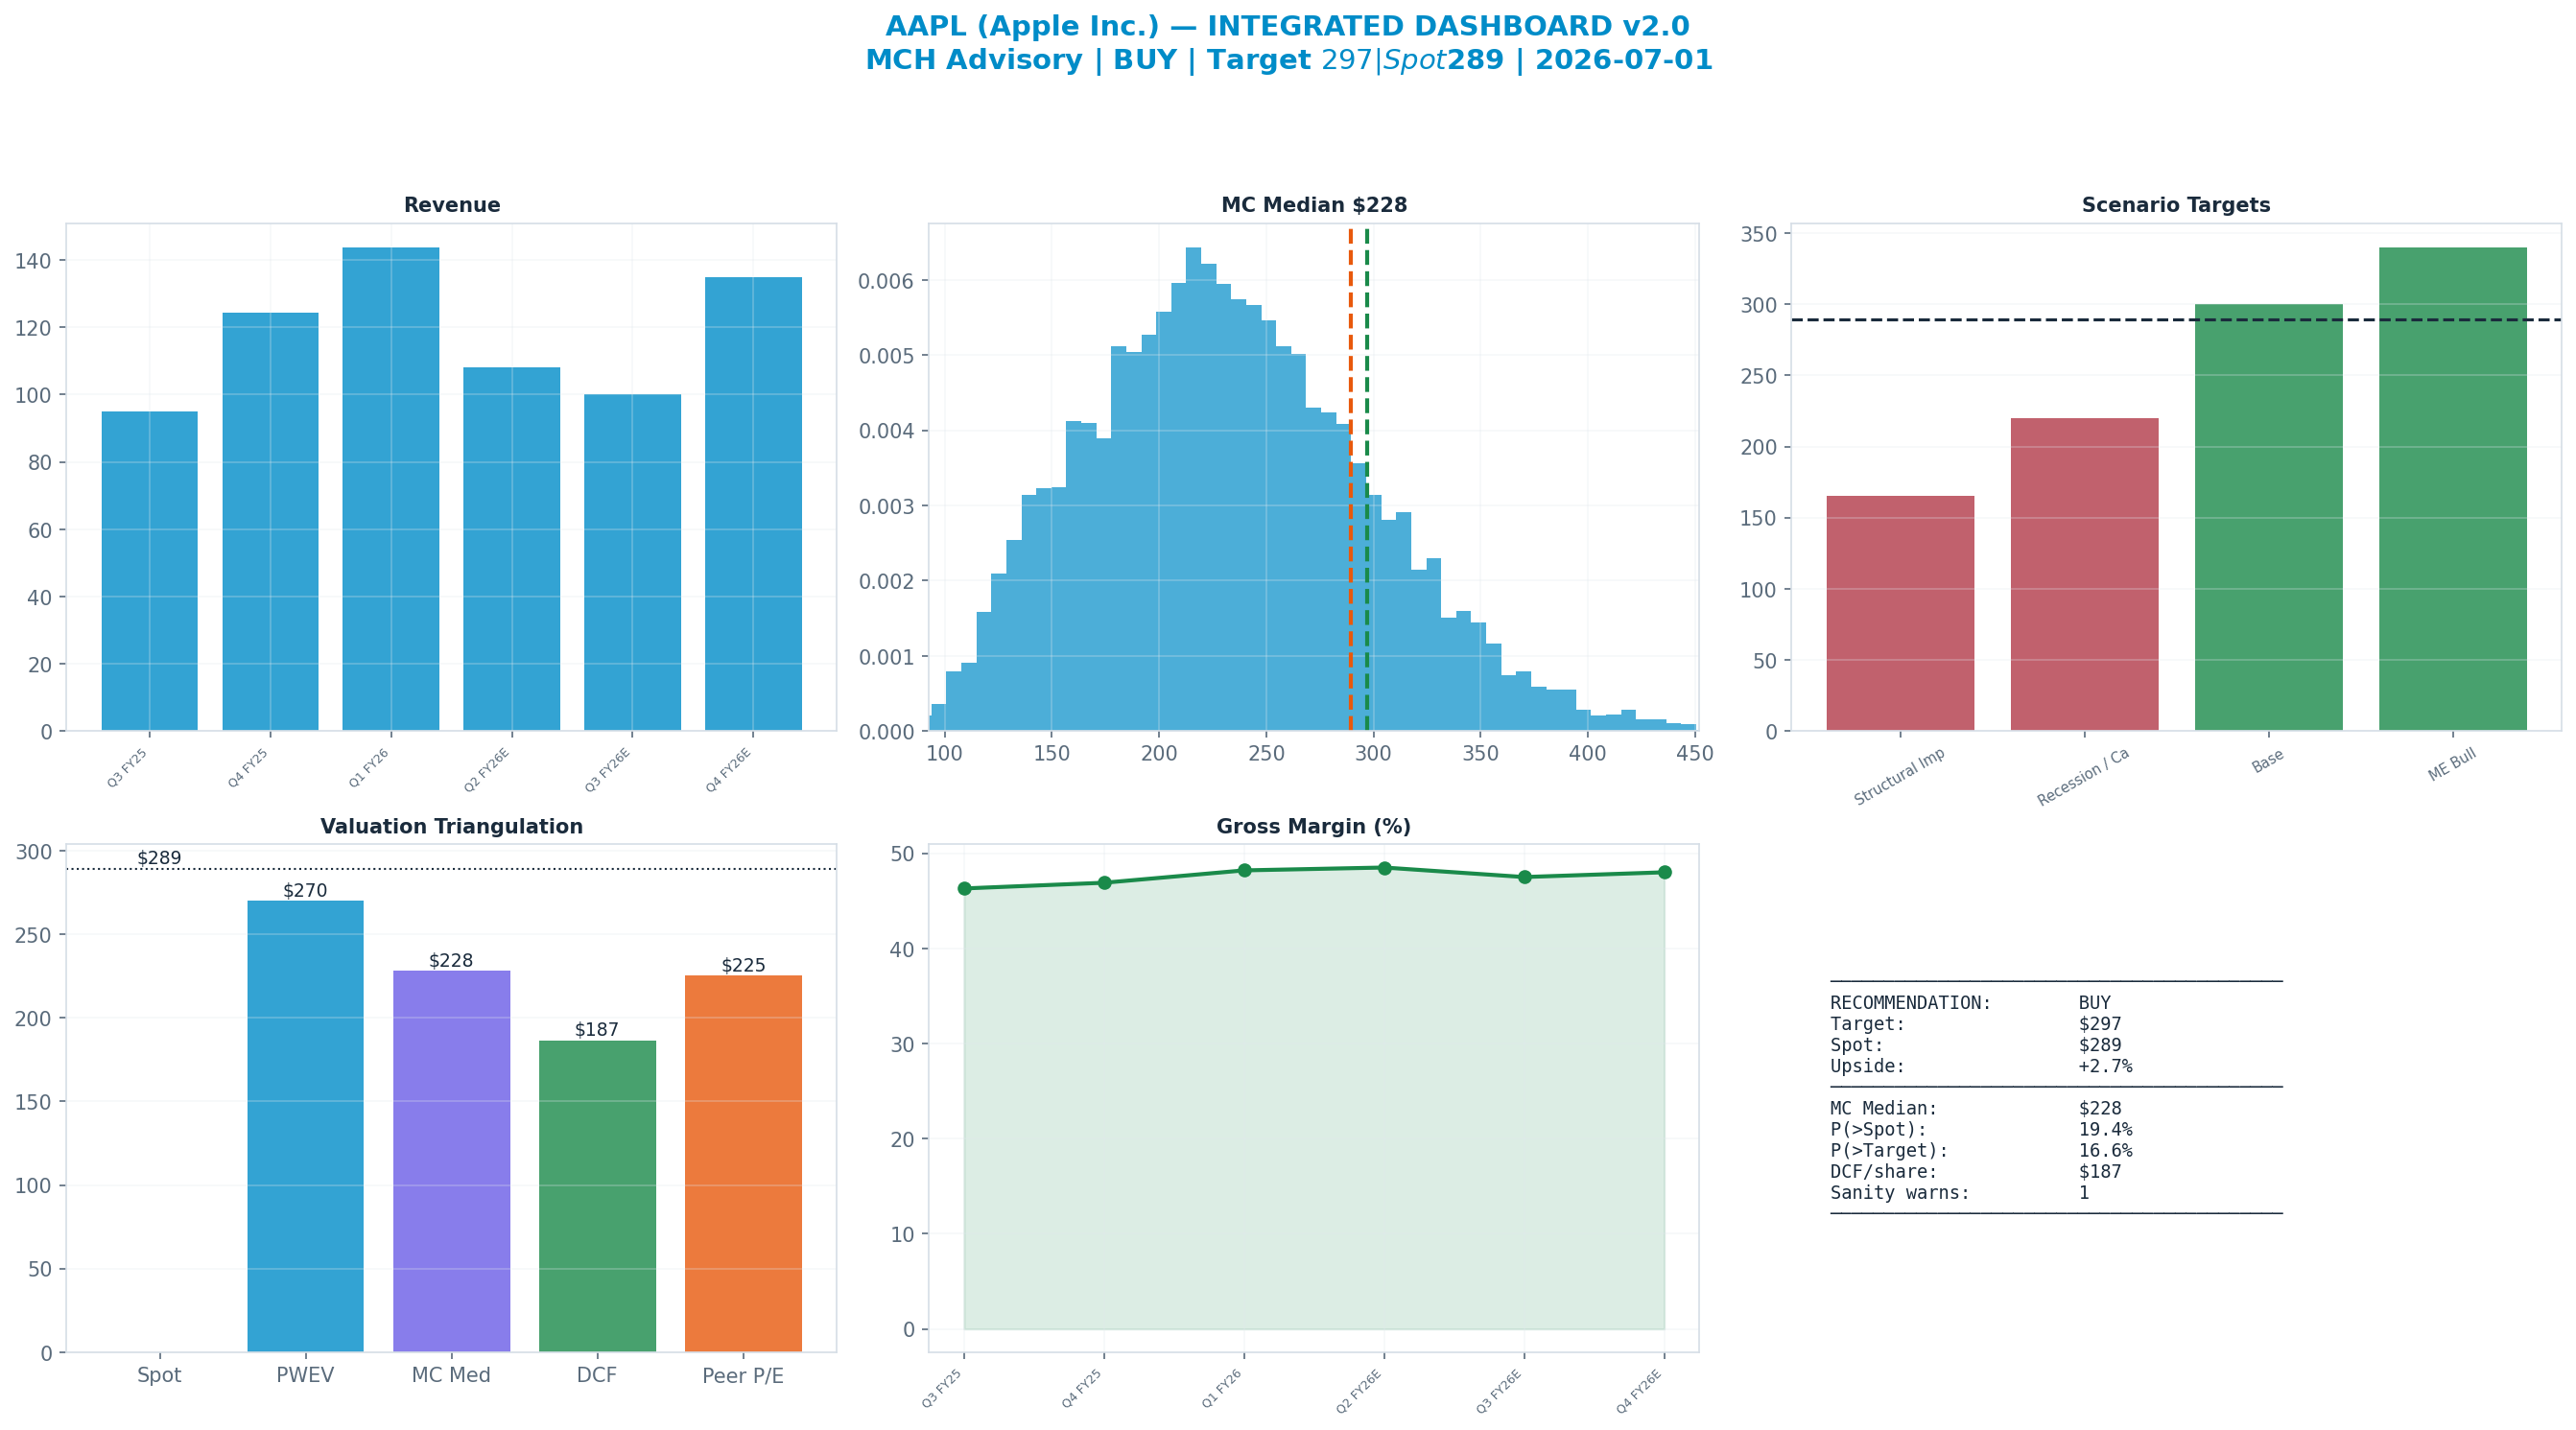
Methodology: Valuation triangulated across five independent anchors — Monte Carlo (Student-t + regime switching), an independent DCF, peer re-rating, a sum-of-parts, and a scenario-weighted PWEV. Figures reconciled to mch_weekly_run live prices. Each chart below sits with the part of the thesis it evidences.
Investment Thesis
The bull case — 'ME Bull' (30% weight) — targets $340, +18% vs spot. It needs the multiple to hold or expand.
The dashboard below is the whole argument on one page: spot ($289) against each valuation anchor, the scenario tree, technicals and the options-implied move.
Anti-Thesis (The Real Bear Case)
The structural case — 'Structural Impairment' (20%) — targets $165, -43% vs spot. This sits below the 52-week low — a genuine structural impairment, not a mild pullback.
Key Debate
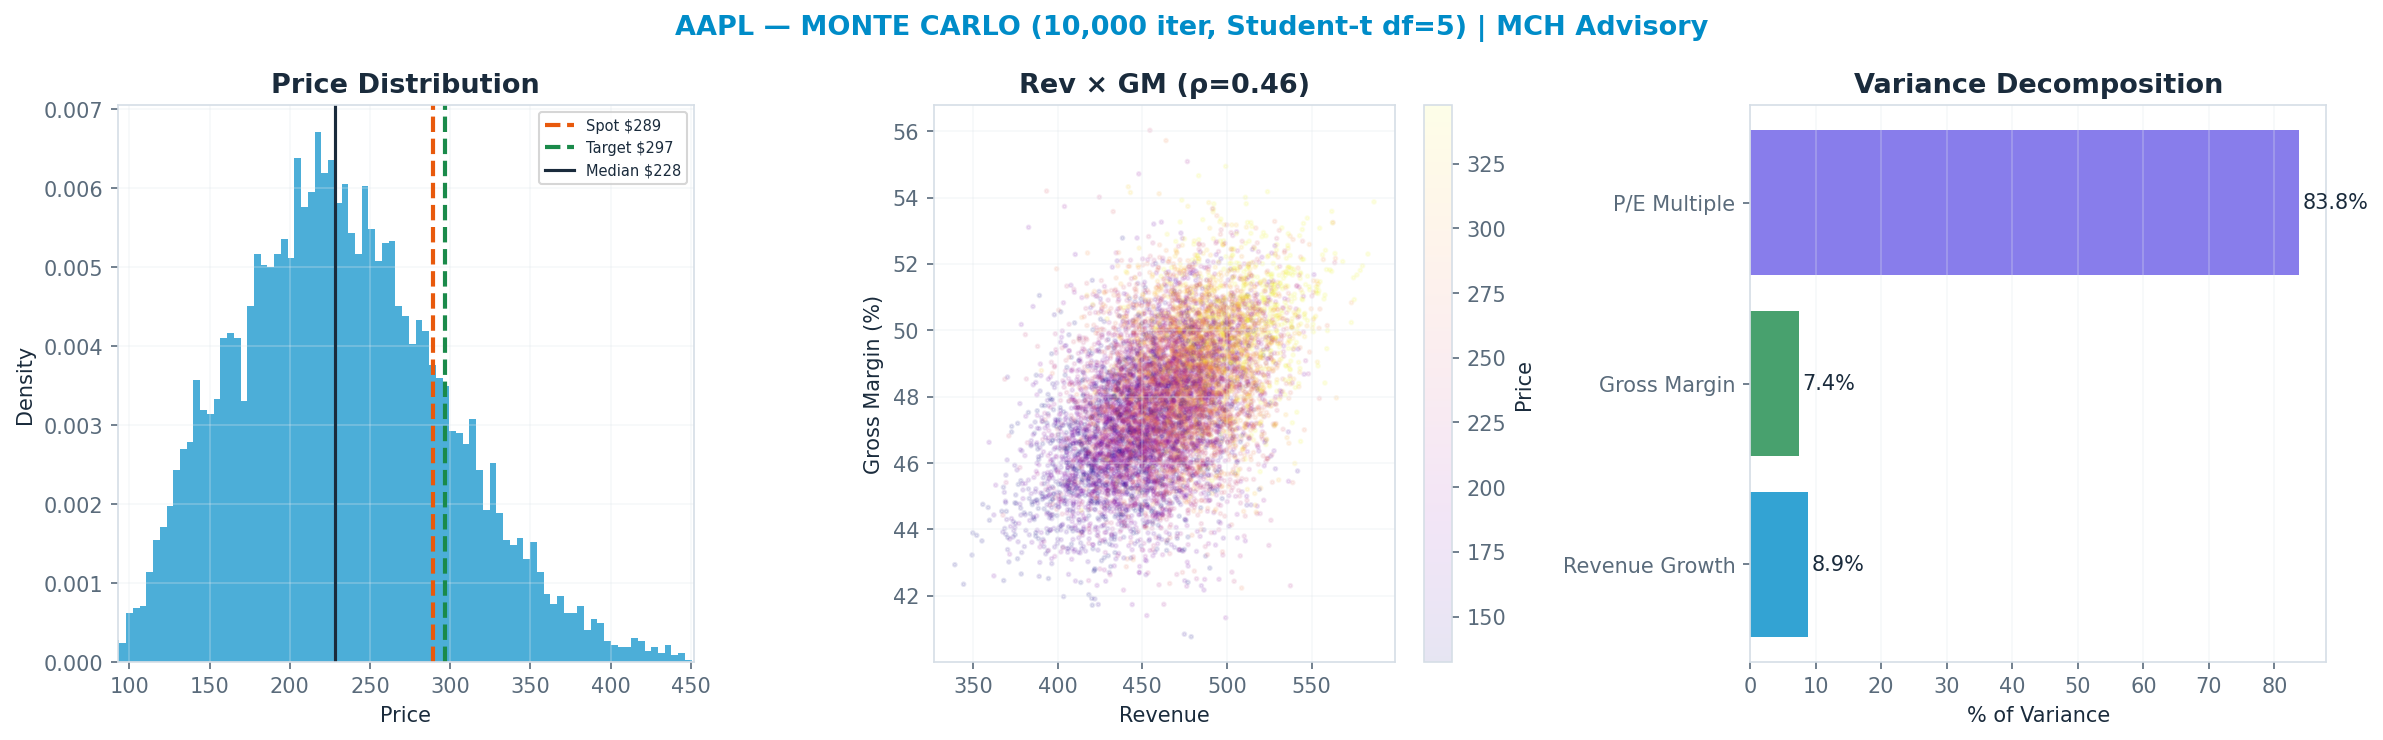
P/E Multiple explains 84% of Monte Carlo outcome variance — i.e. value is set by the multiple the market will pay, a rate/sentiment regime bet as much as an earnings bet.
Earnings-Call Disconfirmation & Sentiment
Derived signals from the MCH market-data store (Alpha Vantage transcripts + news). Quantitative tone only — a disconfirmation flag, not a substitute for reading the call.
Management vs analyst tone (2026Q2): management +0.29 vs analyst floor +0.00 → delta +0.29 (n=33 mgmt / 16 Q&A; 31th pctile across the S&P book, z -0.6).
Flag: TYPICAL — management-vs-analyst tone within the normal cross-sectional range.
| Quarter | Mgmt | Analyst | Delta |
|---|---|---|---|
| 2026Q2 | +0.29 | +0.00 | +0.29 |
| 2026Q1 | +0.47 | +0.08 | +0.38 |
| 2025Q4 | +0.34 | +0.34 | -0.00 |
| 2025Q3 | +0.41 | +0.22 | +0.19 |
News (last 365d, 1005 articles): avg ticker sentiment +0.08 (bullish 9% / bearish 7%)
Scenario Analysis
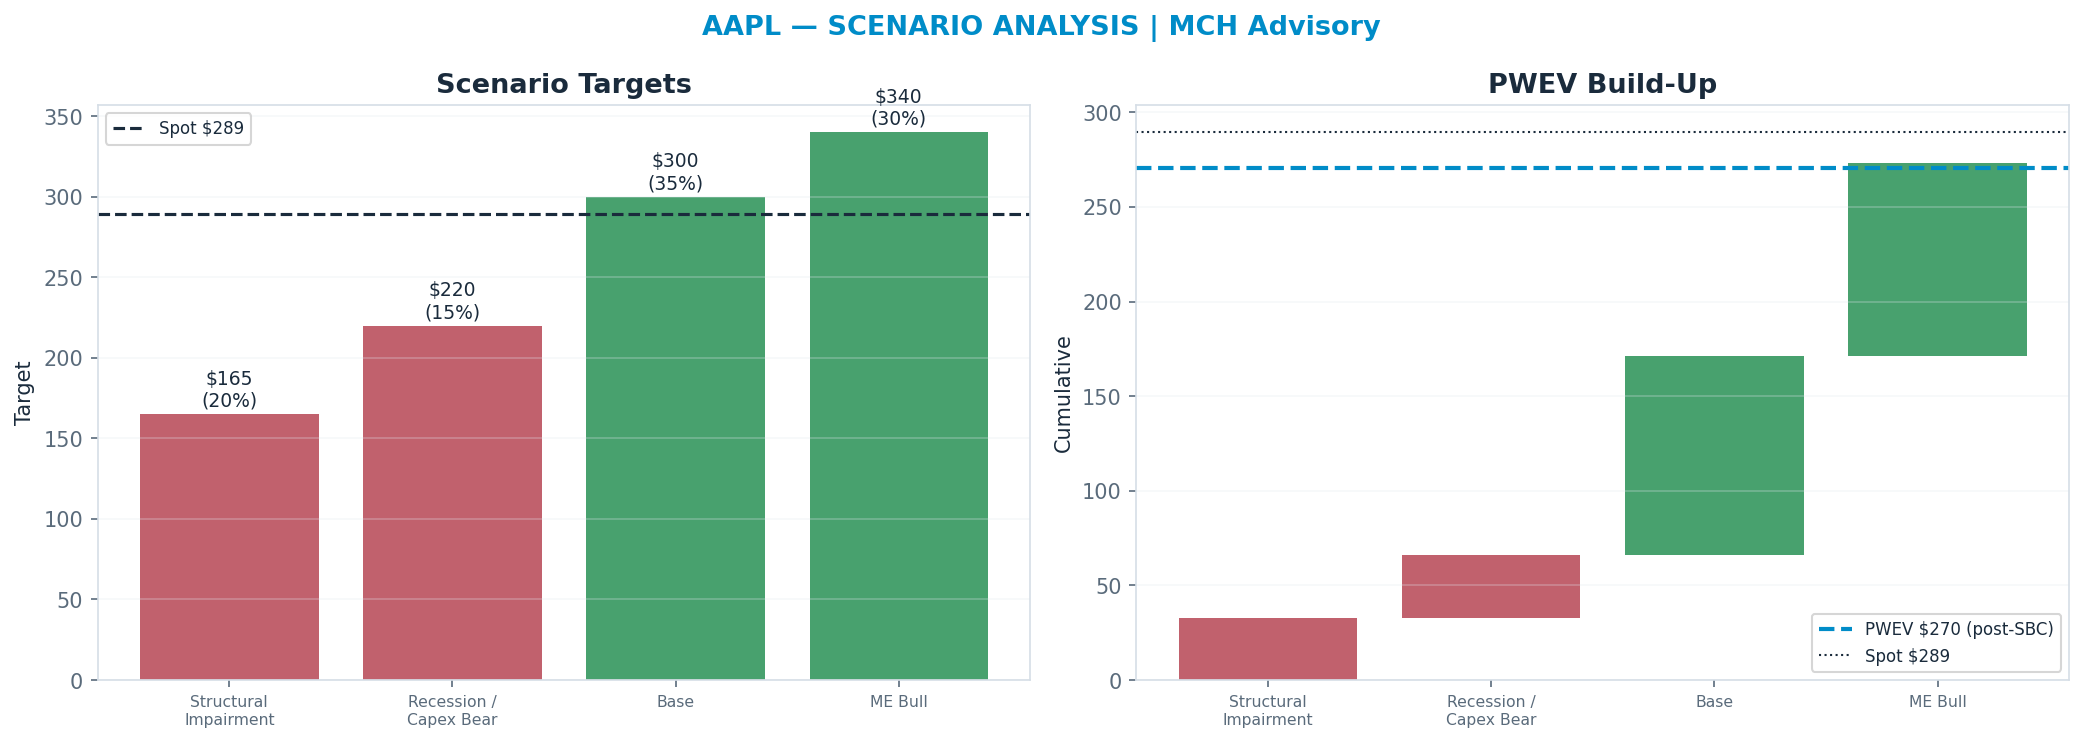
The tree runs from a structural 'Structural Impairment' downside ($165) to a 'ME Bull' bull case ($340); the probability-weighted blend (PWEV $270) is -7% versus spot.
| Scenario | Probability | Target | Return |
|---|---|---|---|
| Structural Impairment | 20% | $165 | -43% |
| Recession / Capex Bear | 15% | $220 | -24% |
| Base | 35% | $300 | +4% |
| ME Bull | 30% | $340 | +18% |
| Probability-Weighted (PWEV, after SBC dilution) | — | $270 | -7% |
SBC charge: scenario targets are gross per-share prices; the PWEV is reduced by one year of stock-based-compensation dilution (1.0% of shares, on SBC ≈ 3% of revenue), trimming the gross PWEV of $273 to $270 (-1.0%). SBC is charged once, as dilution — never also deducted from FCF.
Scenario rationale — what each probability buys (the driver path behind every target):
- Structural Impairment (20%, $165). Antitrust kills the ~$20B+ Google payment and DMA-style commission erosion spreads beyond the EU, gutting high-margin Services growth just as iPhone units stall on a weak China and no AI supercycle. Services growth halves, blended op margin compresses, and the premium Services-led multiple de-rates toward a hardware multiple ~10x. Target sits below the 52-week low - a genuine structural break, not a dip. Drivers — iphone_units: declining; services_growth: ~5%; op_margin: ~27%; multiple: ~10x.
- Recession / Capex Bear (15%, $220). Consumer-spending recession lengthens the upgrade cycle and pressures iPhone/Wearables units; Services growth decelerates to high-single-digits on softer App Store and ad spend. Margins hold up better than hardware peers but the multiple stays capped ~14x as the market waits for an AI-led unit catalyst that has not arrived. Drivers — iphone_units: flat-to-down; services_growth: ~8%; op_margin: ~29%; multiple: ~14x.
- Base (35%, $300). iPhone units are roughly flat on a stable installed base with modest ASP mix, while Services compounds low-double-digits on App Store, licensing, ads and subscriptions - the re-rating engine. Blended margin holds ~31% as the Services mix lifts; the multiple normalises to ~18x on durable Services growth and a still-intact Google payment. Drivers — iphone_units: flat; services_growth: ~12%; op_margin: ~31%; multiple: ~18x.
- ME Bull (30%, $340). Apple Intelligence drives a measurable upgrade cycle that lifts iPhone units and ASP, Services accelerates toward mid-teens on ads + a paid AI/cloud tier, and a Gemini-style licensing deal flips Apple toward platform-distribution economics. Operating leverage expands margins and the Services-led multiple re-rates to ~24x. Drivers — iphone_units: up (AI-led); services_growth: ~15%; op_margin: ~33%; multiple: ~24x.
Valuation Triangulation
Five anchors — but read them with their basis in mind. The Monte Carlo, the DCF terminal, and the peer re-rate all key off a market multiple, so they are not fully independent; only the discounted cash flows themselves are genuinely multiple-free. The discipline is to read the spread and weight the cash-based view, not to treat five numbers as five independent votes.
| Method | Basis | Fair Value | vs Spot |
|---|---|---|---|
| Monte Carlo median (Student-t + regime) | multiple | $228 | -21% |
| Peer P/E re-rate | multiple | $225 | -22% |
| Peer EV/Revenue re-rate | multiple | $236 | -19% |
| Scenario PWEV | multiple | $270 | -7% |
| DCF (5-year + terminal) | cash flow + terminal × | $187 | -36% |
| Triangulated (weighted) | — | $223 | -23% |
Rating vs blend — the key debate. The rating tracks the multiple-discipline fair value (Monte Carlo $228 + scenario PWEV $270, ≈ spot); the weighted blend $223 (-23%) sits below it because the cash-flow DCF ($187) is materially more conservative than the market multiple. Whether the current multiple is justified is the central question for this name — and the principal downside risk to the rating.
Monte Carlo — the distribution, not a point
10,000 paths, Student-t shocks (fat tails) with a regime-switching overlay. The median lands at $228 and 19% of paths finish above spot. The variance decomposition shows the p/e multiple is the dominant swing factor (84% of variance). Value is a multiple bet: fundamentals move the answer far less than the rating does.
DCF — the cash-flow anchor
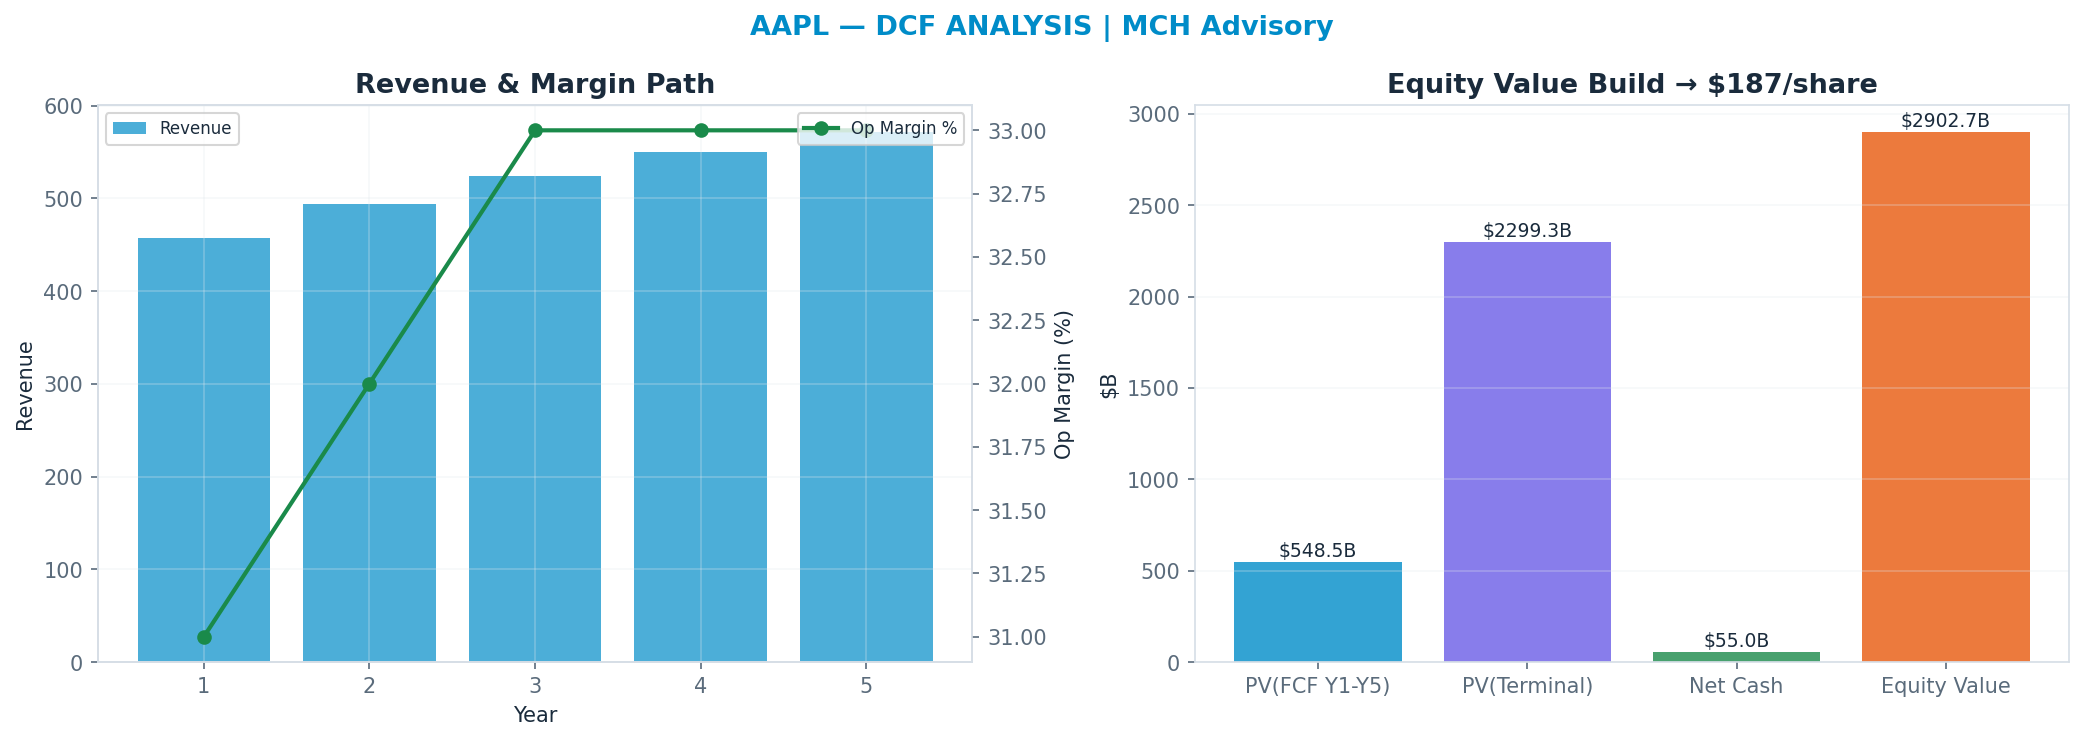
Independent of the market multiple: a 5-year path, WACC 8.5%, 22x terminal FCF multiple → $187. This anchor is deliberately the heaviest (41%): it is the valuation least hostage to the current multiple regime.
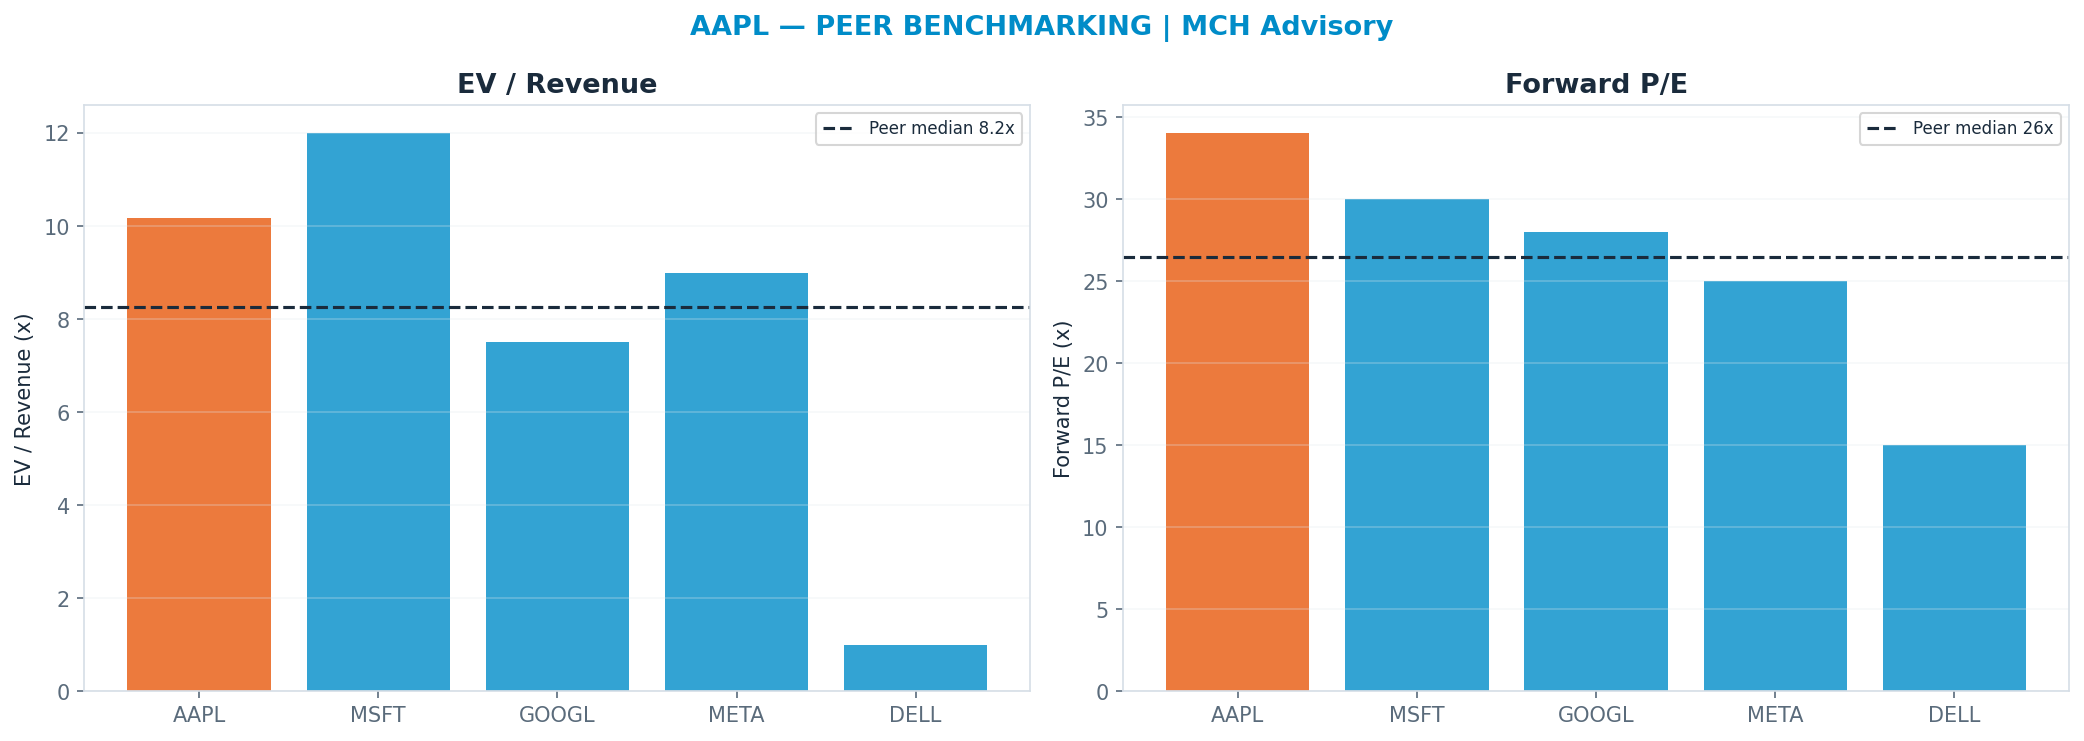
Peer benchmarking — relative value
Against the peer cohort, re-rating to the peer-median forward multiple (P/E 26.5x) implies $225. A premium is only justified by superior growth/margins; otherwise it is multiple risk. Weighted just 12% so the market's mood does not drive the fair value.
Across all anchors the spread is tight (the methods corroborate one another).
Revenue-Segment Breakdown
The company-specific drivers behind the valuation — each segment carries its own growth, margin, multiple and capex intensity. (Tags: FACT reported · ESTIMATE from disclosures · INFERENCE judgment.)
| Segment | Revenue | Mix | Growth | Op margin | Multiple | Capex % | Tag |
|---|---|---|---|---|---|---|---|
| iPhone | $210B | 49% | 2% | 35% | 12x | 2% | FACT/ESTIMATE |
| Services | $110B | 26% | 12% | 70% | 28x | 3% | FACT/ESTIMATE |
| Wearables, Home & Accessories | $38B | 9% | -1% | 33% | 9x | 2% | FACT/ESTIMATE |
| Mac | $32B | 7% | 3% | 32% | 9x | 2% | FACT/ESTIMATE |
| iPad | $28B | 6% | 1% | 31% | 8x | 2% | FACT/ESTIMATE |
AI revenue, decomposed — the AI lines broken out (Azure-AI / Copilot / model-API / pass-through style), so the AI contribution is auditable:
| AI line | Run-rate | Growth | Gross margin | Capex % | Tag |
|---|---|---|---|---|---|
| Apple Intelligence (direct) | $0B | 0% | 0% | 0% | FACT |
| iPhone upgrade-cycle pull-through | $0B | 0% | 35% | 2% | INFERENCE |
| Google Gemini / model licensing inflow | $0B | 0% | 90% | 0% | INFERENCE |
| Services pull-through (AI-adjacent) | $0B | 0% | 70% | 3% | INFERENCE |
- Apple Intelligence (direct): FACT: Apple Intelligence generates NO direct revenue today. Offered free on supported devices; no paid AI tier disclosed. Immaterial to the model.
- iPhone upgrade-cycle pull-through: INFERENCE: thesis that AI features shorten the upgrade cycle and lift iPhone units/ASP. No evidence of a measurable supercycle yet; flagged as catalyst, not booked revenue.
- Google Gemini / model licensing inflow: INFERENCE/SPECULATION: reported talks to embed a third-party frontier model (e.g. Gemini) for Siri. Could flip Apple from payer to recipient of platform-distribution economics, but no signed terms or disclosed revenue. Speculative.
- Services pull-through (AI-adjacent): INFERENCE: any AI monetization would most plausibly arrive inside Services (subscriptions, cloud compute tier, search/ads), NOT as a standalone line. Currently $0; shown for transparency, not additive.
Named Exposures
Greater China (FACT/ESTIMATE/INFERENCE)
| Dimension | Assessment |
|---|---|
| Revenue share | ~17-19% of total revenue from Greater China (FACT, FY disclosure) |
| Competitive pressure | Huawei resurgence + domestic premium share gains pressuring iPhone units (ESTIMATE/INFERENCE) |
| Regulatory risk | Government-device restrictions and local-content / data-localization rules; Apple Intelligence not yet cleared with a local LLM partner in China (INFERENCE) |
| Supply-chain concentration | Majority of final assembly still China-centric; India/Vietnam diversification underway but multi-year (ESTIMATE) |
| Tariff exposure | US-China tariff regime a swing factor on COGS and pricing (INFERENCE) |
Google TAC / Services concentration & regulatory (ESTIMATE/INFERENCE)
| Dimension | Assessment |
|---|---|
| Google search-default payment | ~$20B+/yr from Google to be the default Safari search engine (ESTIMATE) - high-margin, near pure-profit Services inflow |
| Antitrust risk | US v. Google remedies could curtail or ban the default-payment arrangement; a direct, high-incremental-margin Services hit (INFERENCE) |
| Services margin sensitivity | Loss of the Google payment would dent Services op margin disproportionately given ~0 associated cost (INFERENCE) |
| App Store / DMA pressure | EU DMA forces sideloading, alternative app stores and steering; commission erosion risk in EU, with read-through to other jurisdictions (ESTIMATE/INFERENCE) |
| Concentration | Services re-rating depends on App Store + licensing economics that are the explicit target of regulators (INFERENCE) |
Industry Context — Consumer Hardware & Services
This name sits in the Consumer Hardware & Services as a consumer hardware + services ecosystem. Outcome is driven by the iPhone replacement cycle (units/ASP into a mature installed base), Services growth and margin (the re-rate driver — App Store, licensing, cloud), China demand and regulatory risk, and the (today immaterial) Apple Intelligence AI catalyst that could pull forward an upgrade cycle without yet being a revenue line. Its scenarios are not guessed in isolation — they inherit a single, shared view of the cluster's driver cycle, so the names that depend on the same event are mutually consistent.
Value chain: AAPL (consumer hardware + services ecosystem)
| Shared state | Capex path | House view | This name implies |
|---|---|---|---|
| Structural / China Hit | iPhone share loss in China (Huawei/regulatory) + Services hit from Google TAC removal / DMA | 22% | 20% |
| Cyclical Slowdown | soft consumer / elongated replacement cycle; Services grows but decelerates | 20% | 15% |
| Base | stable iPhone units/ASP; Services compounds double-digit; China and regulatory contained | 38% | 35% |
| Services + AI Re-rate | Apple Intelligence sparks an upgrade super-cycle; Services margin/mix re-rate | 20% | 30% |
On the cluster's key downside — Structural / China Hit (iPhone share loss in China (Huawei/regulatory) + Services hit from Google TAC removal / DMA) — this name implies 20% vs the cluster house view of 22% (in line with the house). The cluster's full cross-stock reconciliation governs that the names which ride the same capex cycle assign it comparable odds.
Structure: Replacement Cycle — Smartphone demand is mature: the installed base is enormous (~1.4bn+ active iPhones) but elongating replacement intervals cap unit growth, leaving ASP, mix, and the catalyst for an upgrade wave as the swing variables. (INFERENCE) Services Flywheel — Services (App Store, licensing, iCloud, ads, payments) is the high-margin engine and the multiple driver — but it is regulatory-exposed via Google TAC (the ~$20bn+ Google search default payment at risk in antitrust remedies) and the EU DMA (sideloading, alternative app stores, anti-steering). (FACT) China Concentration — China is a double concentration: a large share of demand AND the bulk of assembly, so it carries both consumer-demand softness/Huawei share loss and regulatory/geopolitical (tariff, restriction) tail risk. (INFERENCE) Ai Catalyst — Apple Intelligence is an upgrade catalyst, not a revenue line: success is measured by whether on-device AI features pull forward hardware replacement, not by direct monetization — execution to date has lagged peers, so it is optionality, not a base-case driver. (INFERENCE)
Model Appendix
DCF — line items
| Year | Revenue | Op income | − Capex | + D&A | FCF | PV(FCF) |
|---|---|---|---|---|---|---|
| FY+1 | $458B | $142B | $10B | $10B | $119B | $110B |
| FY+2 | $494B | $158B | $11B | $10B | $132B | $112B |
| FY+3 | $524B | $173B | $12B | $11B | $144B | $113B |
| FY+4 | $550B | $182B | $12B | $11B | $151B | $109B |
| FY+5 | $572B | $189B | $13B | $12B | $157B | $105B |
| Terminal | — | — | — | — | $157B × 22x | $2299B |
FCF is bridged: NOPAT + D&A − Capex − ΔNWC (capex intensity 2% of revenue, weighted from the segments) — not a single conversion fudge.
WACC 8.5% · Σ PV(FCF) $548B + PV(terminal) $2299B = EV $2848B; + net cash → equity $2903B ÷ diluted shares 15.55B = $187/share (exit-multiple terminal).
- Gordon (perpetuity-growth) terminal at 2.5% → $154/share — a genuinely non-multiple, cash-based cross-check; the exit-multiple and Gordon values bracket the terminal-value risk.
- Incremental ROIC on the forecast capex ≈ 67% vs WACC 8% → above WACC — the build is value-creative.
Peer set
| Peer | EV/Rev | Fwd P/E | Growth | Op margin |
|---|---|---|---|---|
| MSFT | 12.0x | 30x | 16% | 45% |
| GOOGL | 7.5x | 28x | 14% | 32% |
| META | 9.0x | 25x | 20% | 42% |
| DELL | 1.0x | 15x | 5% | 9% |
| Median | 8.25x | 26.5x | — | — |
Peer-median fwd P/E → $225; EV/Rev → $236.
Weighted fair-value math
| Anchor | Value | Weight | Contribution |
|---|---|---|---|
| DCF | $187 | 41% | $77 |
| Scenario PWEV | $270 | 29% | $79 |
| Monte Carlo median | $228 | 18% | $40 |
| Peer P/E | $225 | 12% | $27 |
| Triangulated | — | 100% | $223 |
Sensitivity
DCF/share — WACC × terminal multiple
| WACC \ Term× | 15.4x | 18.7x | 22.0x | 25.3x | 28.6x |
|---|---|---|---|---|---|
| 6% | $154 | $179 | $203 | $227 | $252 |
| 8% | $148 | $171 | $195 | $218 | $241 |
| 8% | $142 | $164 | $187 | $209 | $231 |
| 10% | $137 | $158 | $179 | $200 | $221 |
| 10% | $131 | $152 | $172 | $192 | $212 |
DCF/share — revenue CAGR Δ × op-margin Δ
| CAGRΔ \ MgnΔ | -3.0pp | -1.5pp | +0.0pp | +1.5pp | +3.0pp |
|---|---|---|---|---|---|
| -3.0pp | $150 | $157 | $165 | $172 | $180 |
| -1.5pp | $160 | $168 | $175 | $183 | $191 |
| +0.0pp | $170 | $178 | $187 | $195 | $203 |
| +1.5pp | $180 | $189 | $198 | $207 | $216 |
| +3.0pp | $192 | $201 | $211 | $220 | $230 |
Tornado — DCF/share swing by driver (widest first)
| Driver | Low | High | Swing |
|---|---|---|---|
| Revenue CAGR ±3pp | $165 | $211 | $46 |
| Terminal × ±15% | $164 | $209 | $44 |
| Op margin ±3pp | $170 | $203 | $34 |
| WACC ±1pp | $179 | $195 | $16 |
| FCF conversion ±10% | $187 | $187 | $0 |
Company lever — SoP/share vs Services multiple (AI re-rating) (base 28x)
| Multiple | 19.6x | 23.8x | 28.0x | 32.2x | 36.4x |
|---|---|---|---|---|---|
| SoP/share | $377 | $409 | $440 | $471 | $502 |
Load-Bearing Assumptions
DCF: WACC 8%, terminal multiple 22×, FY+5 revenue $572B. Triangulation leans 41% on DCF, 29% on PWEV.
Reasons the Thesis Could Fail (Falsifiable)
P(>current)=19.4% below 30% band — bear weighting or opex may be too severe; verify. The valuation is multiple-dependent (84% of variance); a de-rating toward the DCF anchor ($187) implies -36%.
Fact / Inference / Speculation
- FACT: Spot $289; 52-week range $185–$305; engine rating HOLD; base-case target $297 (+3%).
- INFERENCE: Triangulated FV $223 (-23%). P/E Multiple explains 84% of Monte Carlo outcome variance — i.e. value is set by the multiple the market will pay, a rate/sentiment regime bet as much as an earnings bet.
- SPECULATION: At current prices the embedded bet is that the multiple holds or expands — P/E Multiple carries 84% of outcome variance.
Recommendation: HOLD
Balanced: triangulated fair value $223 (-23% vs spot); the outcome hinges on P/E Multiple. The debate is P/E Multiple (84% of variance) — fundamentally a multiple/regime call. SBC runs 12500M TTM (disclosed in the appendix).