Rating: HOLD
| Metric | Value |
|---|---|
| Current Price | $72 |
| Triangulated Fair Value | $70 |
| 12-mo Scenario PWEV | $85 |
| Implied Return | -2% |
| Forward P/E | 21.5x |
| Market Cap | $147B |
| 52-Week Range | $67 – $102 |
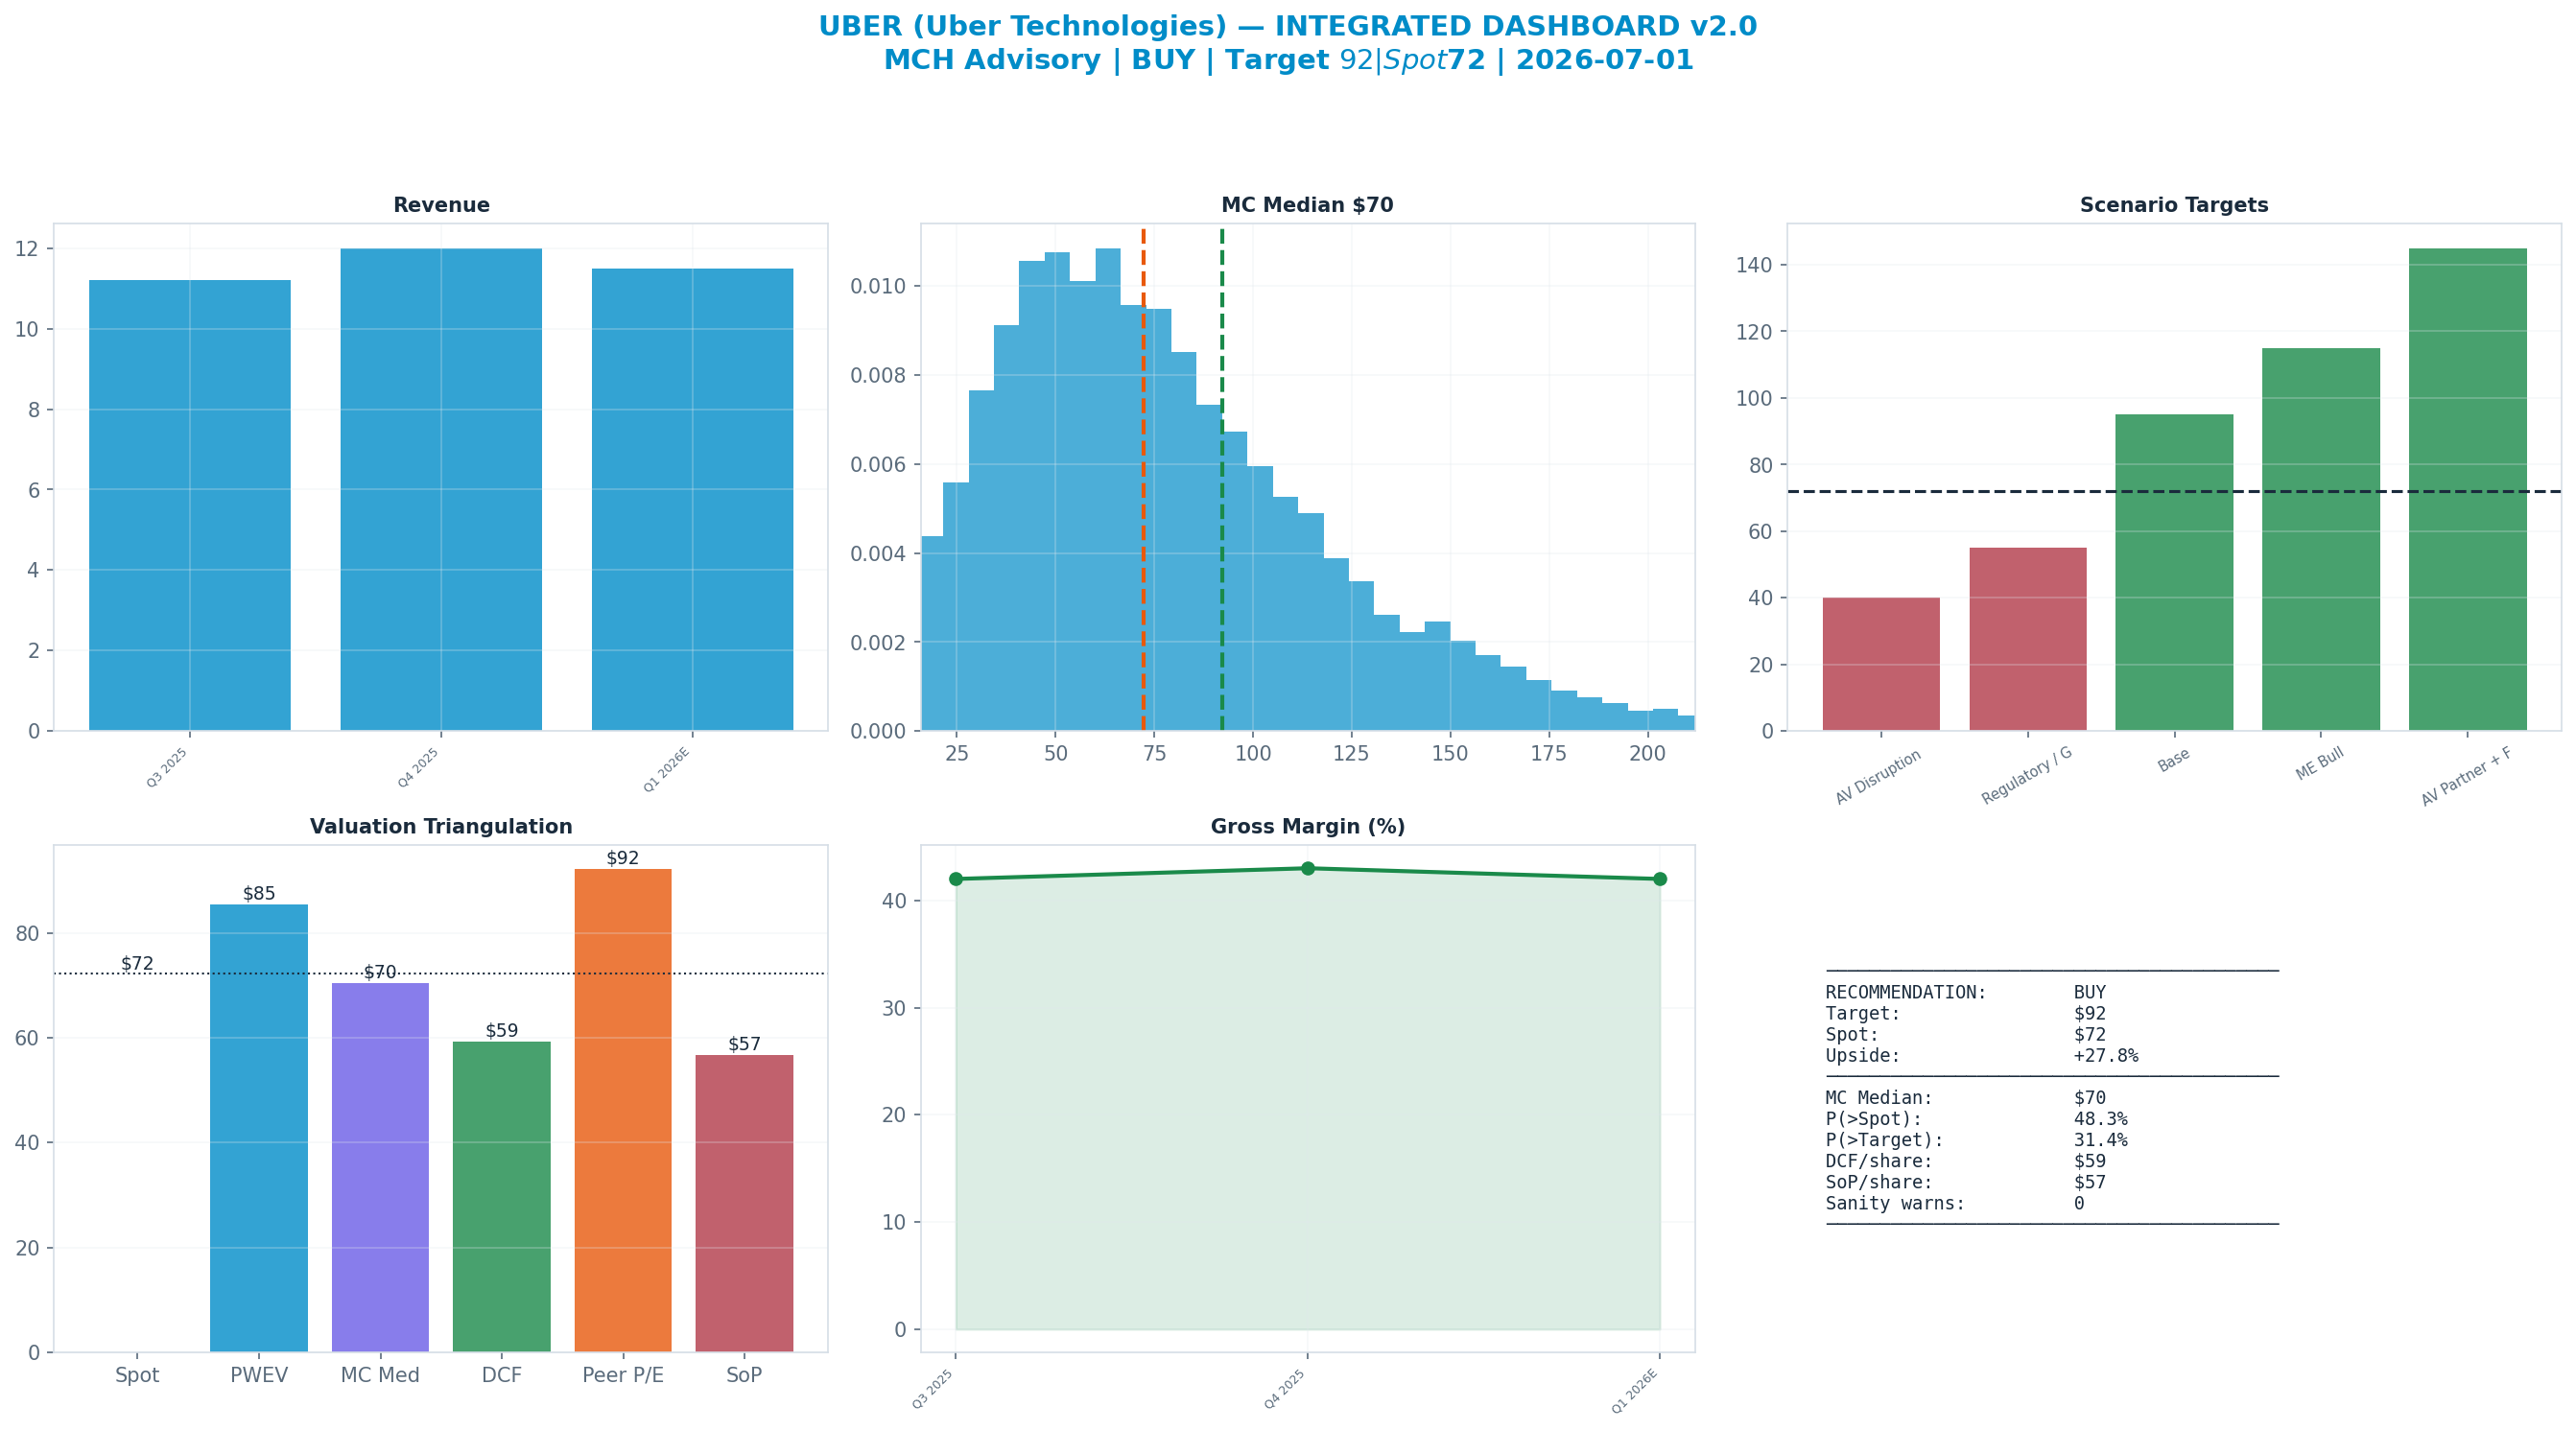
Methodology: Valuation triangulated across five independent anchors — Monte Carlo (Student-t + regime switching), an independent DCF, peer re-rating, a sum-of-parts, and a scenario-weighted PWEV. Figures reconciled to mch_weekly_run live prices. Each chart below sits with the part of the thesis it evidences.
Investment Thesis
The bull case — 'AV Partner + Freight Bull' (10% weight) — targets $145, +101% vs spot. It needs the multiple to hold or expand.
The dashboard below is the whole argument on one page: spot ($72) against each valuation anchor, the scenario tree, technicals and the options-implied move.
Anti-Thesis (The Real Bear Case)
The structural case — 'AV Disruption (Waymo/Tesla)' (20%) — targets $40, -45% vs spot. This sits below the 52-week low — a genuine structural impairment, not a mild pullback.
Key Debate
P/E Multiple explains 51% of Monte Carlo outcome variance — i.e. value is set by the multiple the market will pay, a rate/sentiment regime bet as much as an earnings bet.
Earnings-Call Disconfirmation & Sentiment
Derived signals from the MCH market-data store (Alpha Vantage transcripts + news). Quantitative tone only — a disconfirmation flag, not a substitute for reading the call.
Management vs analyst tone (2026Q1): management +0.67 vs analyst floor +0.00 → delta +0.67 (n=15 mgmt / 8 Q&A; 96th pctile across the S&P book, z +1.7).
Flag: ELEVATED — management unusually upbeat vs the analyst floor relative to peers (disconfirmation watch).
| Quarter | Mgmt | Analyst | Delta |
|---|---|---|---|
| 2026Q1 | +0.67 | +0.00 | +0.67 |
| 2025Q4 | +0.69 | +0.26 | +0.43 |
| 2025Q3 | +0.71 | +0.00 | +0.71 |
| 2025Q2 | +0.55 | +0.18 | +0.36 |
News (last 365d, 1000 articles): avg ticker sentiment +0.19 (bullish 17% / bearish 2%)
Scenario Analysis
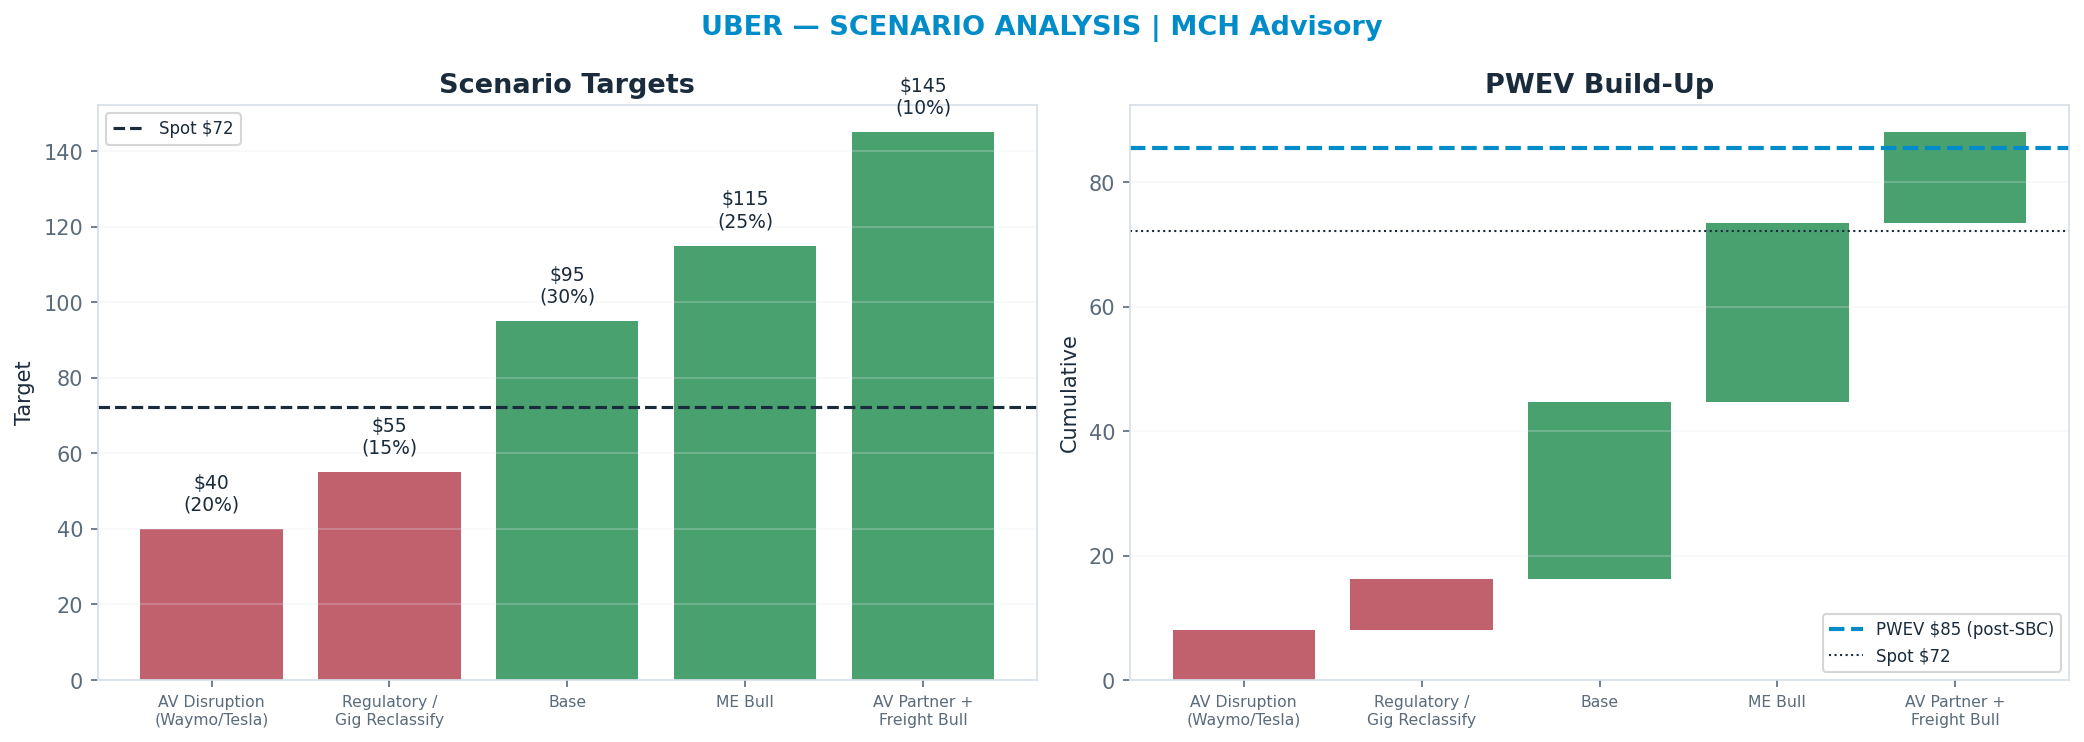
The tree runs from a structural 'AV Disruption (Waymo/Tesla)' downside ($40) to a 'AV Partner + Freight Bull' bull case ($145); the probability-weighted blend (PWEV $85) is +18% versus spot.
| Scenario | Probability | Target | Return |
|---|---|---|---|
| AV Disruption (Waymo/Tesla) | 20% | $40 | -45% |
| Regulatory / Gig Reclassify | 15% | $55 | -24% |
| Base | 30% | $95 | +32% |
| ME Bull | 25% | $115 | +59% |
| AV Partner + Freight Bull | 10% | $145 | +101% |
| Probability-Weighted (PWEV, after SBC dilution) | — | $85 | +18% |
SBC charge: scenario targets are gross per-share prices; the PWEV is reduced by one year of stock-based-compensation dilution (3.0% of shares, on SBC ≈ 4% of revenue), trimming the gross PWEV of $88 to $85 (-2.9%). SBC is charged once, as dilution — never also deducted from FCF.
Scenario rationale — what each probability buys (the driver path behind every target):
- AV Disruption (Waymo/Tesla) (20%, $40). Tesla and/or Waymo scale owned robotaxi networks via their own consumer apps, disintermediating Uber's Mobility marketplace; gross-bookings growth decelerates to low-single-digits, Mobility take-rate compresses as Uber fights to retain demand, and consolidated Adj EBITDA margin on bookings stalls. The market re-rates Uber as a structurally challenged middleman; the multiple compresses toward ~9x EBITDA. Target sits below the 52-week low — a genuine structural-impairment case where the AV bear thesis plays out. Drivers — bookings_growth: ~3-5%; mobility_take_rate: compresses to ~24%; ebitda_margin_on_bookings: stalls ~4%; av_outcome: owned robotaxi bypass; multiple: ~9x EV/EBITDA.
- Regulatory / Gig Reclassify (15%, $55). Adverse driver-classification rulings in one or more major markets (EU Platform Work Directive bite + a US state reversal) force employee-level labor costs and benefits, raising Mobility cost structure and compressing take-rate margin. Bookings growth holds mid-teens but EBITDA margin on bookings stays capped as labor and insurance costs absorb operating leverage; the multiple stays de-rated ~11x on margin uncertainty. Drivers — bookings_growth: ~12-14%; mobility_take_rate: ~26% net of higher costs; ebitda_margin_on_bookings: capped ~4.5%; labor_cost: step-up; multiple: ~11x EV/EBITDA.
- Base (30%, $95). Gross bookings compound mid-to-high teens (Mobility ~15-18%, Delivery ~18%), take-rate holds ~28-30%, advertising attach scales, and consolidated Adj EBITDA margin on bookings expands toward ~4.5-5% as fixed-cost leverage and ad mix flow through. FCF conversion inflects positively (asset-light, low capex). AV remains a managed partner opportunity rather than a near-term threat; the multiple normalizes ~14-15x EV/EBITDA on proven margin/FCF inflection. Drivers — bookings_growth: ~16%; mobility_take_rate: ~29%; ebitda_margin_on_bookings: ~4.7%; ad_revenue: ~$2B+ run-rate; multiple: ~14x EV/EBITDA.
- ME Bull (25%, $115). Bookings accelerate toward ~20% on MAPC growth, frequency gains and Uber One membership flywheel; advertising scales past ~$2.5B at high incremental margin, lifting consolidated Adj EBITDA margin on bookings above ~5.5%. Strong FCF generation funds buybacks; operating leverage compounds. The multiple expands ~17x EV/EBITDA as the margin/FCF inflection is fully recognized. Drivers — bookings_growth: ~20%; mobility_take_rate: ~30%; ebitda_margin_on_bookings: >5.5%; ad_revenue: >$2.5B; multiple: ~17x EV/EBITDA.
- AV Partner + Freight Bull (10%, $145). The partner-AV thesis is vindicated: Uber becomes the dominant demand-aggregation and fleet-marketplace layer for third-party robotaxis (Waymo and others), monetizing AV miles without driver-supply cost and lifting structural Mobility margin; Freight inflects to positive Adj EBITDA on a freight-cycle recovery. Bookings compound ~20%+, EBITDA margin on bookings pushes toward ~6%+, and Uber is re-rated as the asset-light AV platform winner; multiple ~19-20x EV/EBITDA. Drivers — bookings_growth: >20%; av_outcome: partner-platform win; ebitda_margin_on_bookings: >6%; freight: positive Adj EBITDA; multiple: ~19x EV/EBITDA.
Valuation Triangulation
Five anchors — but read them with their basis in mind. The Monte Carlo, the DCF terminal, and the peer re-rate all key off a market multiple, so they are not fully independent; only the discounted cash flows themselves are genuinely multiple-free. The discipline is to read the spread and weight the cash-based view, not to treat five numbers as five independent votes.
| Method | Basis | Fair Value | vs Spot |
|---|---|---|---|
| Monte Carlo median (Student-t + regime) | multiple | $70 | -2% |
| Sum-of-Parts | multiple | $57 | -21% |
| Peer P/E re-rate | multiple | $92 | +28% |
| Peer EV/Revenue re-rate | multiple | $138 | +92% |
| Scenario PWEV | multiple | $85 | +18% |
| DCF (5-year + terminal) | cash flow + terminal × | $59 | -18% |
| Triangulated (weighted) | — | $70 | -2% |
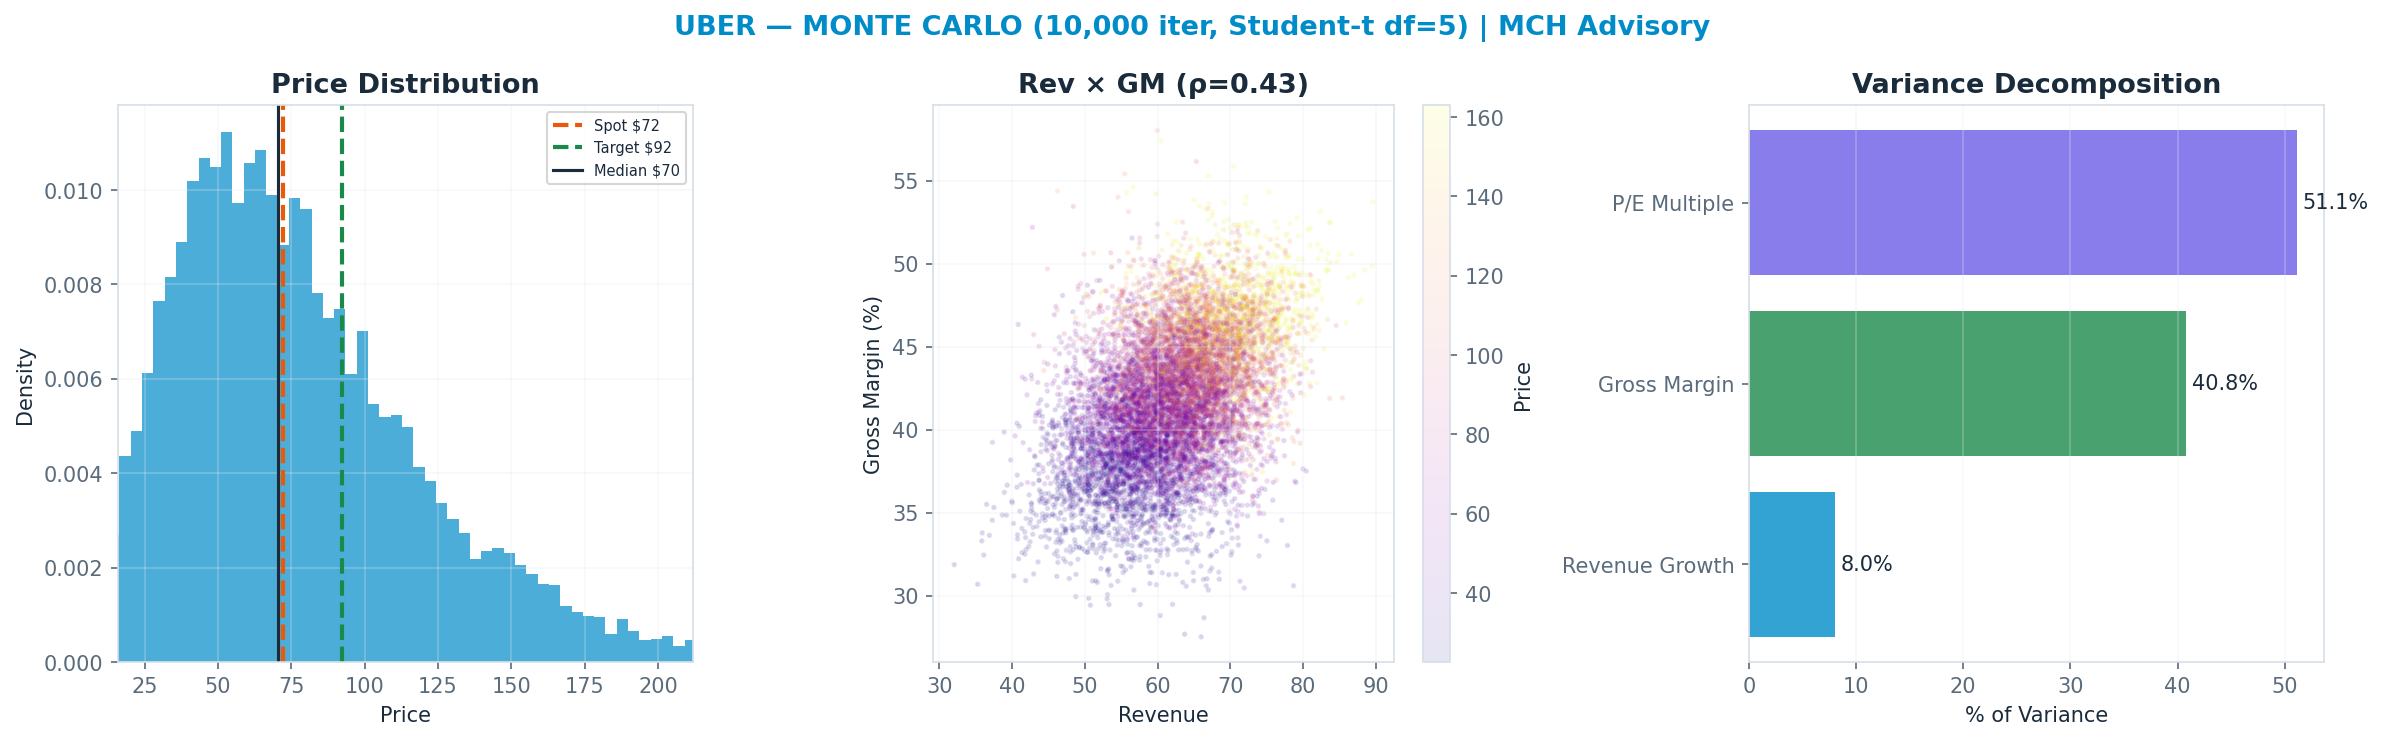
Monte Carlo — the distribution, not a point
10,000 paths, Student-t shocks (fat tails) with a regime-switching overlay. The median lands at $70 and 48% of paths finish above spot. The variance decomposition shows the p/e multiple is the dominant swing factor (51% of variance). Value is a multiple bet: fundamentals move the answer far less than the rating does.
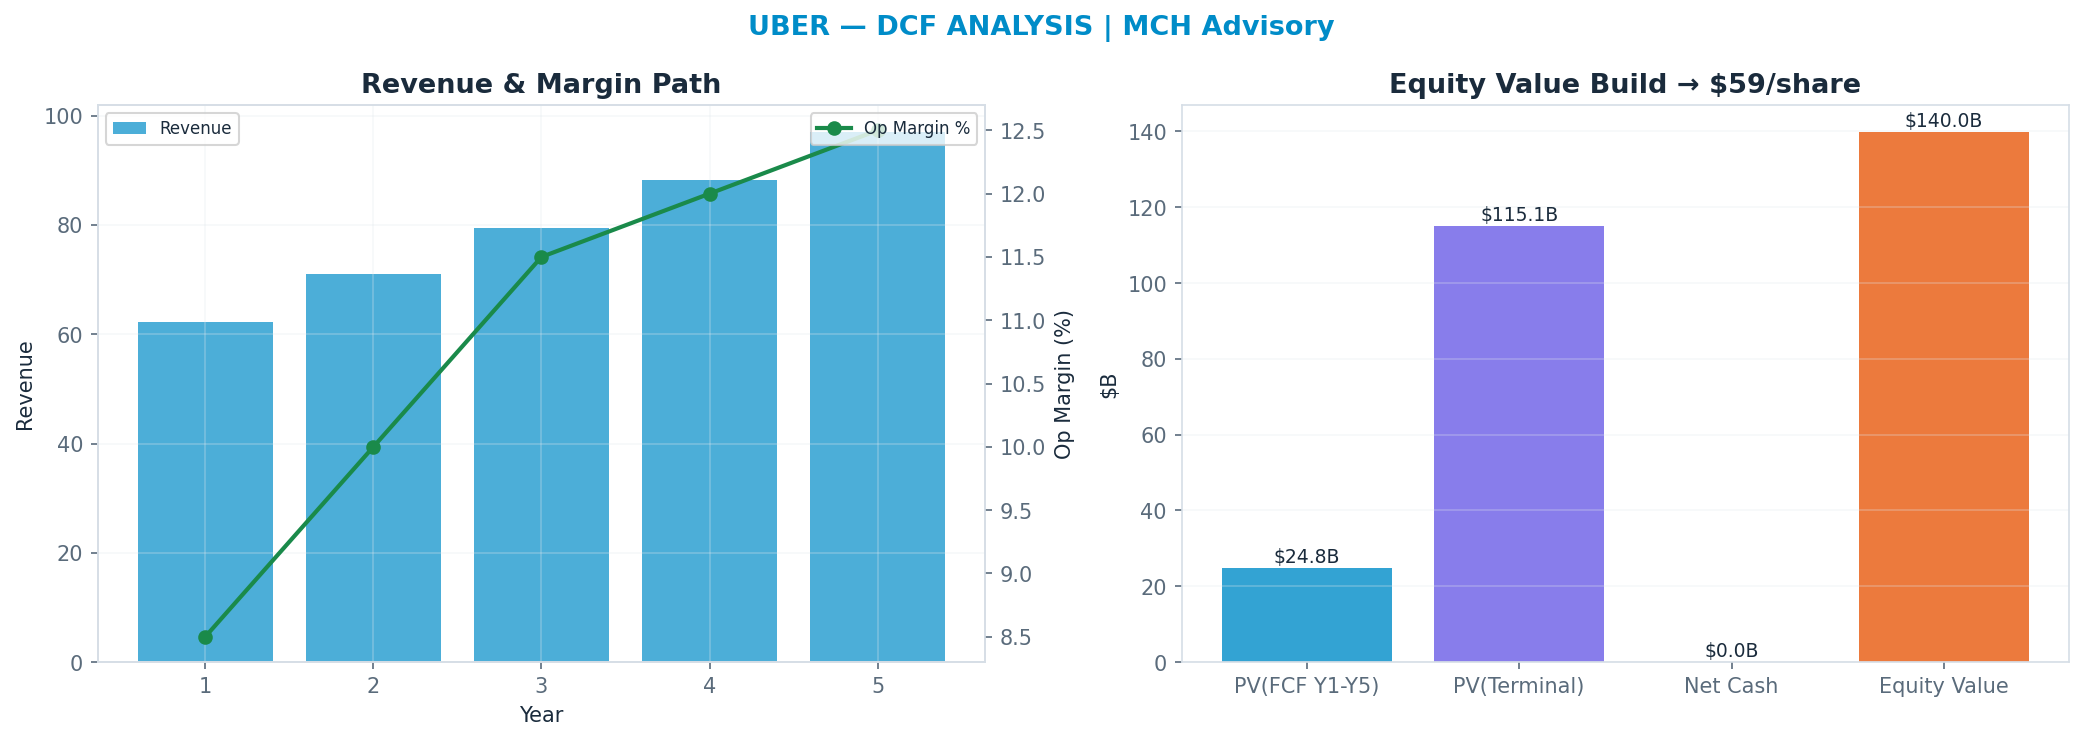
DCF — the cash-flow anchor
Independent of the market multiple: a 5-year path, WACC 10.0%, 20x terminal FCF multiple → $59. This anchor is deliberately the heaviest (35%): it is the valuation least hostage to the current multiple regime.
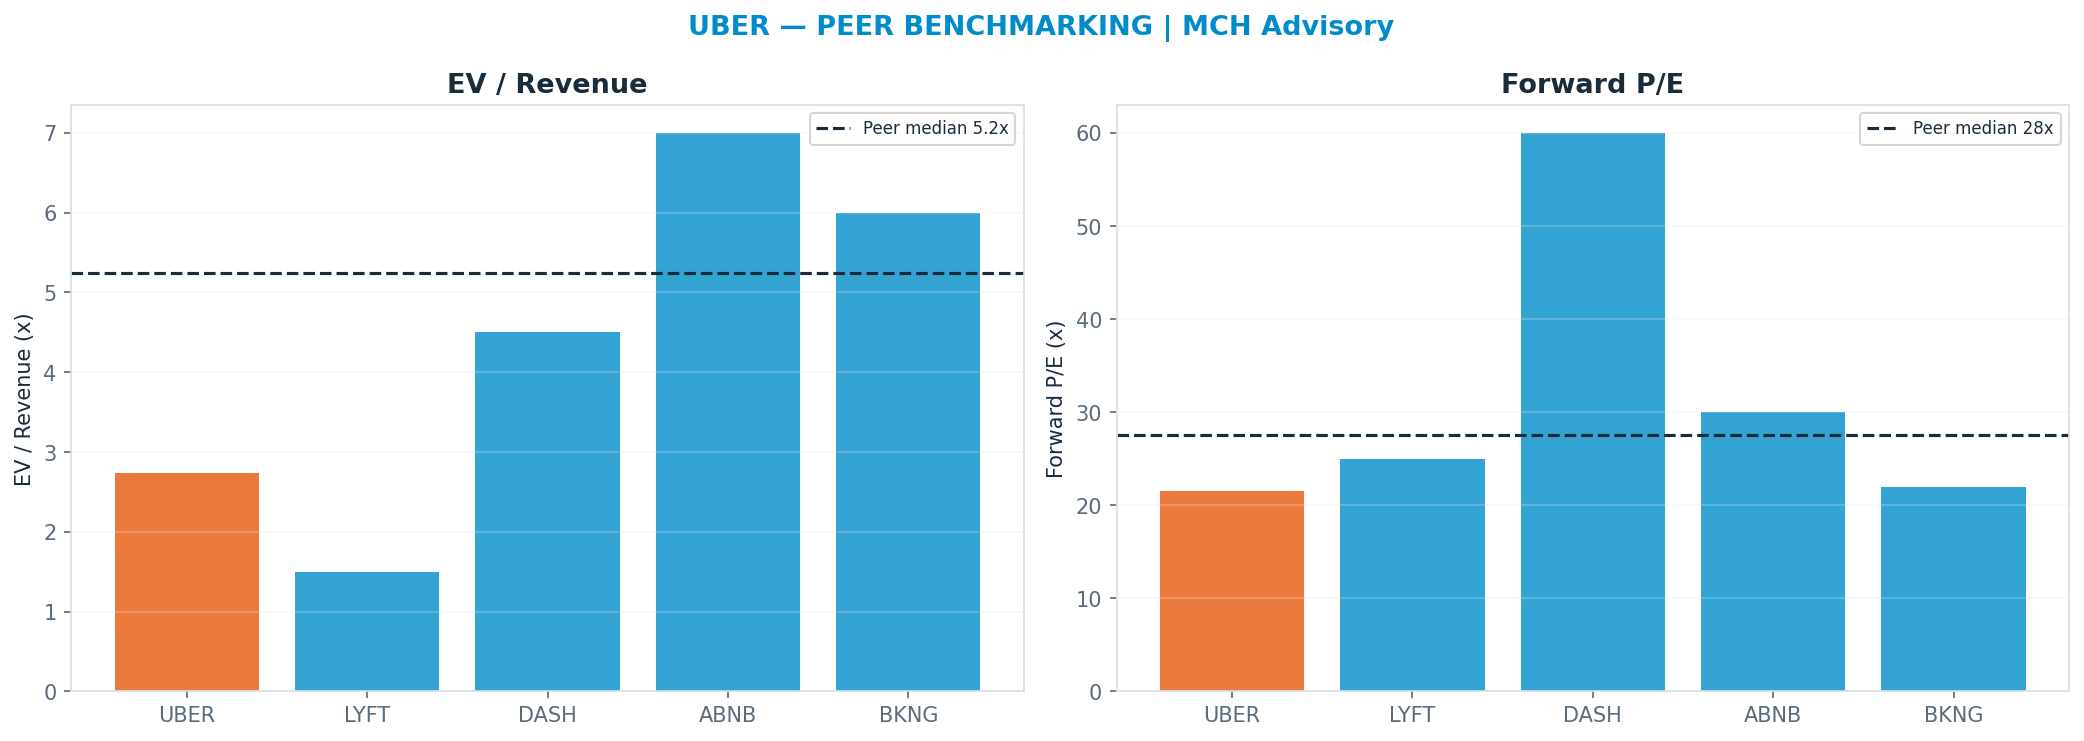
Peer benchmarking — relative value
Against the peer cohort, re-rating to the peer-median forward multiple (P/E 27.5x) implies $92. A premium is only justified by superior growth/margins; otherwise it is multiple risk. Weighted just 10% so the market's mood does not drive the fair value.
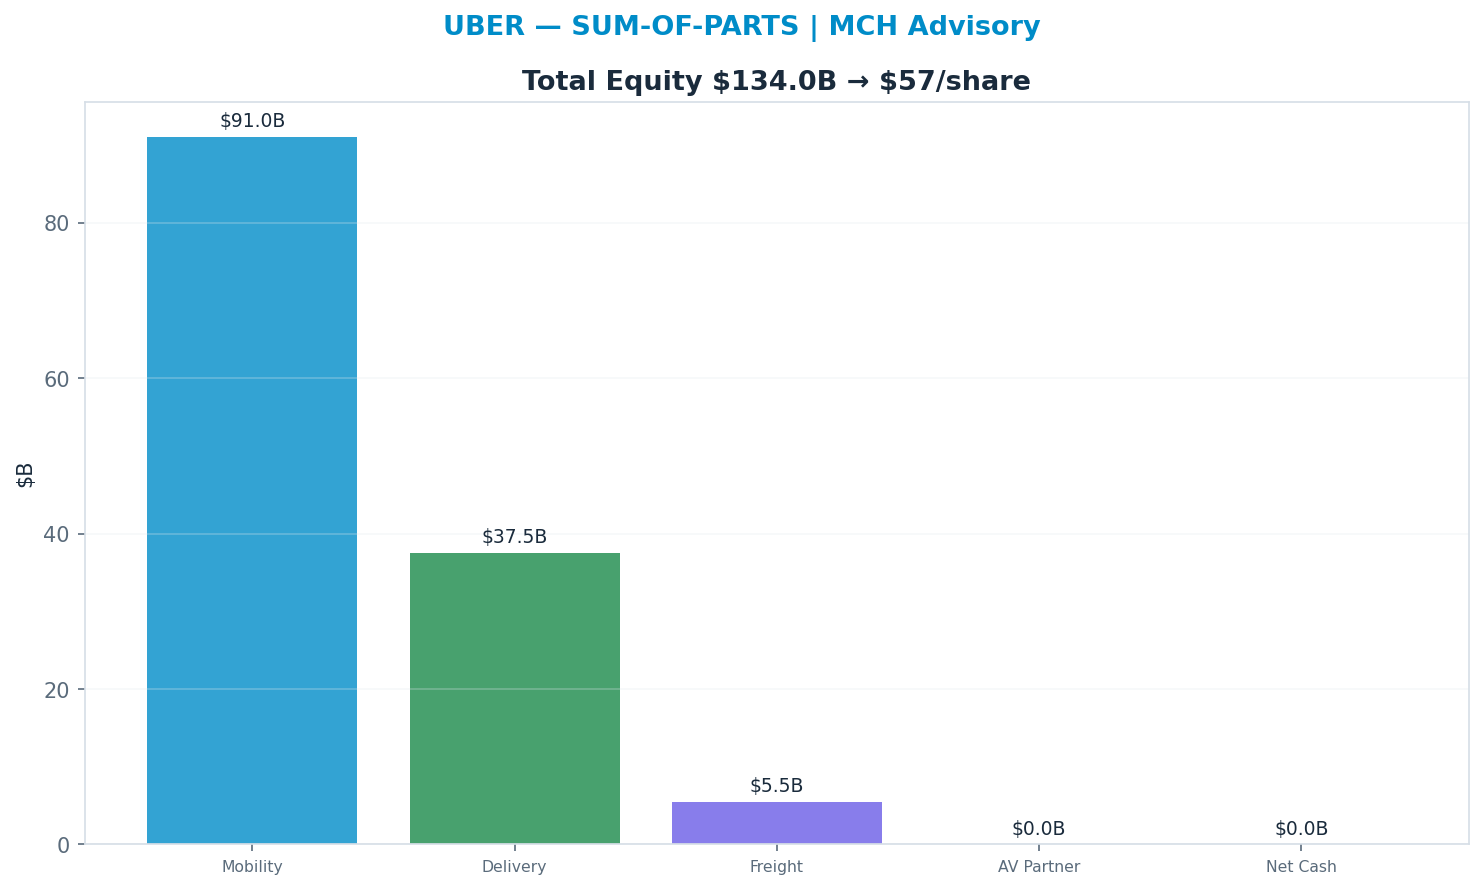
Sum-of-parts
Valuing each piece at the multiple it deserves (Mobility 4x, Delivery 2x, Freight 1x, AV Partner 0x) → $57. 'Mobility' dominates at 3.5× → $91B (68% of EV) — the segment whose multiple matters most.
Across all anchors the spread is wide (genuine disagreement — low valuation confidence).
Revenue-Segment Breakdown
The company-specific drivers behind the valuation — each segment carries its own growth, margin, multiple and capex intensity. (Tags: FACT reported · ESTIMATE from disclosures · INFERENCE judgment.)
| Segment | Revenue | Mix | Growth | Op margin | Multiple | Capex % | Tag |
|---|---|---|---|---|---|---|---|
| Mobility (ride-hail) | $27B | 50% | 18% | 8% | 16x | 1% | FACT/ESTIMATE |
| Delivery (Uber Eats) | $22B | 41% | 18% | 4% | 13x | 1% | FACT/ESTIMATE |
| Freight | $5B | 9% | 0% | 0% | 1x | 0% | FACT/ESTIMATE |
Named Exposures
Autonomous-vehicle (AV) disruption vs opportunity (ESTIMATE/INFERENCE)
| Dimension | Assessment |
|---|---|
| Model | PARTNER, not owner — Uber does not build AVs; it integrates third-party AV fleets (Waymo live in multiple US markets; ~20+ AV partners incl. global) onto its demand network |
| Bear (threat) | If Waymo/Tesla scale owned robotaxi networks with their own consumer apps, they disintermediate Uber's driver-supply marketplace and compress Mobility take-rate/bookings — the structural-impairment case |
| Bull (opportunity) | Uber as the demand-aggregation / fleet-marketplace layer: AV operators need utilization and Uber owns the largest rider demand pool + dispatch/ops/insurance stack; Uber monetizes AV miles without driver-supply cost |
| Take-rate risk | AV partner economics likely lower take-rate than human-driver bookings near-term; mix shift could dilute Mobility margin before scale offsets it |
| Tesla wildcard | Tesla robotaxi (own app + installed fleet) is the most credible bypass threat; Waymo has historically partnered with Uber in some markets, Tesla has signalled going direct |
| Capital intensity | AV keeps Uber asset-light (no fleet capex) IF partner model holds; owning fleets would break the asset-light thesis |
| Timeline | Commercial AV scale is multi-year and city-by-city (regulation, weather, geofencing); near-term financial impact modest, long-term terminal-value swing is large |
Regulatory / driver classification (ESTIMATE/INFERENCE)
| Dimension | Assessment |
|---|---|
| Core risk | Gig-worker reclassification (independent contractor -> employee) raising labor cost, benefits and payroll-tax burden across jurisdictions |
| Geographic spread | Patchwork exposure — US (CA Prop 22 upheld but contested; state-by-state), UK/EU (Platform Work Directive pushing worker status), parts of LatAm |
| Cost magnitude | Full reclassification in major markets could add billions in annual labor cost and compress Mobility take-rate margin materially |
| Insurance | Rising commercial auto insurance cost is a persistent structural headwind to Mobility unit economics, partly regulatory-driven |
| Local regulation | City-level caps, licensing, congestion rules and minimum-pay floors (e.g., NYC, parts of EU) can throttle supply or mandate higher driver pay |
| Offset | Uber has so far adapted via price pass-through and benefits-without-employment models; outcome is jurisdiction-specific, not binary |
Industry Context — Consumer Platforms
This name sits in the Consumer Platforms as a mobility/delivery platform (Rides + Eats + Freight). Consumer discretionary spend on rides/delivery is rate- and confidence-sensitive; but the dominant swing factors are gig-worker reclassification risk and the AV/robotaxi disruption tail (Waymo/Tesla) — partner upside vs displacement downside. Its scenarios are not guessed in isolation — they inherit a single, shared view of the cluster's driver cycle, so the names that depend on the same event are mutually consistent.
Value chain: UBER (mobility/delivery platform (Rides + Eats + Freight)) · HOOD (retail brokerage / fintech platform (equities, options, crypto))
| Shared state | Capex path | House view | This name implies |
|---|---|---|---|
| Consumer Recession / Regulatory | consumer pulls back + rate cuts hit NII; adverse regulatory rulings (gig reclassify / crypto crackdown) | 22% | 15% |
| Soft Patch / Disruption | sluggish consumer + the name-specific disruption tail bites (AV share for UBER, retail engagement fade for HOOD) | 18% | 20% |
| Base | steady consumer, rates drift, regulation manageable | 35% | 30% |
| Consumer Strength / Re-rate | strong consumer + risk-on tape; AV becomes a partner tailwind, crypto/product expansion inflects | 25% | 35% |
On the cluster's key downside — Consumer Recession / Regulatory (consumer pulls back + rate cuts hit NII; adverse regulatory rulings (gig reclassify / crypto crackdown)) — this name implies 15% vs the cluster house view of 22% (in line with the house). The cluster's full cross-stock reconciliation governs that the names which ride the same capex cycle assign it comparable odds.
Structure: Consumer Demand — Both depend on discretionary consumer activity — UBER on ride/delivery frequency, HOOD on retail trading engagement. Soft consumer confidence pressures both, but via different mechanisms. (INFERENCE) Rate Sensitivity — HOOD is directly rate-sensitive via net interest income on customer cash/margin balances; UBER is indirectly rate-sensitive through consumer spending power and (more importantly) the discount rate applied to a long-duration growth/AV-optionality valuation. (FACT) Regulation — UBER faces gig-worker classification risk (driver reclassification raises cost structure); HOOD faces payment-for-order-flow (PFOF) scrutiny and crypto/securities regulatory overhang. Shared theme: both are regulated consumer-facing platforms exposed to policy shifts. (FACT) Disruption Tails — UBER's tail is robotaxi/AV (Waymo/Tesla) — a partner-and-supply upside or a network-displacement downside. HOOD's tail is the crypto cycle — a structural bust that removes a high-margin revenue and engagement pillar. These tails are uncorrelated with each other. (INFERENCE)
Model Appendix
DCF — line items
| Year | Revenue | Op income | − Capex | + D&A | FCF | PV(FCF) |
|---|---|---|---|---|---|---|
| FY+1 | $62B | $5B | $1B | $1B | $4B | $4B |
| FY+2 | $71B | $7B | $1B | $1B | $5B | $5B |
| FY+3 | $80B | $9B | $1B | $1B | $7B | $5B |
| FY+4 | $88B | $11B | $1B | $1B | $8B | $6B |
| FY+5 | $97B | $12B | $1B | $1B | $9B | $6B |
| Terminal | — | — | — | — | $9B × 20x | $115B |
FCF is bridged: NOPAT + D&A − Capex − ΔNWC (capex intensity 1% of revenue, weighted from the segments) — not a single conversion fudge.
WACC 10.0% · Σ PV(FCF) $25B + PV(terminal) $115B = EV $140B; + net cash → equity $140B ÷ diluted shares 2.36B = $59/share (exit-multiple terminal).
- Gordon (perpetuity-growth) terminal at 2.5% → $44/share — a genuinely non-multiple, cash-based cross-check; the exit-multiple and Gordon values bracket the terminal-value risk.
- Incremental ROIC on the forecast capex ≈ 141% vs WACC 10% → above WACC — the build is value-creative.
Peer set
| Peer | EV/Rev | Fwd P/E | Growth | Op margin |
|---|---|---|---|---|
| LYFT | 1.5x | 25x | 10% | 4% |
| DASH | 4.5x | 60x | 18% | 5% |
| ABNB | 7.0x | 30x | 10% | 25% |
| BKNG | 6.0x | 22x | 9% | 35% |
| Median | 5.25x | 27.5x | — | — |
Peer-median fwd P/E → $92; EV/Rev → $138.
Weighted fair-value math
| Anchor | Value | Weight | Contribution |
|---|---|---|---|
| DCF | $59 | 35% | $21 |
| Scenario PWEV | $85 | 25% | $21 |
| Monte Carlo median | $70 | 15% | $11 |
| Sum-of-parts | $57 | 15% | $9 |
| Peer P/E | $92 | 10% | $9 |
| Triangulated | — | 100% | $70 |
Sensitivity
DCF/share — WACC × terminal multiple
| WACC \ Term× | 14.0x | 17.0x | 20.0x | 23.0x | 26.0x |
|---|---|---|---|---|---|
| 8% | $49 | $57 | $65 | $73 | $81 |
| 9% | $47 | $54 | $62 | $70 | $77 |
| 10% | $45 | $52 | $59 | $67 | $74 |
| 11% | $43 | $50 | $57 | $64 | $71 |
| 12% | $41 | $48 | $55 | $61 | $68 |
DCF/share — revenue CAGR Δ × op-margin Δ
| CAGRΔ \ MgnΔ | -3.0pp | -1.5pp | +0.0pp | +1.5pp | +3.0pp |
|---|---|---|---|---|---|
| -3.0pp | $39 | $46 | $53 | $59 | $66 |
| -1.5pp | $42 | $49 | $56 | $63 | $70 |
| +0.0pp | $44 | $52 | $59 | $67 | $74 |
| +1.5pp | $47 | $55 | $63 | $71 | $79 |
| +3.0pp | $50 | $58 | $67 | $75 | $84 |
Tornado — DCF/share swing by driver (widest first)
| Driver | Low | High | Swing |
|---|---|---|---|
| Op margin ±3pp | $44 | $74 | $30 |
| Terminal × ±15% | $52 | $67 | $15 |
| Revenue CAGR ±3pp | $53 | $67 | $14 |
| WACC ±1pp | $57 | $62 | $5 |
| FCF conversion ±10% | $59 | $59 | $0 |
Company lever — SoP/share vs Mobility (ride-hail) multiple (AI re-rating) (base 16x)
| Multiple | 11.2x | 13.6x | 16.0x | 18.4x | 20.8x |
|---|---|---|---|---|---|
| SoP/share | $291 | $323 | $355 | $387 | $419 |
Load-Bearing Assumptions
DCF: WACC 10%, terminal multiple 20×, FY+5 revenue $97B. Triangulation leans 35% on DCF, 25% on PWEV.
Reasons the Thesis Could Fail (Falsifiable)
The valuation is multiple-dependent (51% of variance); a de-rating toward the DCF anchor ($59) implies -18%.
Fact / Inference / Speculation
- FACT: Spot $72; 52-week range $67–$102; engine rating HOLD; base-case target $92 (+28%).
- INFERENCE: Triangulated FV $70 (-2%). P/E Multiple explains 51% of Monte Carlo outcome variance — i.e. value is set by the multiple the market will pay, a rate/sentiment regime bet as much as an earnings bet.
- SPECULATION: At current prices the embedded bet is that the multiple holds or expands — P/E Multiple carries 51% of outcome variance.
Recommendation: HOLD
Balanced: triangulated fair value $70 (-2% vs spot); the outcome hinges on P/E Multiple. The debate is P/E Multiple (51% of variance) — fundamentally a multiple/regime call. SBC runs 1800M TTM (disclosed in the appendix).