Rating: BUY
| Metric | Value |
|---|---|
| Current Price | $117 |
| Triangulated Fair Value | $121 |
| 12-mo Scenario PWEV | $145 |
| Implied Return | +4% |
| Forward P/E | 81.6x |
| Market Cap | $268B |
| 52-Week Range | $112 – $208 |
Methodology: Valuation triangulated across five independent anchors — Monte Carlo (Student-t + regime switching), an independent DCF, peer re-rating, a sum-of-parts, and a scenario-weighted PWEV. Figures reconciled to mch_weekly_run live prices. Each chart below sits with the part of the thesis it evidences.
Investment Thesis
The bull case — 'Platform Defender' (10% weight) — targets $310, +166% vs spot. It needs the multiple to hold or expand.
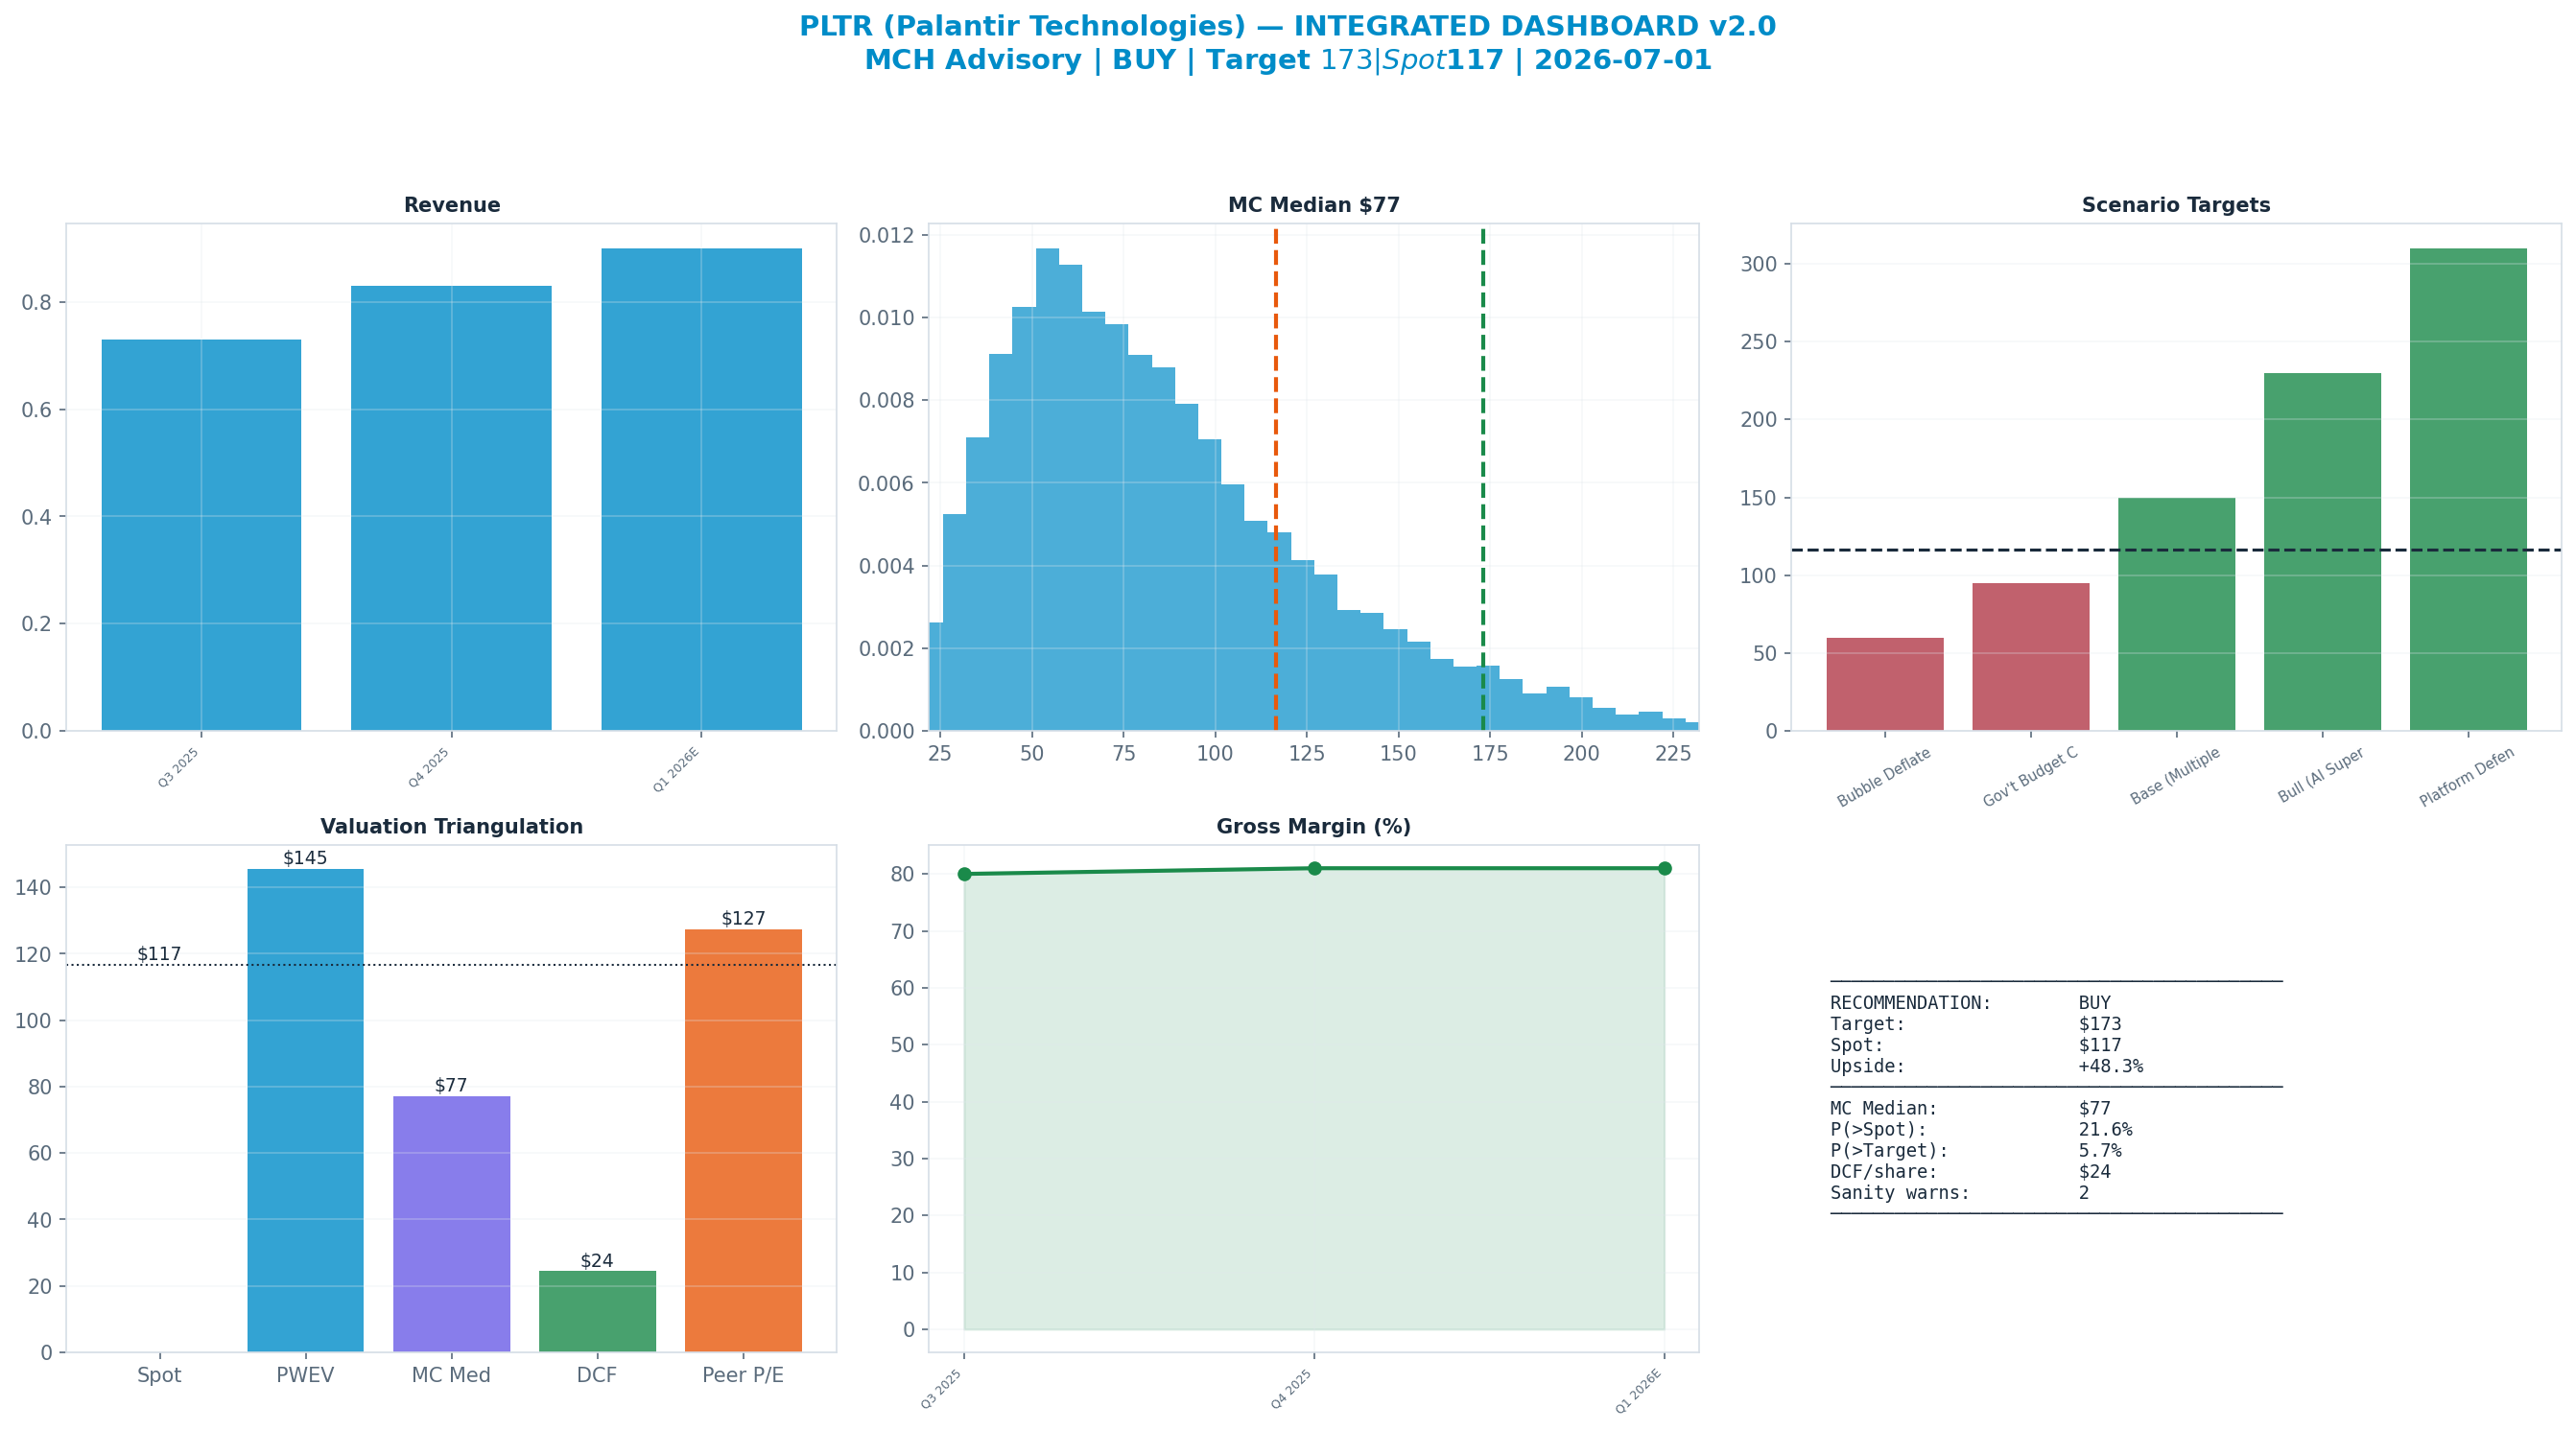
The dashboard below is the whole argument on one page: spot ($117) against each valuation anchor, the scenario tree, technicals and the options-implied move.
Anti-Thesis (The Real Bear Case)
The structural case — 'Bubble Deflates (Structural)' (25%) — targets $60, -49% vs spot. This sits below the 52-week low — a genuine structural impairment, not a mild pullback.
Key Debate
P/E Multiple explains 90% of Monte Carlo outcome variance — i.e. value is set by the multiple the market will pay, a rate/sentiment regime bet as much as an earnings bet.
Earnings-Call Disconfirmation & Sentiment
Derived signals from the MCH market-data store (Alpha Vantage transcripts + news). Quantitative tone only — a disconfirmation flag, not a substitute for reading the call.
Management vs analyst tone (2026Q1): management +0.52 vs analyst floor +0.17 → delta +0.35 (n=19 mgmt / 3 Q&A; 44th pctile across the S&P book, z -0.2).
Flag: TYPICAL — management-vs-analyst tone within the normal cross-sectional range.
| Quarter | Mgmt | Analyst | Delta |
|---|---|---|---|
| 2026Q1 | +0.52 | +0.17 | +0.35 |
| 2025Q4 | +0.45 | +0.15 | +0.30 |
| 2025Q3 | +0.69 | +0.60 | +0.09 |
| 2025Q2 | +0.53 | +0.10 | +0.43 |
News (last 365d, 1000 articles): avg ticker sentiment +0.15 (bullish 10% / bearish 2%)
Scenario Analysis
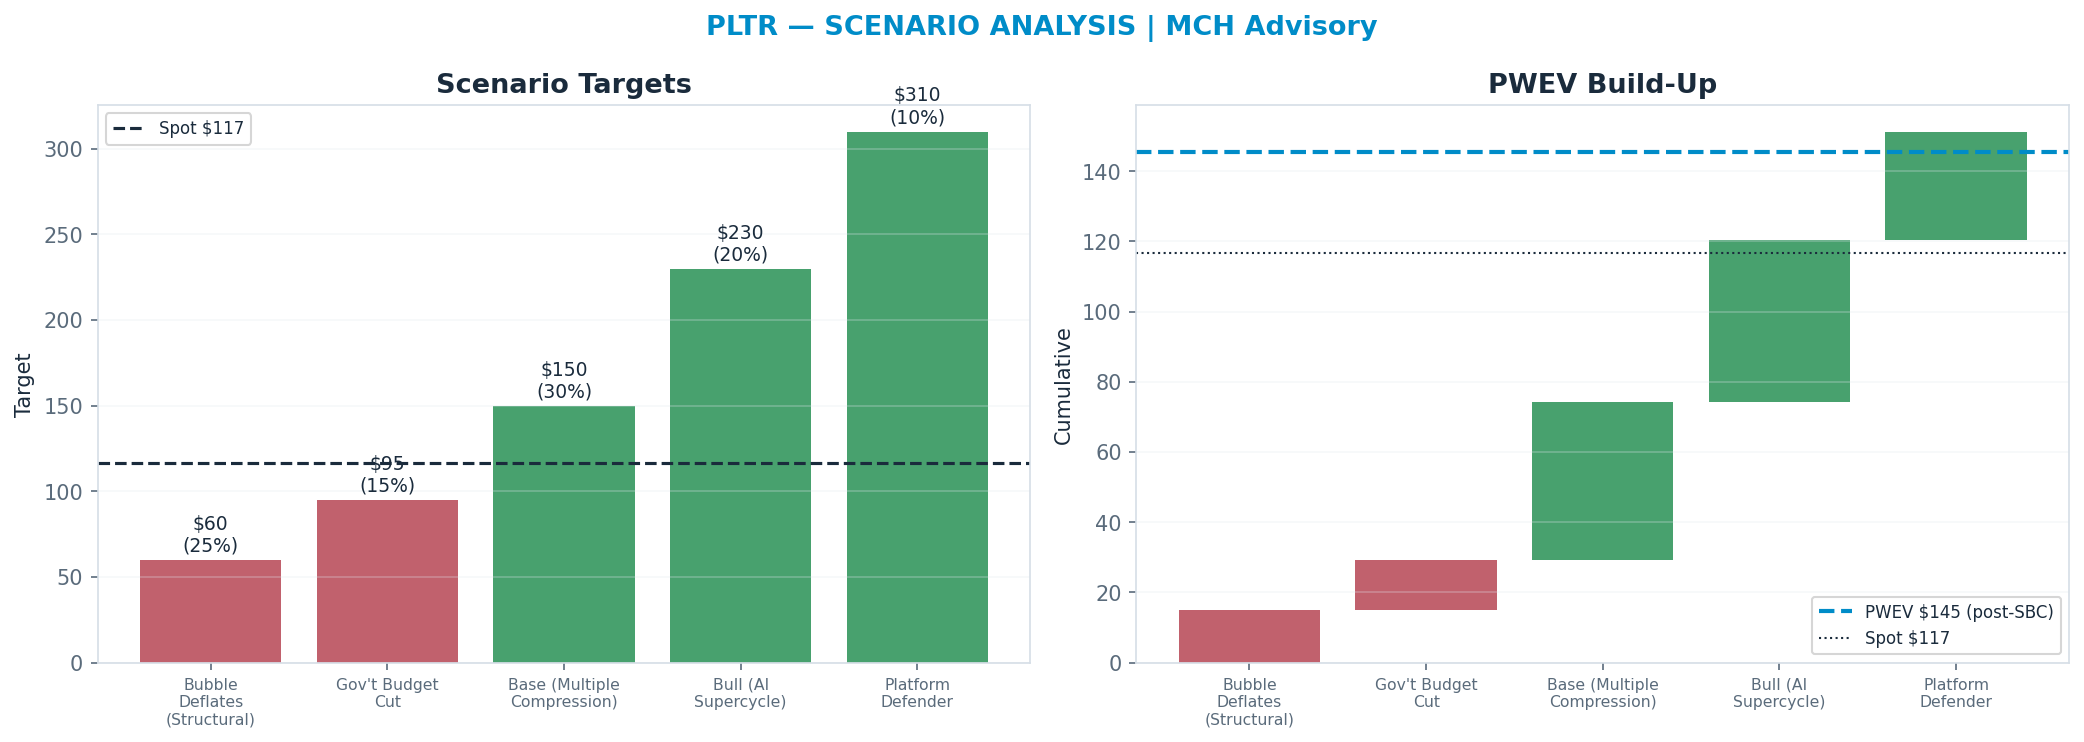
The tree runs from a structural 'Bubble Deflates (Structural)' downside ($60) to a 'Platform Defender' bull case ($310); the probability-weighted blend (PWEV $145) is +25% versus spot.
| Scenario | Probability | Target | Return |
|---|---|---|---|
| Bubble Deflates (Structural) | 25% | $60 | -49% |
| Gov't Budget Cut | 15% | $95 | -19% |
| Base (Multiple Compression) | 30% | $150 | +29% |
| Bull (AI Supercycle) | 20% | $230 | +97% |
| Platform Defender | 10% | $310 | +166% |
| Probability-Weighted (PWEV, after SBC dilution) | — | $145 | +25% |
SBC charge: scenario targets are gross per-share prices; the PWEV is reduced by one year of stock-based-compensation dilution (4.0% of shares, on SBC ≈ 28% of revenue), trimming the gross PWEV of $151 to $145 (-3.8%). SBC is charged once, as dilution — never also deducted from FCF.
Scenario rationale — what each probability buys (the driver path behind every target):
- Bubble Deflates (Structural) (25%, $60). AI-platform enthusiasm fades and the market re-rates high-multiple software names hard; PLTR's forward sales multiple compresses from ~40x toward ~10-12x. Revenue can still grow ~25-30%, but the multiple is the swing factor — a structural de-rate overwhelms fundamentals and drives the price well below the 52-week low. This is genuine multiple impairment, not a pullback. Drivers — revenue_growth: ~25-30%; us_comm_growth: decelerating to ~30%; adj_op_margin: ~30%; multiple: ~10-12x sales.
- Gov't Budget Cut (15%, $95). Defense/intelligence appropriations tighten or large programs slip, pressuring the ~50%+ government base; bookings and RPO disappoint on lumpy timing. Revenue growth slows to high-teens and the multiple compresses to ~12-15x sales as the 'durable government anchor' narrative weakens. The multiple move dominates the revenue move. Drivers — revenue_growth: ~15-20%; gov_growth: ~10%; adj_op_margin: ~32%; multiple: ~12-15x sales.
- Base (Multiple Compression) (30%, $150). The business executes — US Commercial keeps compounding on AIP and consolidated growth holds ~30% — but the extreme starting multiple simply normalizes from ~40x toward ~18-22x forward sales as the market demands proof of durability. Even with solid revenue and Rule-of-40 margins, the multiple compression is the dominant driver of returns, leaving the stock flat-to-lower. Drivers — revenue_growth: ~30%; us_comm_growth: ~50%; adj_op_margin: ~33%; multiple: ~18-22x sales.
- Bull (AI Supercycle) (20%, $230). AIP land-and-expand inflects, US Commercial sustains 50%+ growth and the commercial logo count compounds; consolidated growth re-accelerates above 40% with margin expansion. The market keeps paying a premium and the multiple holds near ~30-35x sales. Note: even this case is largely a bet that the MULTIPLE persists — the upside is multiple-dependent, not just execution-dependent. Drivers — revenue_growth: >40%; us_comm_growth: >60%; adj_op_margin: ~36%; multiple: ~30-35x sales.
- Platform Defender (10%, $310). PLTR proves AIP/Foundry are a durable enterprise operating system with high switching costs and >120% net dollar retention, defending share against hyperscaler and open-source AI tooling. Growth stays ~35% with rising margins, and the market awards a structurally premium ~22-26x sales — below today's level but well above generic software. The re-rate is moderate; durability, not hypergrowth, sustains the premium. Drivers — revenue_growth: ~35%; us_comm_growth: ~50%; ndr: >120%; adj_op_margin: ~35%; multiple: ~22-26x sales.
Valuation Triangulation
Five anchors — but read them with their basis in mind. The Monte Carlo, the DCF terminal, and the peer re-rate all key off a market multiple, so they are not fully independent; only the discounted cash flows themselves are genuinely multiple-free. The discipline is to read the spread and weight the cash-based view, not to treat five numbers as five independent votes.
| Method | Basis | Fair Value | vs Spot |
|---|---|---|---|
| Monte Carlo median (Student-t + regime) | multiple | $77 | -34% |
| Peer P/E re-rate | multiple | $127 | +9% |
| Peer EV/Revenue re-rate | multiple | $38 | -68% |
| Scenario PWEV | multiple | $145 | +25% |
| DCF (5-year + terminal) | cash flow + terminal × | $24 | -79% |
| Triangulated (weighted) | — | $121 | +4% |
DCF excluded from the weighted blend — diverges >55% from the Monte-Carlo / scenario core. For a high-leverage equity the per-share DCF (enterprise value less large net debt) is hypersensitive to the terminal multiple; a peer re-rate across heterogeneous margins is apples-to-oranges. Shown above for reference; the blend leans on the multiple-discipline and scenario anchors.
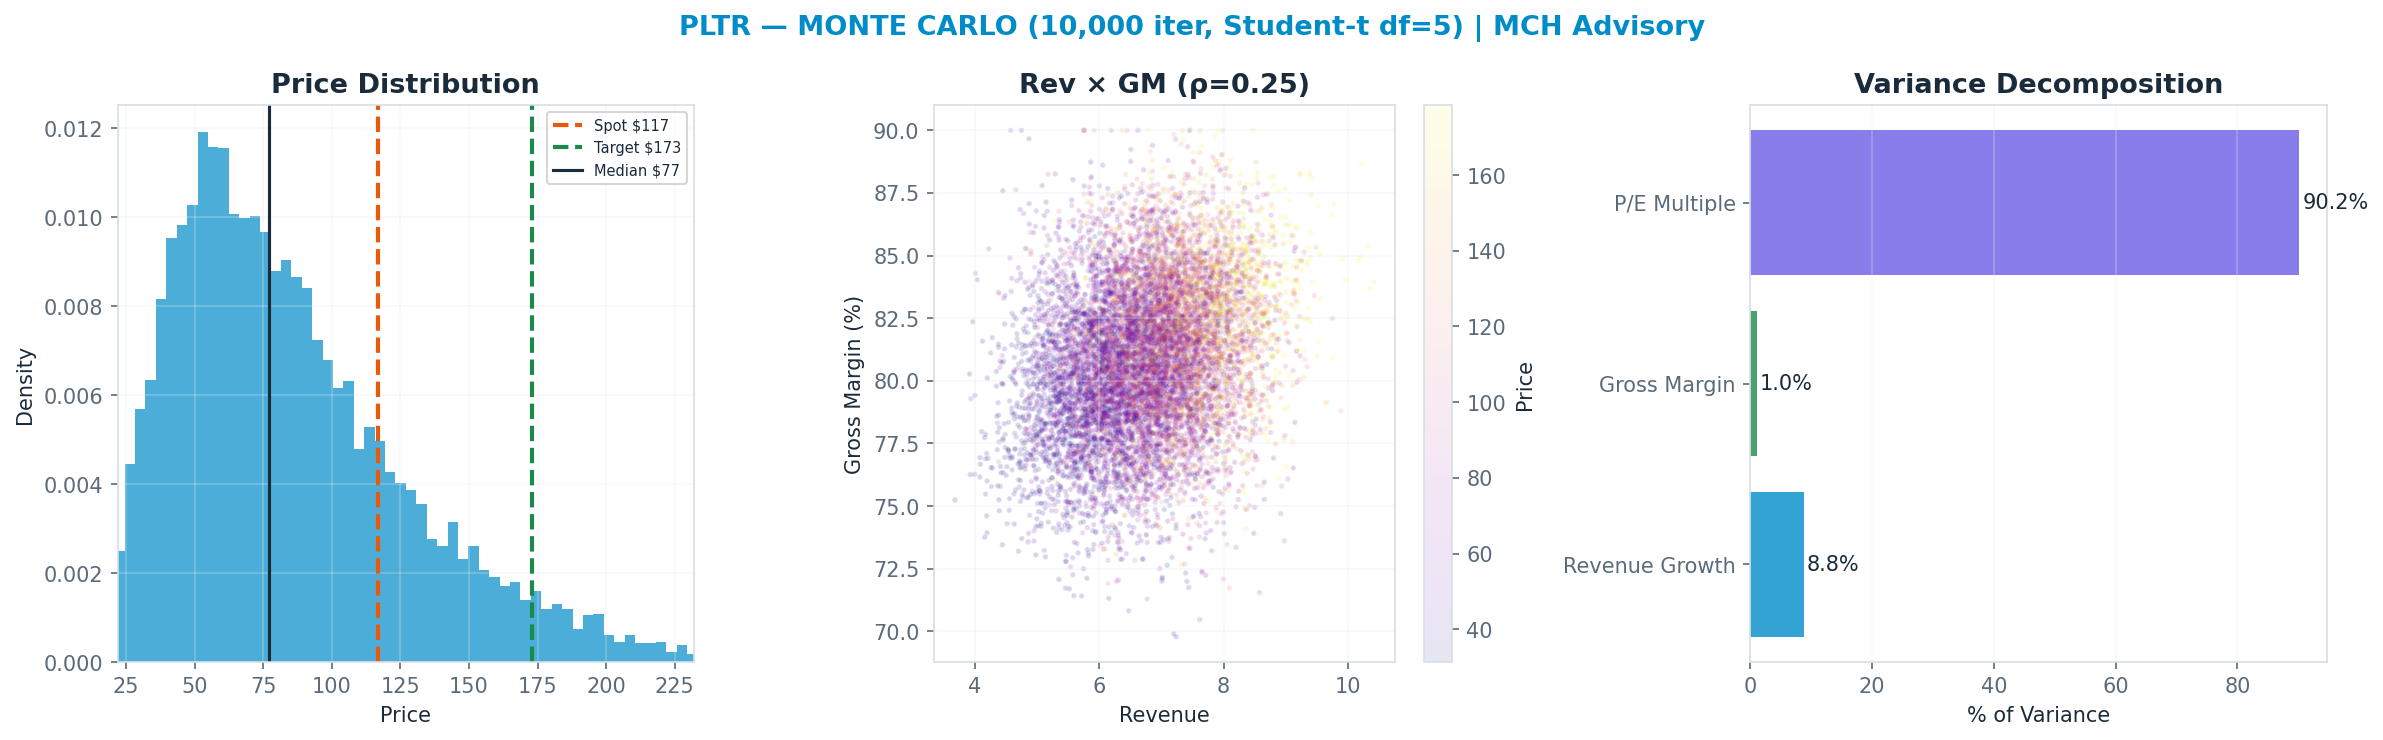
Monte Carlo — the distribution, not a point
10,000 paths, Student-t shocks (fat tails) with a regime-switching overlay. The median lands at $77 and 22% of paths finish above spot. The variance decomposition shows the p/e multiple is the dominant swing factor (90% of variance). Value is a multiple bet: fundamentals move the answer far less than the rating does.
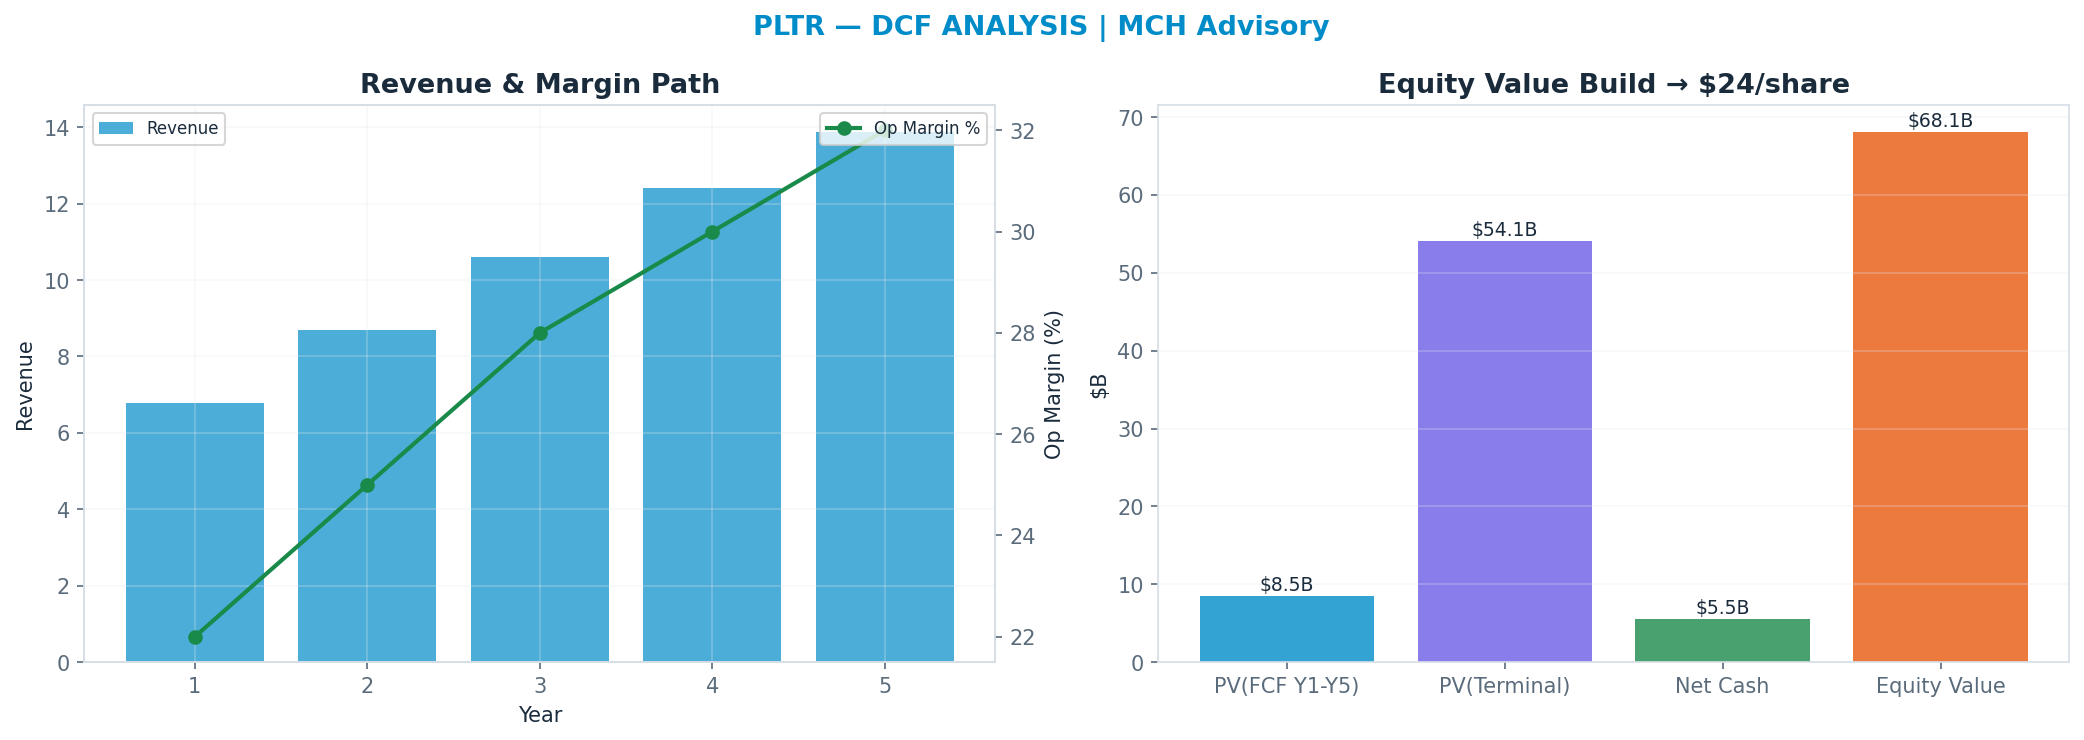
DCF — the cash-flow anchor
Independent of the market multiple: a 5-year path, WACC 11.0%, 25x terminal FCF multiple → $24. This anchor is deliberately the heaviest (41%): it is the valuation least hostage to the current multiple regime.
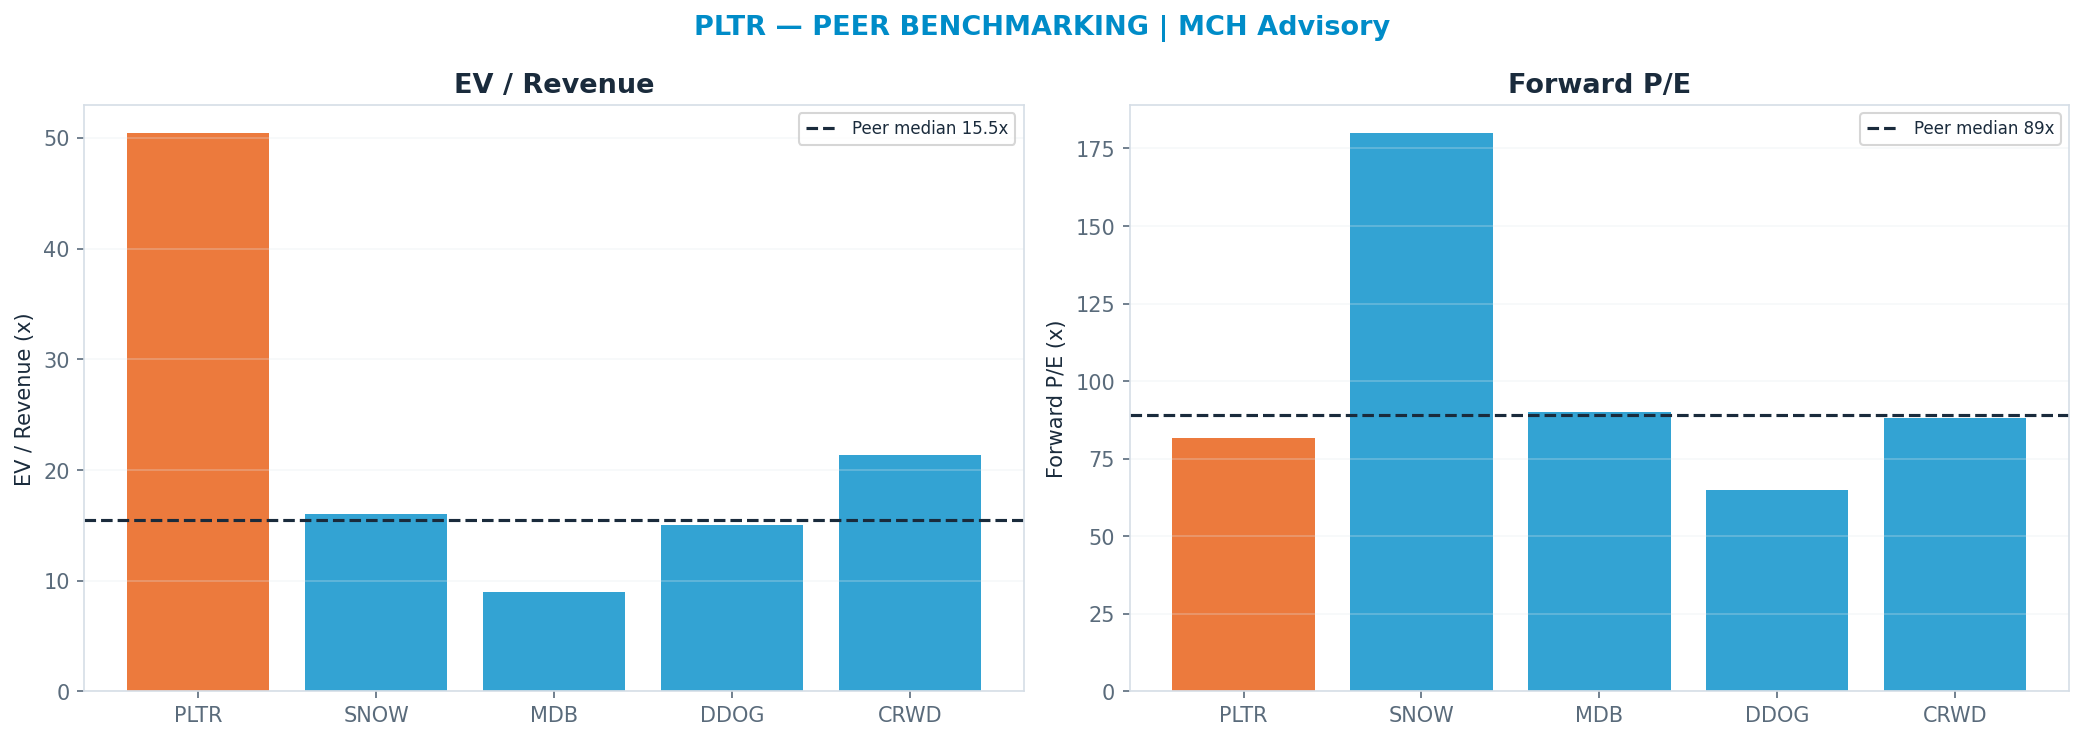
Peer benchmarking — relative value
Against the peer cohort, re-rating to the peer-median forward multiple (P/E 89.0x) implies $127. A premium is only justified by superior growth/margins; otherwise it is multiple risk. Weighted just 12% so the market's mood does not drive the fair value.
Across all anchors the spread is wide (genuine disagreement — low valuation confidence).
Revenue-Segment Breakdown
The company-specific drivers behind the valuation — each segment carries its own growth, margin, multiple and capex intensity. (Tags: FACT reported · ESTIMATE from disclosures · INFERENCE judgment.)
| Segment | Revenue | Mix | Growth | Op margin | Multiple | Capex % | Tag |
|---|---|---|---|---|---|---|---|
| US Commercial | $1.2B | 23% | 65% | 30% | 35x | 1% | FACT/ESTIMATE |
| US Government | $1.9B | 37% | 30% | 38% | 18x | 1% | FACT/ESTIMATE |
| International Commercial | $1.3B | 25% | 15% | 22% | 14x | 1% | FACT/ESTIMATE |
| International Government | $0.8B | 15% | 10% | 28% | 12x | 1% | FACT/ESTIMATE |
AI revenue, decomposed — the AI lines broken out (Azure-AI / Copilot / model-API / pass-through style), so the AI contribution is auditable:
| AI line | Run-rate | Growth | Gross margin | Capex % | Tag |
|---|---|---|---|---|---|
| AIP / US Commercial (AI growth engine) | $1.2B | 65% | 80% | 1% | ESTIMATE |
| Gotham (government / defense) | $1.9B | 25% | 80% | 1% | ESTIMATE |
| Foundry (commercial data platform) | $2.0B | 25% | 78% | 1% | ESTIMATE |
| SBC / warrant dilution (note, not revenue) | $0B | 0% | 0% | 0% | INFERENCE |
- AIP / US Commercial (AI growth engine): AIP (Artificial Intelligence Platform) is the core AI product and the hypergrowth driver; bootcamp-led land-and-expand. This is where the bull case lives — but the stock already prices years of this growth, so the debate is the MULTIPLE, not whether AIP grows.
- Gotham (government / defense): Legacy/anchor government platform (intel, defense). Durable and sticky but lumpy and budget-dependent; not a hyper-grower. SUBSET of US+Intl Government — shown for transparency, NOT additive to segment totals.
- Foundry (commercial data platform): Commercial data/ontology platform underpinning AIP deployments. SUBSET spanning US + International Commercial — shown for transparency, NOT additive.
- SBC / warrant dilution (note, not revenue): Diagnostic only — NOT revenue. Stock-based comp is a large real economic cost (high SBC/revenue ratio); GAAP profitability is far thinner than adjusted. Legacy customer/strategic warrants added share count. Treat share-count dilution (~3-5% p.a.) as a real drag on per-share value; adjusted op margin overstates economic margin.
Named Exposures
Valuation / multiple (the #1 risk) (FACT/INFERENCE)
| Dimension | Assessment |
|---|---|
| Forward sales multiple | ~40x forward revenue (~45x TTM) at ~$114 — among the highest of any large-cap US software name (est.) |
| GAAP P/E | Very high (triple-digit) even on GAAP profit; non-GAAP P/E also stretched vs peers |
| Growth already priced | INFERENCE: at ~40x sales the market is discounting many years of 30%+ growth plus durable margin expansion — i.e. near-flawless execution |
| Multiple-compression risk | A re-rate from ~40x to ~15-20x forward sales (still a premium) implies ~50%+ downside even if revenue keeps growing — the multiple, not the business, is the swing factor |
| Margin of safety | Effectively none at the multiple level; the equity is a bet on multiple persistence, not on business quality |
Concentration & government dependence (FACT/ESTIMATE/INFERENCE)
| Dimension | Assessment |
|---|---|
| Government revenue share | ~50%+ of revenue is government (US + International) — exposed to appropriations cycles and political budget risk |
| Contract lumpiness | Large multi-year awards drive quarter-to-quarter variability; timing slips can miss bookings/RPO expectations |
| Customer concentration | Top customers and a small set of large programs carry meaningful revenue weight; commercial base is broadening but still maturing |
| Budget / procurement risk | DoD and allied-nation budget shifts, continuing resolutions, or procurement delays can stall government growth |
| SBC dilution | ESTIMATE: high SBC/revenue; ~3-5% annual share-count dilution erodes per-share value and flatters adjusted margins vs GAAP |
Industry Context — Enterprise Software (premium SaaS)
This name sits in the Enterprise Software (premium SaaS) as a AI/data platform (AIP, Gov + Commercial). Almost pure AI-monetization story at an extreme multiple — the swing factor is the multiple, not the business. Its scenarios are not guessed in isolation — they inherit a single, shared view of the cluster's driver cycle, so the names that depend on the same event are mutually consistent.
Value chain: NOW (workflow platform (ITSM/HR/CSM + Now Assist)) · PANW (cybersecurity platform (Strata/Prisma/Cortex)) · PLTR (AI/data platform (AIP, Gov + Commercial))
| Shared state | Capex path | House view | This name implies |
|---|---|---|---|
| SaaS De-rate / AI Disruption | multiple compression + AI-native/MSFT disruption | 25% | 25% |
| Budget Digestion | enterprise IT spend softens | 18% | 15% |
| Steady Monetization | AI adds modestly; multiples hold | 37% | 30% |
| AI Monetization Inflection | AI becomes a major revenue line; re-rate | 20% | 30% |
On the cluster's key downside — SaaS De-rate / AI Disruption (multiple compression + AI-native/MSFT disruption) — this name implies 25% vs the cluster house view of 25% (in line with the house). The cluster's full cross-stock reconciliation governs that the names which ride the same capex cycle assign it comparable odds.
Structure: Spend Cycle — Enterprise IT/software budgets — resilient but cyclical; AI is currently additive to budgets, a risk if it later substitutes. (INFERENCE) Ai Monetization — Open question across the group: does GenAI become a durable premium SKU (Now Assist, Cortex, AIP) or does it commoditize/compress software value? (INFERENCE) Multiple Regime — All three trade at premium-to-extreme forward multiples; a SaaS de-rating compresses the whole group together. (FACT) Competition — Microsoft bundling (Copilot, Sentinel/Defender, Power Platform) is the shared distribution-power threat; AI-native startups are the disruption tail. (INFERENCE)
Model Appendix
DCF — line items
| Year | Revenue | Op income | − Capex | + D&A | FCF | PV(FCF) |
|---|---|---|---|---|---|---|
| FY+1 | $7B | $1B | $0B | $0B | $1B | $1B |
| FY+2 | $9B | $2B | $0B | $0B | $2B | $1B |
| FY+3 | $11B | $3B | $0B | $0B | $2B | $2B |
| FY+4 | $12B | $4B | $0B | $0B | $3B | $2B |
| FY+5 | $14B | $4B | $0B | $0B | $4B | $2B |
| Terminal | — | — | — | — | $4B × 25x | $54B |
FCF is bridged: NOPAT + D&A − Capex − ΔNWC (capex intensity 1% of revenue, weighted from the segments) — not a single conversion fudge.
WACC 11.0% · Σ PV(FCF) $9B + PV(terminal) $54B = EV $63B; + net cash → equity $68B ÷ diluted shares 2.79B = $24/share (exit-multiple terminal).
- Gordon (perpetuity-growth) terminal at 2.5% → $14/share — a genuinely non-multiple, cash-based cross-check; the exit-multiple and Gordon values bracket the terminal-value risk.
- Incremental ROIC on the forecast capex ≈ 468% vs WACC 11% → above WACC — the build is value-creative.
Peer set
| Peer | EV/Rev | Fwd P/E | Growth | Op margin |
|---|---|---|---|---|
| SNOW | 16.0x | 180x | 28% | 8% |
| MDB | 9.0x | 90x | 22% | 15% |
| DDOG | 15.0x | 65x | 25% | 25% |
| CRWD | 21.4x | 88x | 23% | 22% |
| Median | 15.5x | 89.0x | — | — |
Peer-median fwd P/E → $127; EV/Rev → $38.
Weighted fair-value math
| Anchor | Value | Weight | Contribution |
|---|---|---|---|
| Scenario PWEV | $145 | 50% | $73 |
| Monte Carlo median | $77 | 30% | $23 |
| Peer P/E | $127 | 20% | $25 |
| Triangulated | — | 100% | $121 |
Sensitivity
DCF/share — WACC × terminal multiple
| WACC \ Term× | 17.5x | 21.2x | 25.0x | 28.7x | 32.5x |
|---|---|---|---|---|---|
| 9% | $20 | $23 | $26 | $30 | $33 |
| 10% | $19 | $22 | $25 | $28 | $31 |
| 11% | $19 | $21 | $24 | $27 | $30 |
| 12% | $18 | $21 | $23 | $26 | $29 |
| 13% | $17 | $20 | $23 | $25 | $28 |
DCF/share — revenue CAGR Δ × op-margin Δ
| CAGRΔ \ MgnΔ | -3.0pp | -1.5pp | +0.0pp | +1.5pp | +3.0pp |
|---|---|---|---|---|---|
| -3.0pp | $20 | $21 | $22 | $23 | $24 |
| -1.5pp | $21 | $22 | $23 | $24 | $25 |
| +0.0pp | $22 | $23 | $24 | $25 | $27 |
| +1.5pp | $23 | $25 | $26 | $27 | $28 |
| +3.0pp | $25 | $26 | $27 | $28 | $30 |
Tornado — DCF/share swing by driver (widest first)
| Driver | Low | High | Swing |
|---|---|---|---|
| Terminal × ±15% | $21 | $27 | $6 |
| Revenue CAGR ±3pp | $22 | $27 | $5 |
| Op margin ±3pp | $22 | $27 | $4 |
| WACC ±1pp | $23 | $25 | $2 |
| FCF conversion ±10% | $24 | $24 | $0 |
Company lever — SoP/share vs US Commercial multiple (AI re-rating) (base 35x)
| Multiple | 24.5x | 29.8x | 35.0x | 40.2x | 45.5x |
|---|---|---|---|---|---|
| SoP/share | $42 | $45 | $48 | $50 | $53 |
Load-Bearing Assumptions
DCF: WACC 11%, terminal multiple 25×, FY+5 revenue $14B. Triangulation leans 41% on DCF, 29% on PWEV.
Reasons the Thesis Could Fail (Falsifiable)
P(>current)=21.6% below 30% band — bear weighting or opex may be too severe; verify. The valuation is multiple-dependent (90% of variance); a de-rating toward the DCF anchor ($24) implies -79%.
Fact / Inference / Speculation
- FACT: Spot $117; 52-week range $112–$208; engine rating BUY; base-case target $173 (+48%).
- INFERENCE: Triangulated FV $121 (+4%). P/E Multiple explains 90% of Monte Carlo outcome variance — i.e. value is set by the multiple the market will pay, a rate/sentiment regime bet as much as an earnings bet.
- SPECULATION: At current prices the embedded bet is that the multiple holds or expands — P/E Multiple carries 90% of outcome variance.
Recommendation: BUY
Caution: engine rates BUY on the $173 base case (+48%), but the skeptical triangulation ($81) sits at/below spot — the bull case is largely a multiple bet. The debate is P/E Multiple (90% of variance) — fundamentally a multiple/regime call. SBC runs 800M TTM (disclosed in the appendix).