Rating: SELL
| Metric | Value |
|---|---|
| Current Price | $341 |
| Triangulated Fair Value | $226 |
| 12-mo Scenario PWEV | $246 |
| Implied Return | -34% |
| Forward P/E | 85.5x |
| Market Cap | $278B |
| 52-Week Range | $140 – $303 |
Methodology: Valuation triangulated across five independent anchors — Monte Carlo (Student-t + regime switching), an independent DCF, peer re-rating, a sum-of-parts, and a scenario-weighted PWEV. Figures reconciled to mch_weekly_run live prices. Each chart below sits with the part of the thesis it evidences.
Investment Thesis
The bull case — 'ME Bull' (20% weight) — targets $360, +6% vs spot. It needs the multiple to hold or expand.
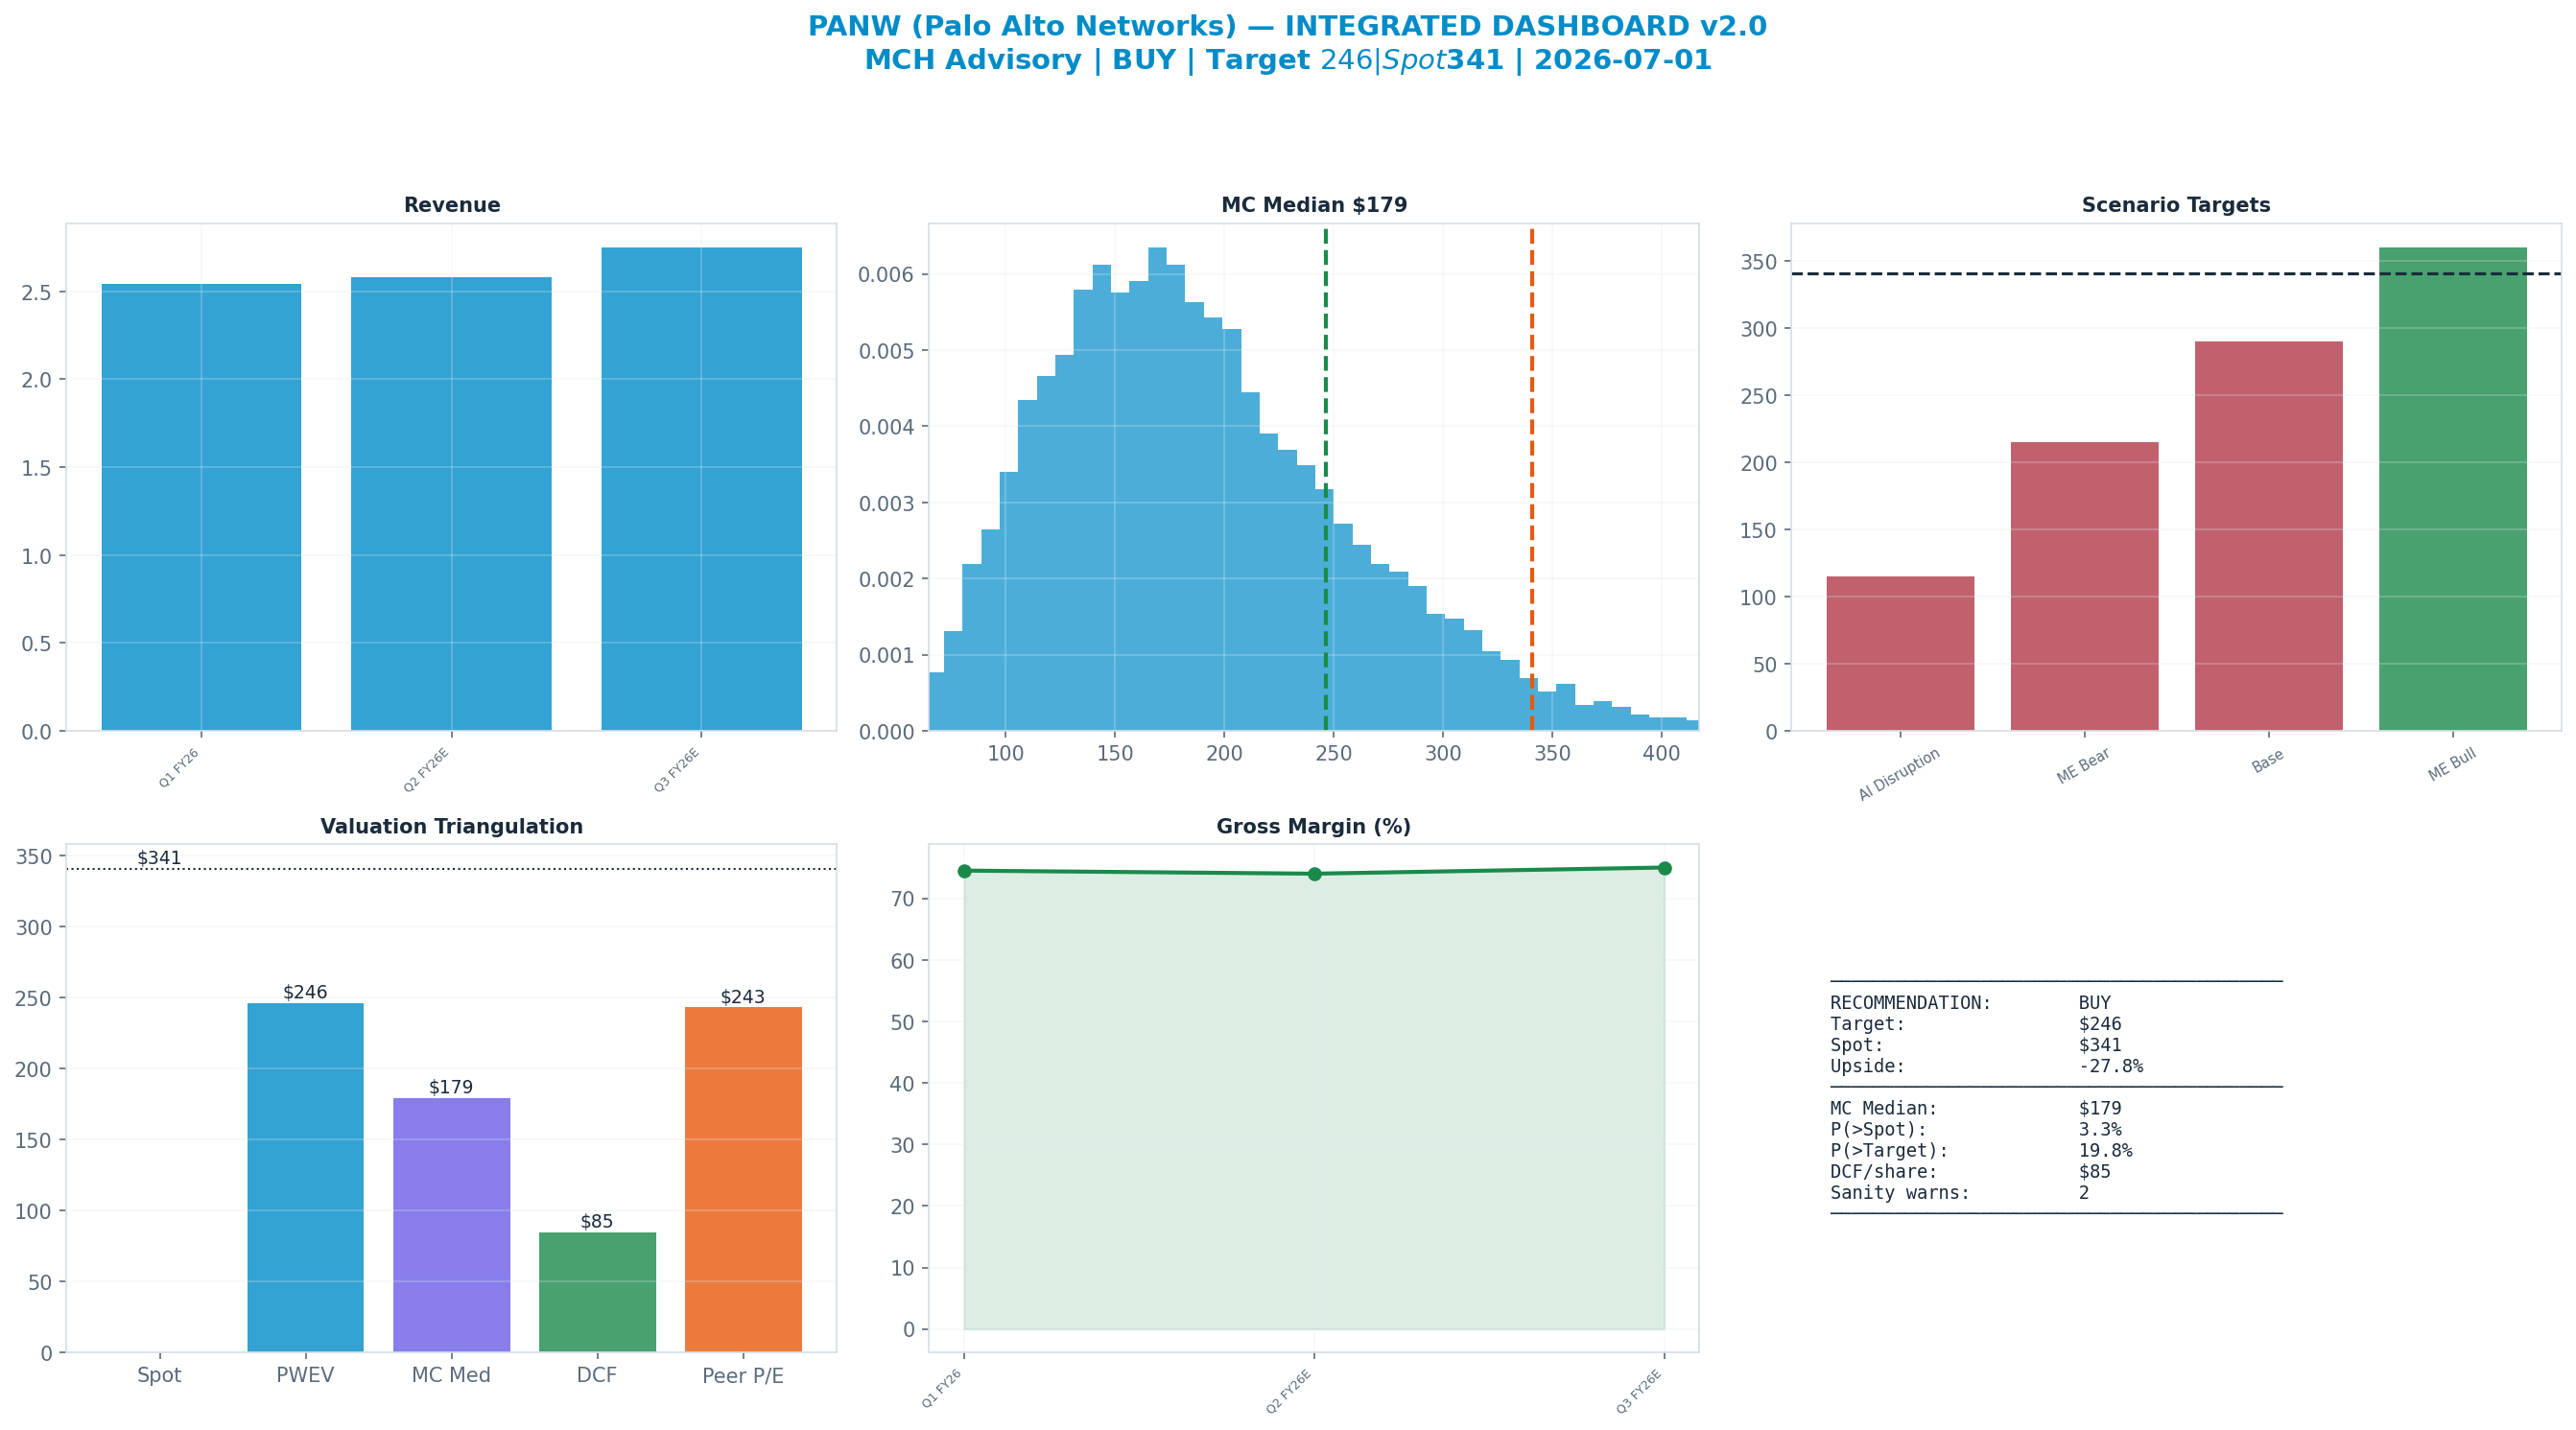
The dashboard below is the whole argument on one page: spot ($341) against each valuation anchor, the scenario tree, technicals and the options-implied move.
Anti-Thesis (The Real Bear Case)
The structural case — 'AI Disruption' (20%) — targets $115, -66% vs spot. This sits below the 52-week low — a genuine structural impairment, not a mild pullback.
Key Debate
P/E Multiple explains 88% of Monte Carlo outcome variance — i.e. value is set by the multiple the market will pay, a rate/sentiment regime bet as much as an earnings bet.
Earnings-Call Disconfirmation & Sentiment
Derived signals from the MCH market-data store (Alpha Vantage transcripts + news). Quantitative tone only — a disconfirmation flag, not a substitute for reading the call.
Management vs analyst tone (2026Q2): management +0.44 vs analyst floor +0.09 → delta +0.35 (n=17 mgmt / 8 Q&A; 43th pctile across the S&P book, z -0.2).
Flag: TYPICAL — management-vs-analyst tone within the normal cross-sectional range.
| Quarter | Mgmt | Analyst | Delta |
|---|---|---|---|
| 2026Q2 | +0.44 | +0.09 | +0.35 |
| 2026Q1 | +0.62 | +0.46 | +0.16 |
| 2025Q4 | +0.53 | +0.24 | +0.29 |
| 2025Q3 | +0.68 | +0.19 | +0.49 |
News (last 365d, 1000 articles): avg ticker sentiment +0.20 (bullish 29% / bearish 4%)
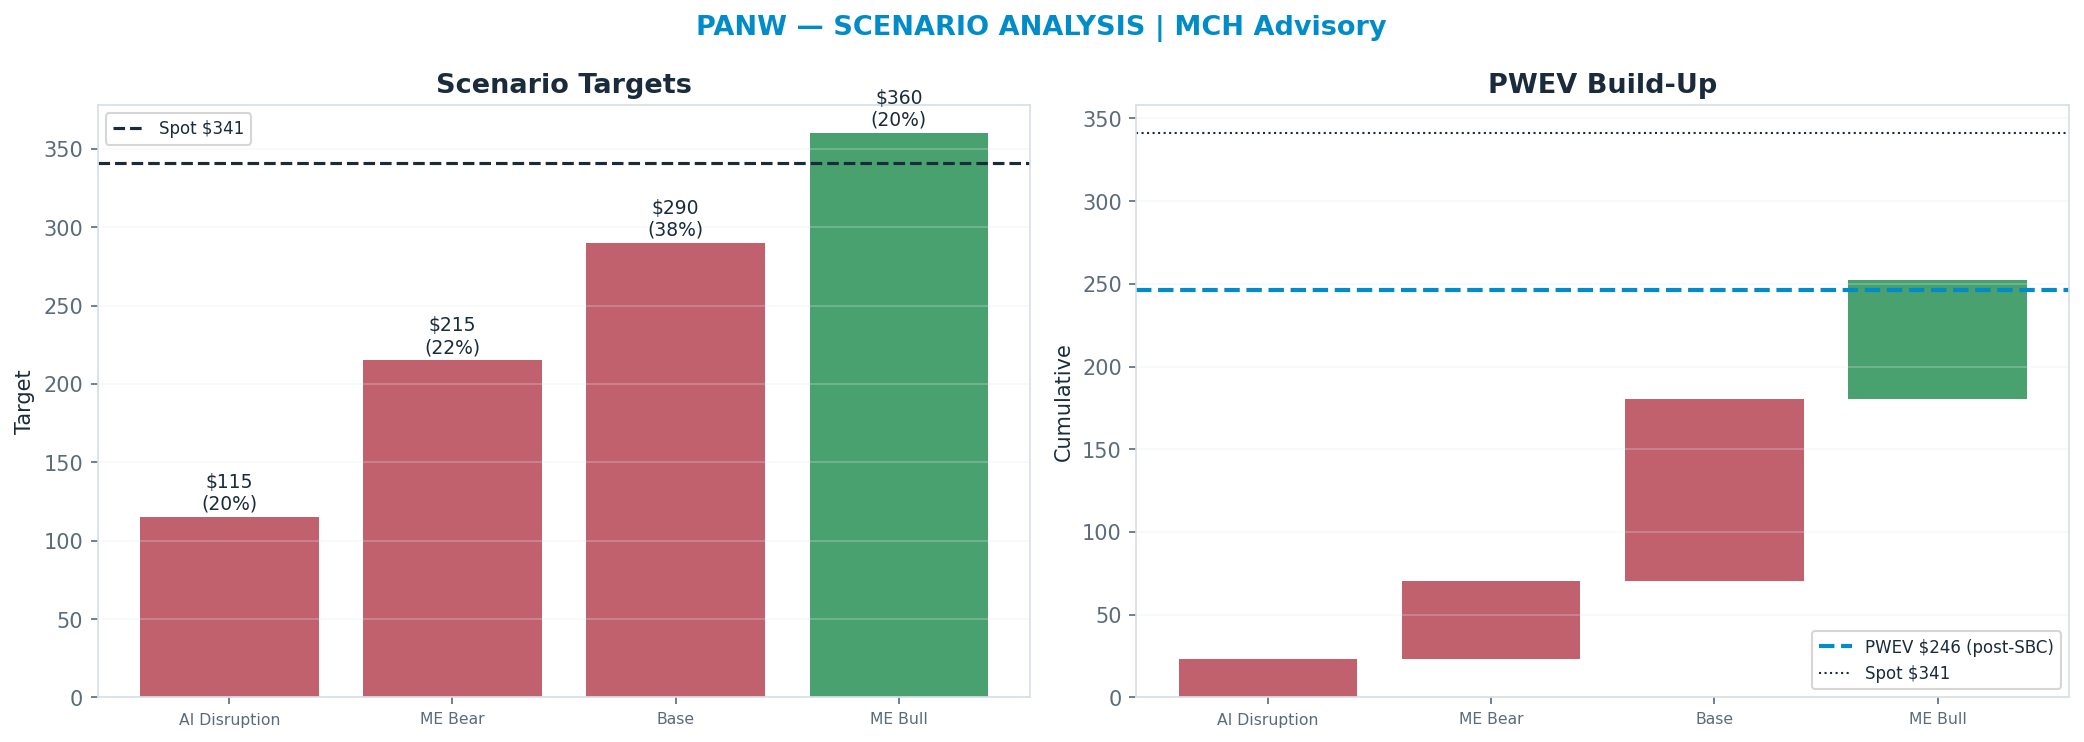
Scenario Analysis
The tree runs from a structural 'AI Disruption' downside ($115) to a 'ME Bull' bull case ($360); the probability-weighted blend (PWEV $246) is -28% versus spot.
| Scenario | Probability | Target | Return |
|---|---|---|---|
| AI Disruption | 20% | $115 | -66% |
| ME Bear | 22% | $215 | -37% |
| Base | 38% | $290 | -15% |
| ME Bull | 20% | $360 | +6% |
| Probability-Weighted (PWEV, after SBC dilution) | — | $246 | -28% |
SBC charge: scenario targets are gross per-share prices; the PWEV is reduced by one year of stock-based-compensation dilution (2.5% of shares, on SBC ≈ 16% of revenue), trimming the gross PWEV of $252 to $246 (-2.4%). SBC is charged once, as dilution — never also deducted from FCF.
Scenario rationale — what each probability buys (the driver path behind every target):
- AI Disruption (20%, $115). AI-native security startups and/or Microsoft's AI-driven Defender/Sentinel stack disintermediate the platform — autonomous, model-native SecOps erodes the moat XSIAM was meant to build, and bundled AI security collapses standalone willingness-to-pay. NGS ARR growth stalls, margins compress under defensive discounting, and the multiple breaks to ~25x in a structural-impairment re-rate that takes the target below the 52-week low. Drivers — ngs_arr_growth: stalls (~8%); rpo_growth: ~5%; op_margin: ~22%; multiple: ~25x.
- ME Bear (22%, $215). NGS ARR growth decelerates toward the low-20s and then mid-teens as Microsoft bundling and CRWD/ZS competition cap pricing; platformization discounts compress non-GAAP operating margin below ~26% without buying durable share. The ~70x multiple re-rates toward ~35x as the market reprices a mid-teens grower, taking the target well below the current price. Drivers — ngs_arr_growth: ~15%; rpo_growth: ~12%; op_margin: ~26%; multiple: ~35x.
- Base (38%, $290). NGS ARR compounds ~25-30% as platformization deals convert to expansion, RPO continues to build off multi-year consolidation contracts, and non-GAAP operating margin holds ~28%. The multiple normalises from ~70x toward ~45x as growth settles into a durable high-teens/low-20s revenue trajectory. Drivers — ngs_arr_growth: ~28%; rpo_growth: ~20%; op_margin: ~28%; multiple: ~45x.
- ME Bull (20%, $360). Platformization accelerates: large multi-year consolidation deals lift NGS ARR above ~30% and drive RPO sharply higher, with Cortex/Prisma mix shifting the model toward higher-growth recurring revenue and operating margin expanding past ~30% on scale. The market rewards proven consolidation with a sustained premium multiple ~55x. Drivers — ngs_arr_growth: >32%; rpo_growth: >25%; op_margin: >30%; multiple: ~55x.
Valuation Triangulation
Five anchors — but read them with their basis in mind. The Monte Carlo, the DCF terminal, and the peer re-rate all key off a market multiple, so they are not fully independent; only the discounted cash flows themselves are genuinely multiple-free. The discipline is to read the spread and weight the cash-based view, not to treat five numbers as five independent votes.
| Method | Basis | Fair Value | vs Spot |
|---|---|---|---|
| Monte Carlo median (Student-t + regime) | multiple | $179 | -47% |
| Peer P/E re-rate | multiple | $243 | -29% |
| Peer EV/Revenue re-rate | multiple | $198 | -42% |
| Scenario PWEV | multiple | $246 | -28% |
| DCF (5-year + terminal) | cash flow + terminal × | $85 | -75% |
| Triangulated (weighted) | — | $226 | -34% |
DCF excluded from the weighted blend — diverges >55% from the Monte-Carlo / scenario core. For a high-leverage equity the per-share DCF (enterprise value less large net debt) is hypersensitive to the terminal multiple; a peer re-rate across heterogeneous margins is apples-to-oranges. Shown above for reference; the blend leans on the multiple-discipline and scenario anchors.
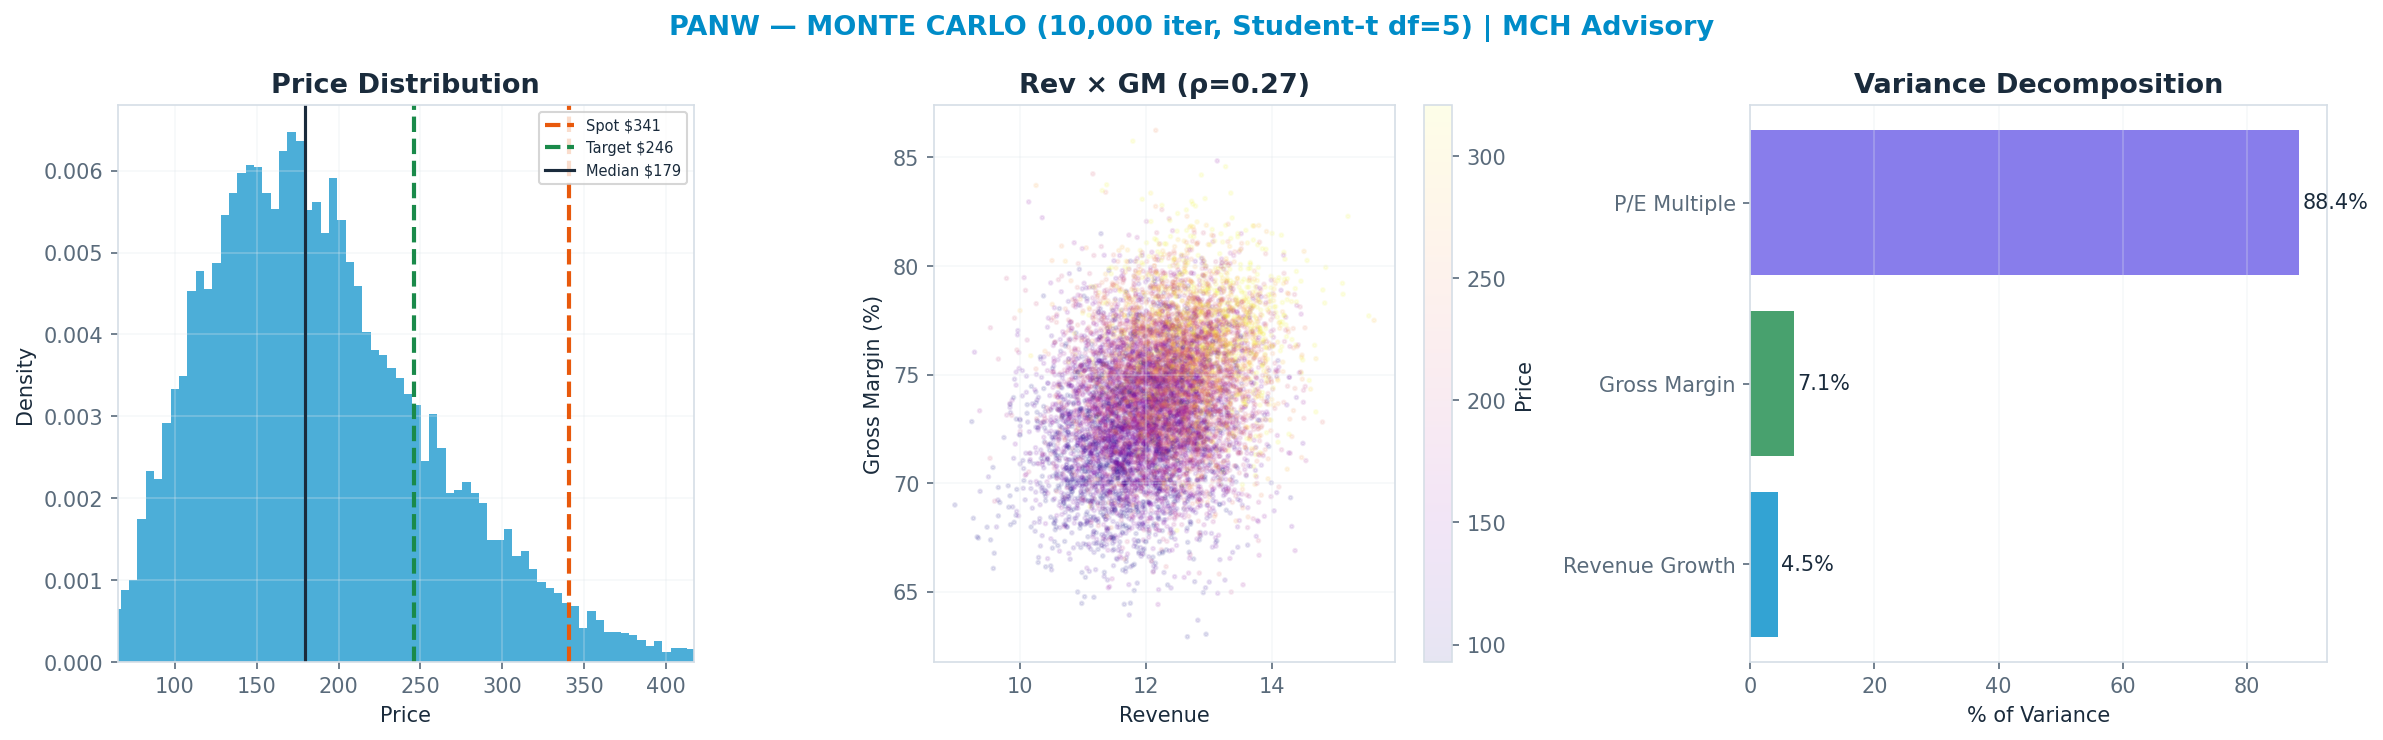
Monte Carlo — the distribution, not a point
10,000 paths, Student-t shocks (fat tails) with a regime-switching overlay. The median lands at $179 and 3% of paths finish above spot. The variance decomposition shows the p/e multiple is the dominant swing factor (88% of variance). Value is a multiple bet: fundamentals move the answer far less than the rating does.
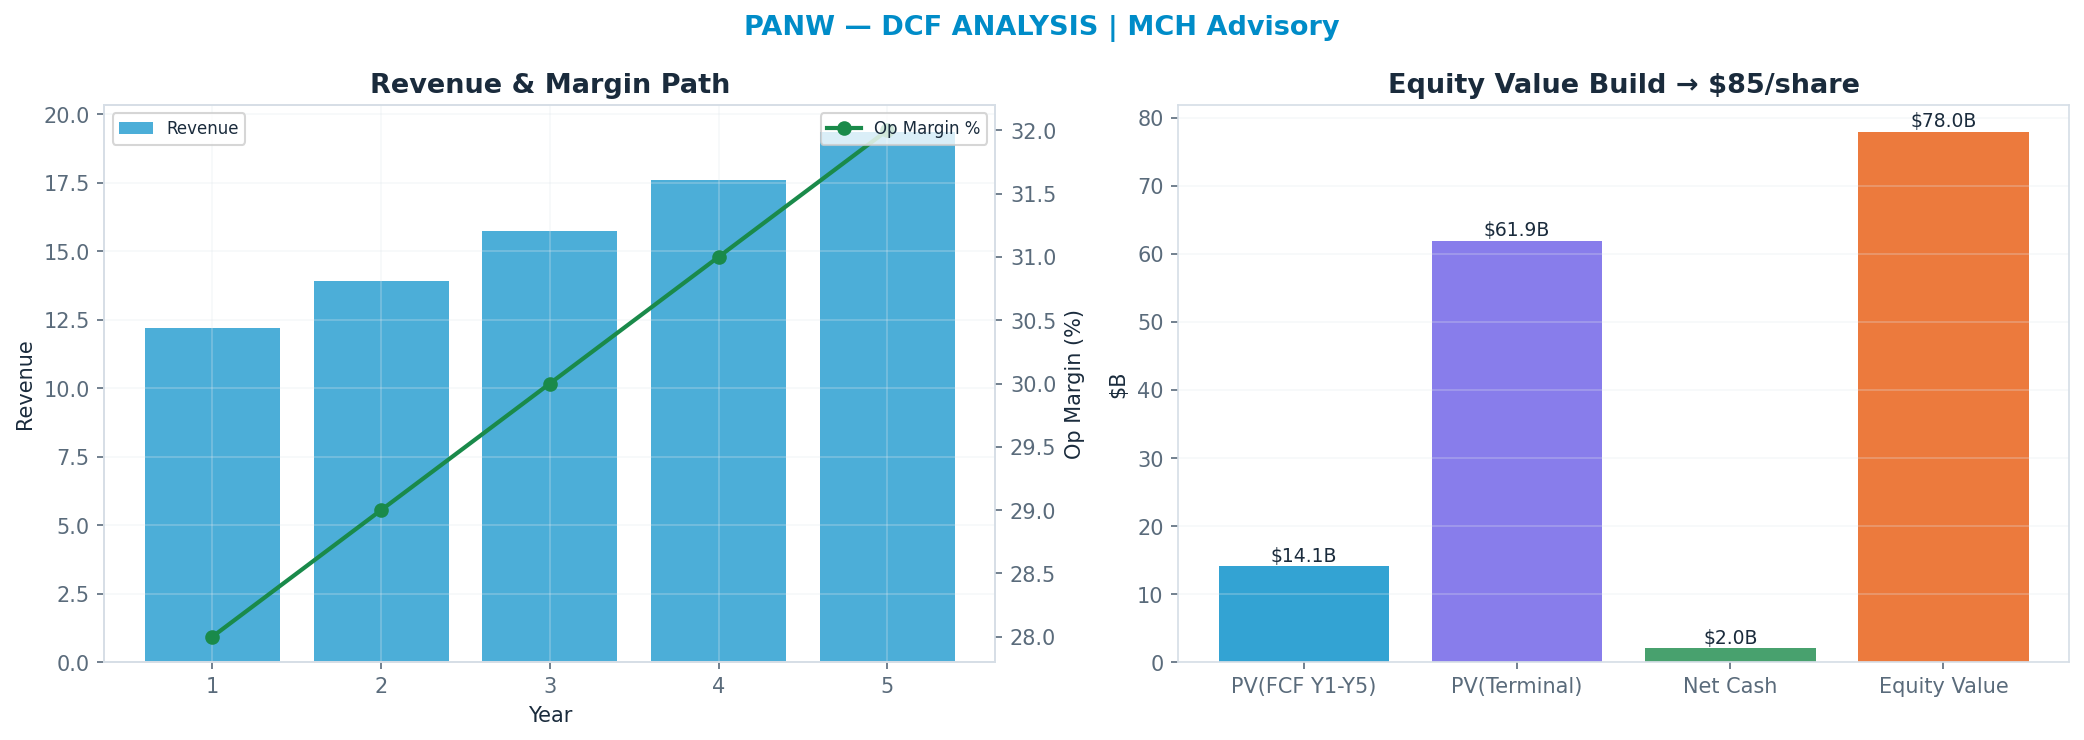
DCF — the cash-flow anchor
Independent of the market multiple: a 5-year path, WACC 9.5%, 20x terminal FCF multiple → $85. This anchor is deliberately the heaviest (41%): it is the valuation least hostage to the current multiple regime.
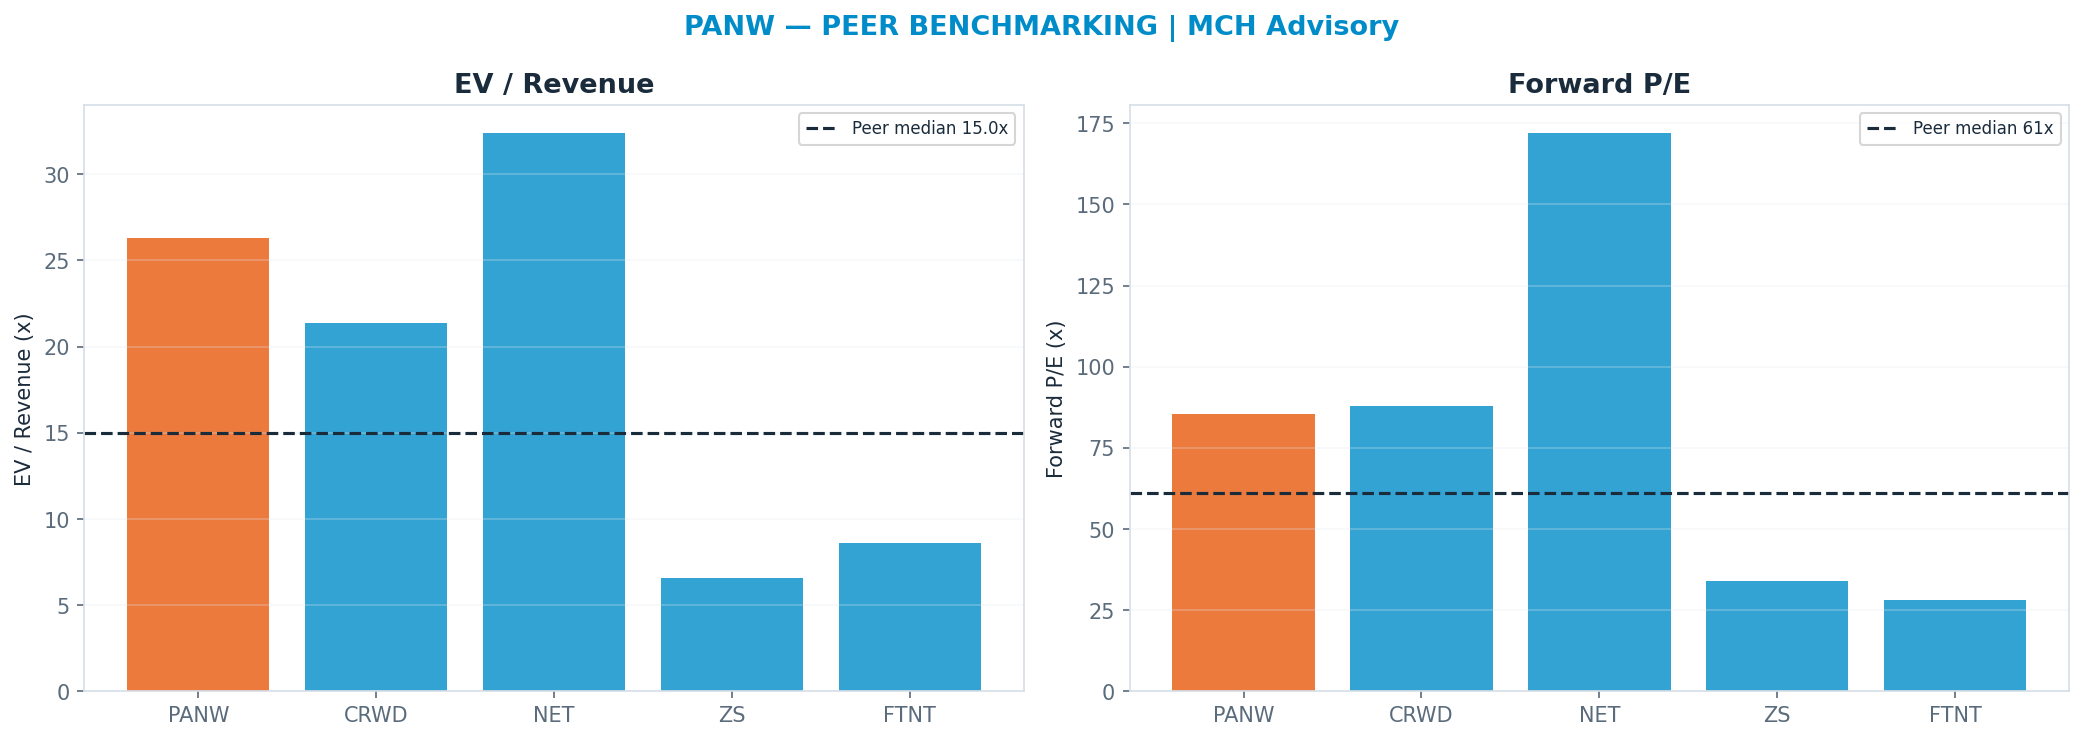
Peer benchmarking — relative value
Against the peer cohort, re-rating to the peer-median forward multiple (P/E 61.0x) implies $243. A premium is only justified by superior growth/margins; otherwise it is multiple risk. Weighted just 12% so the market's mood does not drive the fair value.
Across all anchors the spread is wide (genuine disagreement — low valuation confidence).
Revenue-Segment Breakdown
The company-specific drivers behind the valuation — each segment carries its own growth, margin, multiple and capex intensity. (Tags: FACT reported · ESTIMATE from disclosures · INFERENCE judgment.)
| Segment | Revenue | Mix | Growth | Op margin | Multiple | Capex % | Tag |
|---|---|---|---|---|---|---|---|
| Strata (Network Security) | $5.6B | 53% | 8% | 30% | 8x | 2% | FACT/ESTIMATE |
| Prisma (Cloud Security) | $2.7B | 25% | 22% | 24% | 13x | 2% | FACT/ESTIMATE |
| Cortex (Security Operations) | $2.3B | 22% | 30% | 22% | 14x | 2% | FACT/ESTIMATE |
AI revenue, decomposed — the AI lines broken out (Azure-AI / Copilot / model-API / pass-through style), so the AI contribution is auditable:
| AI line | Run-rate | Growth | Gross margin | Capex % | Tag |
|---|---|---|---|---|---|
| Cortex XSIAM (AI SecOps platform) | $1.2B | 40% | 70% | 3% | ESTIMATE |
| Precision AI subscriptions | $0.4B | 45% | 65% | 3% | ESTIMATE |
- Cortex XSIAM (AI SecOps platform): AI-driven security-operations platform — autonomous detection/response. Fastest-growing AI-led pillar; a SUBSET of Cortex, not additive to total
- Precision AI subscriptions: AI-powered security services attached across Strata/Prisma/Cortex; framed as an attach uplift, NOT the majority of revenue
Named Exposures
Platformization bet & competition (ESTIMATE/INFERENCE)
| Dimension | Assessment |
|---|---|
| Strategy | Give away / heavily discount product (free periods, ramped deals) to win multi-year consolidation onto Strata/Prisma/Cortex; bets near-term billings for long-term NGS ARR + lock-in |
| Billings / deferred-revenue optics | Ramped and deferred deal structures depress current billings and flatter future RPO — billings growth understates and RPO overstates near-term momentum; quality-of-bookings is harder to read |
| NGS ARR dependence | Thesis rests on NGS ARR compounding (~$5B+ run-rate, ~30%+ growth est.) as legacy firewall hardware decelerates |
| Direct competition | CrowdStrike (CRWD) in endpoint/SecOps, Zscaler (ZS) in SASE/cloud — both faster-growing, cloud-native, with their own consolidation pitches |
| Microsoft bundling | Microsoft Defender / Entra / Sentinel bundled into E5 is the structural threat — security 'good enough and free-with-the-suite' compresses standalone willingness-to-pay across all three platforms |
| Free-product risk | If consolidation discounts do not convert to durable expansion (NRR), the give-away erodes margin without buying share |
Valuation / multiple-compression risk (ESTIMATE/INFERENCE)
| Dimension | Assessment |
|---|---|
| Forward multiple | ~70x forward P/E at ~$285 — a premium typically reserved for 25%+ growers |
| Growth vs multiple gap | Revenue growth decelerating toward ~15-20% — the multiple is not supported by the headline growth rate and leans on FCF + NGS ARR durability |
| EV/Revenue | ~7-8x forward revenue (est.) — rich vs the deceleration |
| Re-rating risk | Any NGS ARR or RPO miss, billings disappointment, or sector multiple compression de-rates a high-multiple, mid-teens grower sharply |
| FCF quality | High non-GAAP FCF margin is partly financed by customer prepayments / deferred revenue — disclose SBC intensity alongside before crediting FCF as a virtue |
Industry Context — Enterprise Software (premium SaaS)
This name sits in the Enterprise Software (premium SaaS) as a cybersecurity platform (Strata/Prisma/Cortex). AI = Precision AI / Cortex SecOps; most exposed to Microsoft security bundling and to AI-native disruptors; very high multiple. Its scenarios are not guessed in isolation — they inherit a single, shared view of the cluster's driver cycle, so the names that depend on the same event are mutually consistent.
Value chain: NOW (workflow platform (ITSM/HR/CSM + Now Assist)) · PANW (cybersecurity platform (Strata/Prisma/Cortex)) · PLTR (AI/data platform (AIP, Gov + Commercial))
| Shared state | Capex path | House view | This name implies |
|---|---|---|---|
| SaaS De-rate / AI Disruption | multiple compression + AI-native/MSFT disruption | 25% | 20% |
| Budget Digestion | enterprise IT spend softens | 18% | 22% |
| Steady Monetization | AI adds modestly; multiples hold | 37% | 38% |
| AI Monetization Inflection | AI becomes a major revenue line; re-rate | 20% | 20% |
On the cluster's key downside — SaaS De-rate / AI Disruption (multiple compression + AI-native/MSFT disruption) — this name implies 20% vs the cluster house view of 25% (in line with the house). The cluster's full cross-stock reconciliation governs that the names which ride the same capex cycle assign it comparable odds.
Structure: Spend Cycle — Enterprise IT/software budgets — resilient but cyclical; AI is currently additive to budgets, a risk if it later substitutes. (INFERENCE) Ai Monetization — Open question across the group: does GenAI become a durable premium SKU (Now Assist, Cortex, AIP) or does it commoditize/compress software value? (INFERENCE) Multiple Regime — All three trade at premium-to-extreme forward multiples; a SaaS de-rating compresses the whole group together. (FACT) Competition — Microsoft bundling (Copilot, Sentinel/Defender, Power Platform) is the shared distribution-power threat; AI-native startups are the disruption tail. (INFERENCE)
Model Appendix
DCF — line items
| Year | Revenue | Op income | − Capex | + D&A | FCF | PV(FCF) |
|---|---|---|---|---|---|---|
| FY+1 | $12B | $3B | $0B | $0B | $3B | $2B |
| FY+2 | $14B | $4B | $0B | $0B | $3B | $3B |
| FY+3 | $16B | $5B | $0B | $0B | $4B | $3B |
| FY+4 | $18B | $5B | $0B | $0B | $4B | $3B |
| FY+5 | $19B | $6B | $0B | $0B | $5B | $3B |
| Terminal | — | — | — | — | $5B × 20x | $62B |
FCF is bridged: NOPAT + D&A − Capex − ΔNWC (capex intensity 2% of revenue, weighted from the segments) — not a single conversion fudge.
WACC 9.5% · Σ PV(FCF) $14B + PV(terminal) $62B = EV $76B; + net cash → equity $78B ÷ diluted shares 0.92B = $85/share (exit-multiple terminal).
- Gordon (perpetuity-growth) terminal at 2.5% → $67/share — a genuinely non-multiple, cash-based cross-check; the exit-multiple and Gordon values bracket the terminal-value risk.
- Incremental ROIC on the forecast capex ≈ 141% vs WACC 10% → above WACC — the build is value-creative.
Peer set
| Peer | EV/Rev | Fwd P/E | Growth | Op margin |
|---|---|---|---|---|
| CRWD | 21.4x | 88x | 23% | 22% |
| NET | 32.4x | 172x | 34% | 13% |
| ZS | 6.6x | 34x | 23% | 22% |
| FTNT | 8.6x | 28x | 15% | 33% |
| Median | 15.0x | 61.0x | — | — |
Peer-median fwd P/E → $243; EV/Rev → $198.
Weighted fair-value math
| Anchor | Value | Weight | Contribution |
|---|---|---|---|
| Scenario PWEV | $246 | 50% | $123 |
| Monte Carlo median | $179 | 30% | $54 |
| Peer P/E | $243 | 20% | $49 |
| Triangulated | — | 100% | $226 |
Sensitivity
DCF/share — WACC × terminal multiple
| WACC \ Term× | 14.0x | 17.0x | 20.0x | 23.0x | 26.0x |
|---|---|---|---|---|---|
| 8% | $70 | $81 | $92 | $103 | $114 |
| 8% | $67 | $78 | $88 | $99 | $109 |
| 10% | $64 | $75 | $85 | $95 | $105 |
| 10% | $62 | $72 | $81 | $91 | $100 |
| 12% | $60 | $69 | $78 | $87 | $96 |
DCF/share — revenue CAGR Δ × op-margin Δ
| CAGRΔ \ MgnΔ | -3.0pp | -1.5pp | +0.0pp | +1.5pp | +3.0pp |
|---|---|---|---|---|---|
| -3.0pp | $68 | $72 | $75 | $79 | $82 |
| -1.5pp | $72 | $76 | $80 | $83 | $87 |
| +0.0pp | $77 | $81 | $85 | $89 | $93 |
| +1.5pp | $81 | $85 | $90 | $94 | $98 |
| +3.0pp | $86 | $91 | $95 | $99 | $104 |
Tornado — DCF/share swing by driver (widest first)
| Driver | Low | High | Swing |
|---|---|---|---|
| Terminal × ±15% | $75 | $95 | $20 |
| Revenue CAGR ±3pp | $75 | $95 | $20 |
| Op margin ±3pp | $77 | $93 | $16 |
| WACC ±1pp | $81 | $88 | $7 |
| FCF conversion ±10% | $85 | $85 | $0 |
Company lever — SoP/share vs Strata (Network Security) multiple (AI re-rating) (base 8x)
| Multiple | 5.6x | 6.8x | 8.0x | 9.2x | 10.4x |
|---|---|---|---|---|---|
| SoP/share | $124 | $132 | $140 | $148 | $156 |
Load-Bearing Assumptions
DCF: WACC 10%, terminal multiple 20×, FY+5 revenue $19B. Triangulation leans 41% on DCF, 29% on PWEV.
Reasons the Thesis Could Fail (Falsifiable)
P(>current)=3.3% below 30% band — bear weighting or opex may be too severe; verify. The valuation is multiple-dependent (88% of variance); a de-rating toward the DCF anchor ($85) implies -75%.
Fact / Inference / Speculation
- FACT: Spot $341; 52-week range $140–$303; engine rating SELL; base-case target $246 (-28%).
- INFERENCE: Triangulated FV $226 (-34%). P/E Multiple explains 88% of Monte Carlo outcome variance — i.e. value is set by the multiple the market will pay, a rate/sentiment regime bet as much as an earnings bet.
- SPECULATION: At current prices the embedded bet is that the multiple holds or expands — P/E Multiple carries 88% of outcome variance.
Recommendation: SELL
Defensive: rating SELL; triangulated fair value $168 (-51% vs spot) — the risk/reward is skewed to the downside on P/E Multiple. The debate is P/E Multiple (88% of variance) — fundamentally a multiple/regime call. SBC runs 1520M TTM (disclosed in the appendix).