Rating: HOLD
| Metric | Value |
|---|---|
| Current Price | $6,813 |
| Triangulated Fair Value | $6,179 |
| 12-mo Scenario PWEV | $6,693 |
| Implied Return | -9% |
| Forward P/E | 16.3x |
| Market Cap | $20B |
| 52-Week Range | $5,501 – $8,618 |
Methodology: Valuation triangulated across five independent anchors — Monte Carlo (Student-t + regime switching), an independent DCF, peer re-rating, a sum-of-parts, and a scenario-weighted PWEV. Figures reconciled to Alpha Vantage 2026-06-26. Each chart below sits with the part of the thesis it evidences.
Investment Thesis
The bull case — 'Spike — Tight Supply Pricing' (8% weight) — targets $13,532, +99% vs spot. It needs the multiple to hold or expand.
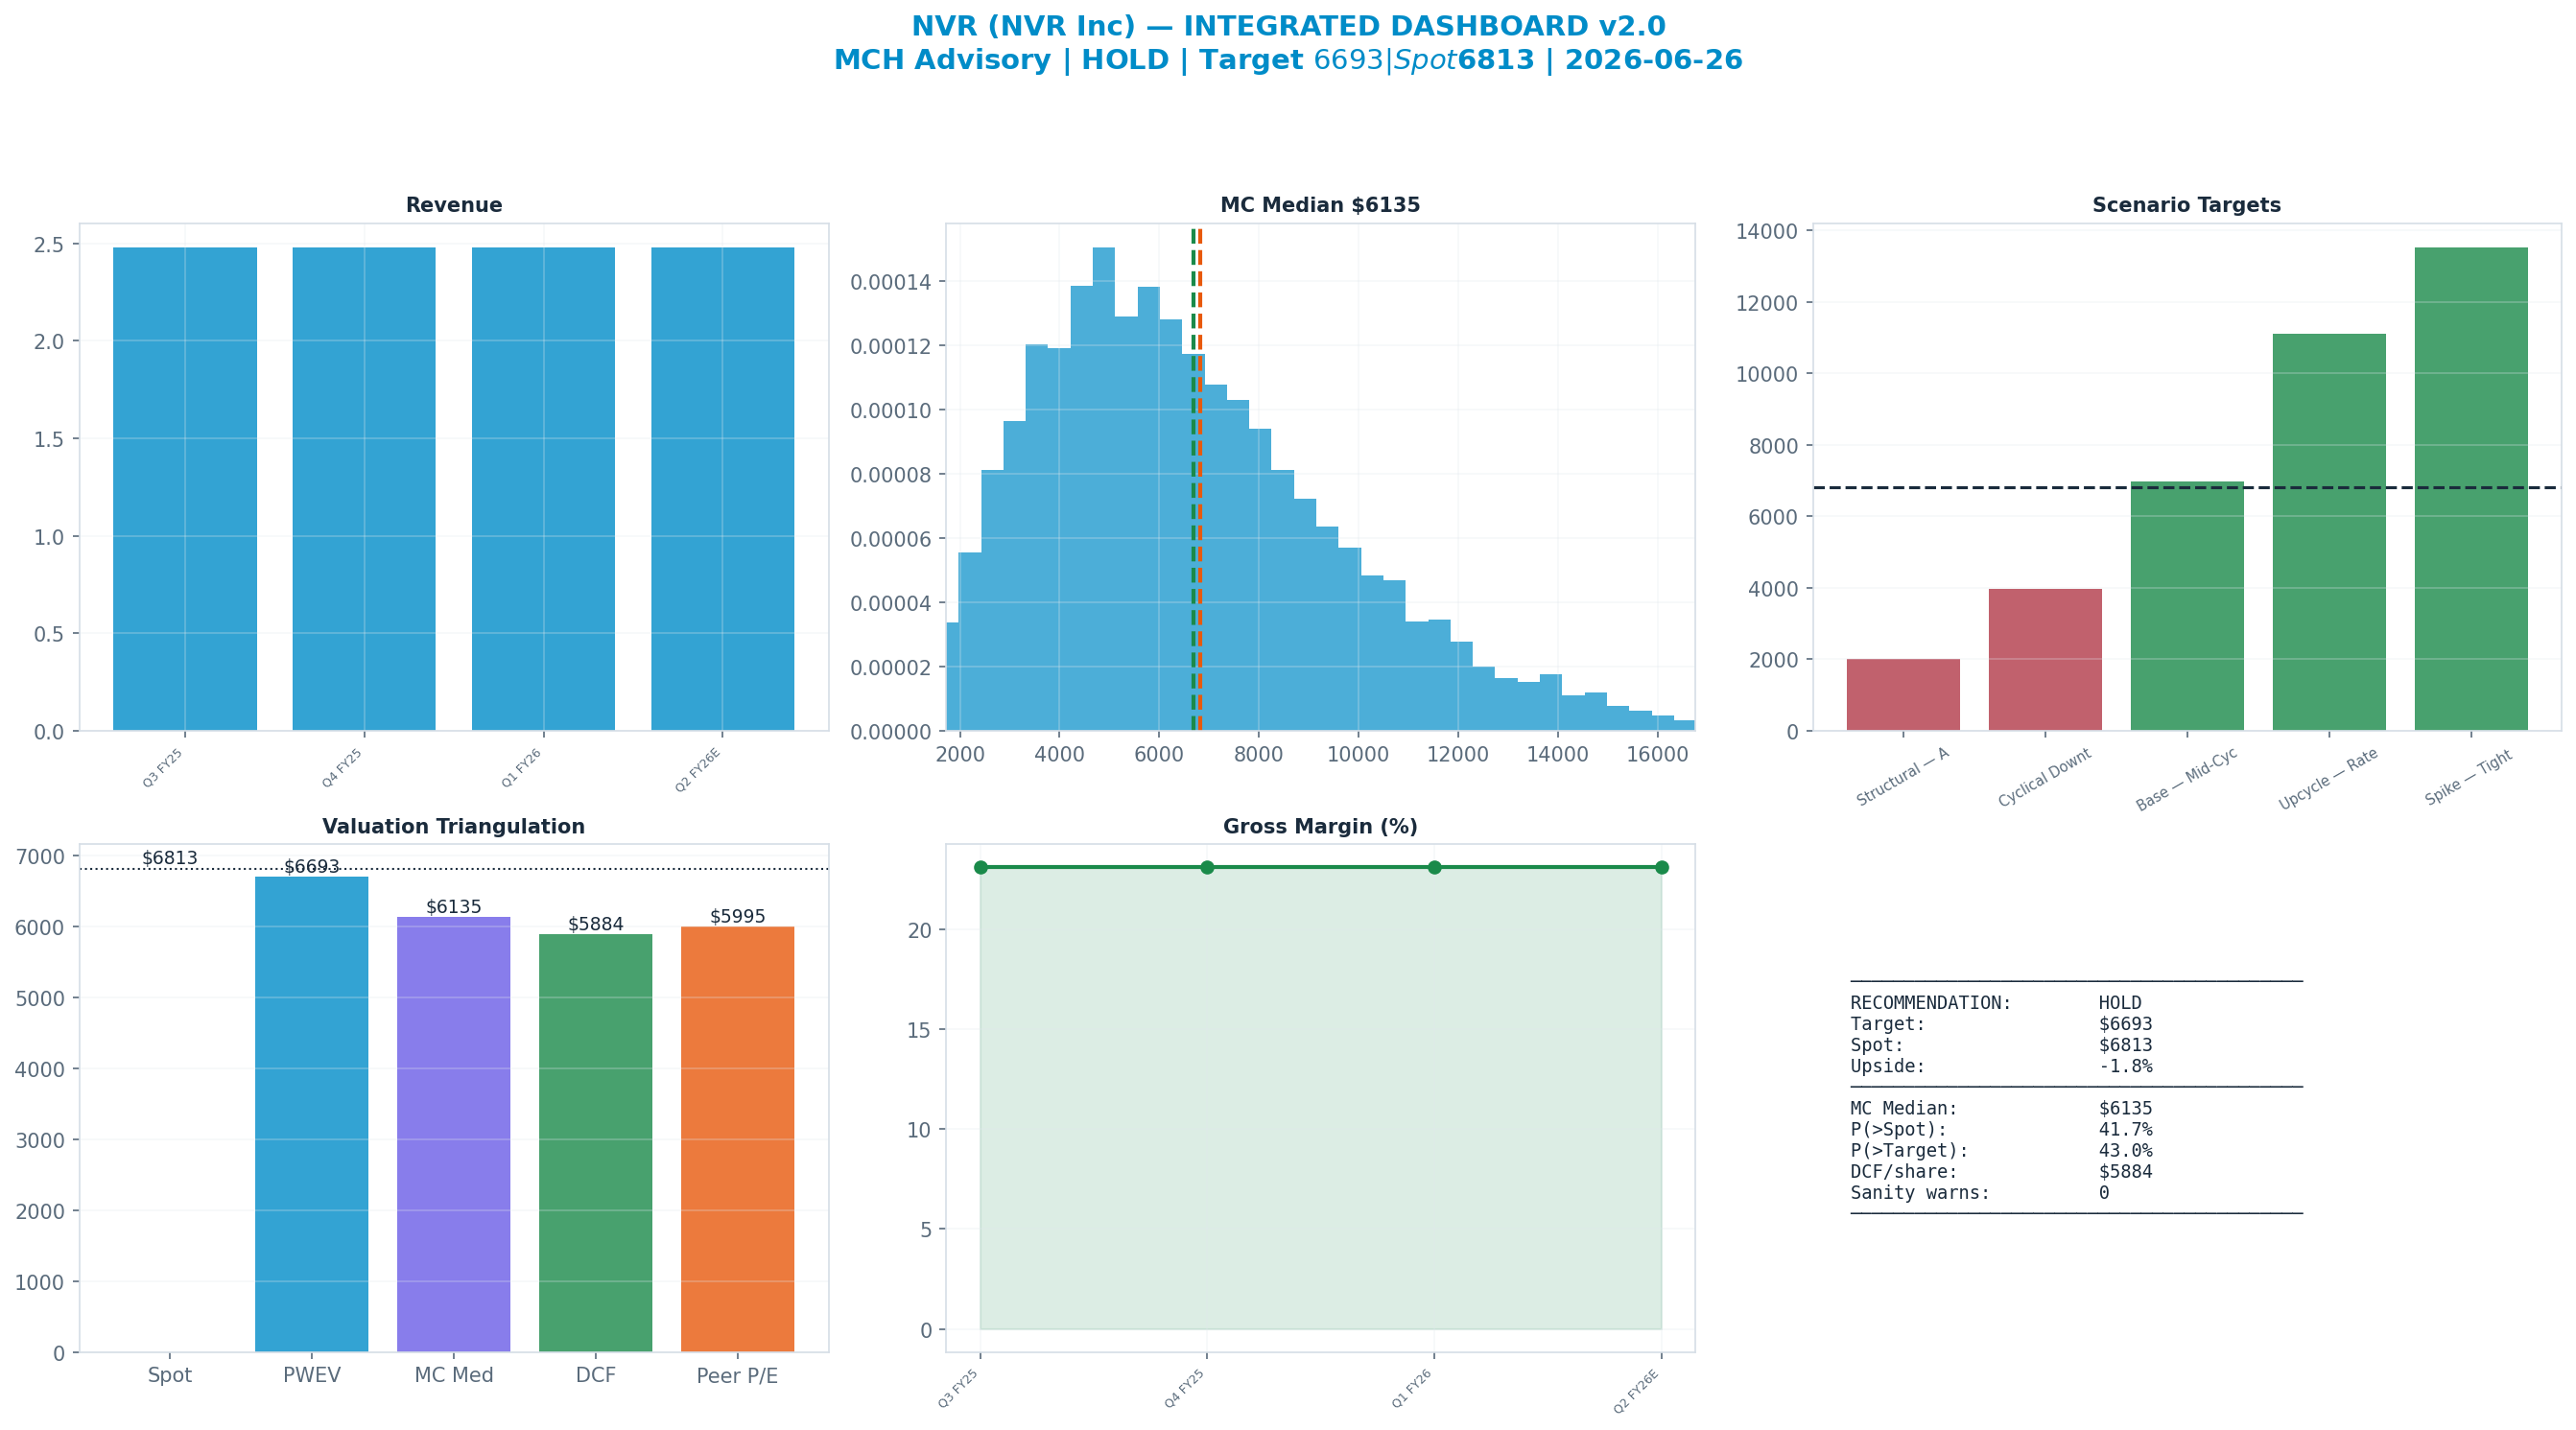
The dashboard below is the whole argument on one page: spot ($6,813) against each valuation anchor, the scenario tree, technicals and the options-implied move.
Anti-Thesis (The Real Bear Case)
The structural case — 'Structural — Affordability / Rate-Lock Demand Reset' (22%) — targets $2,008, -71% vs spot. This sits below the 52-week low — a genuine structural impairment, not a mild pullback.
Key Debate
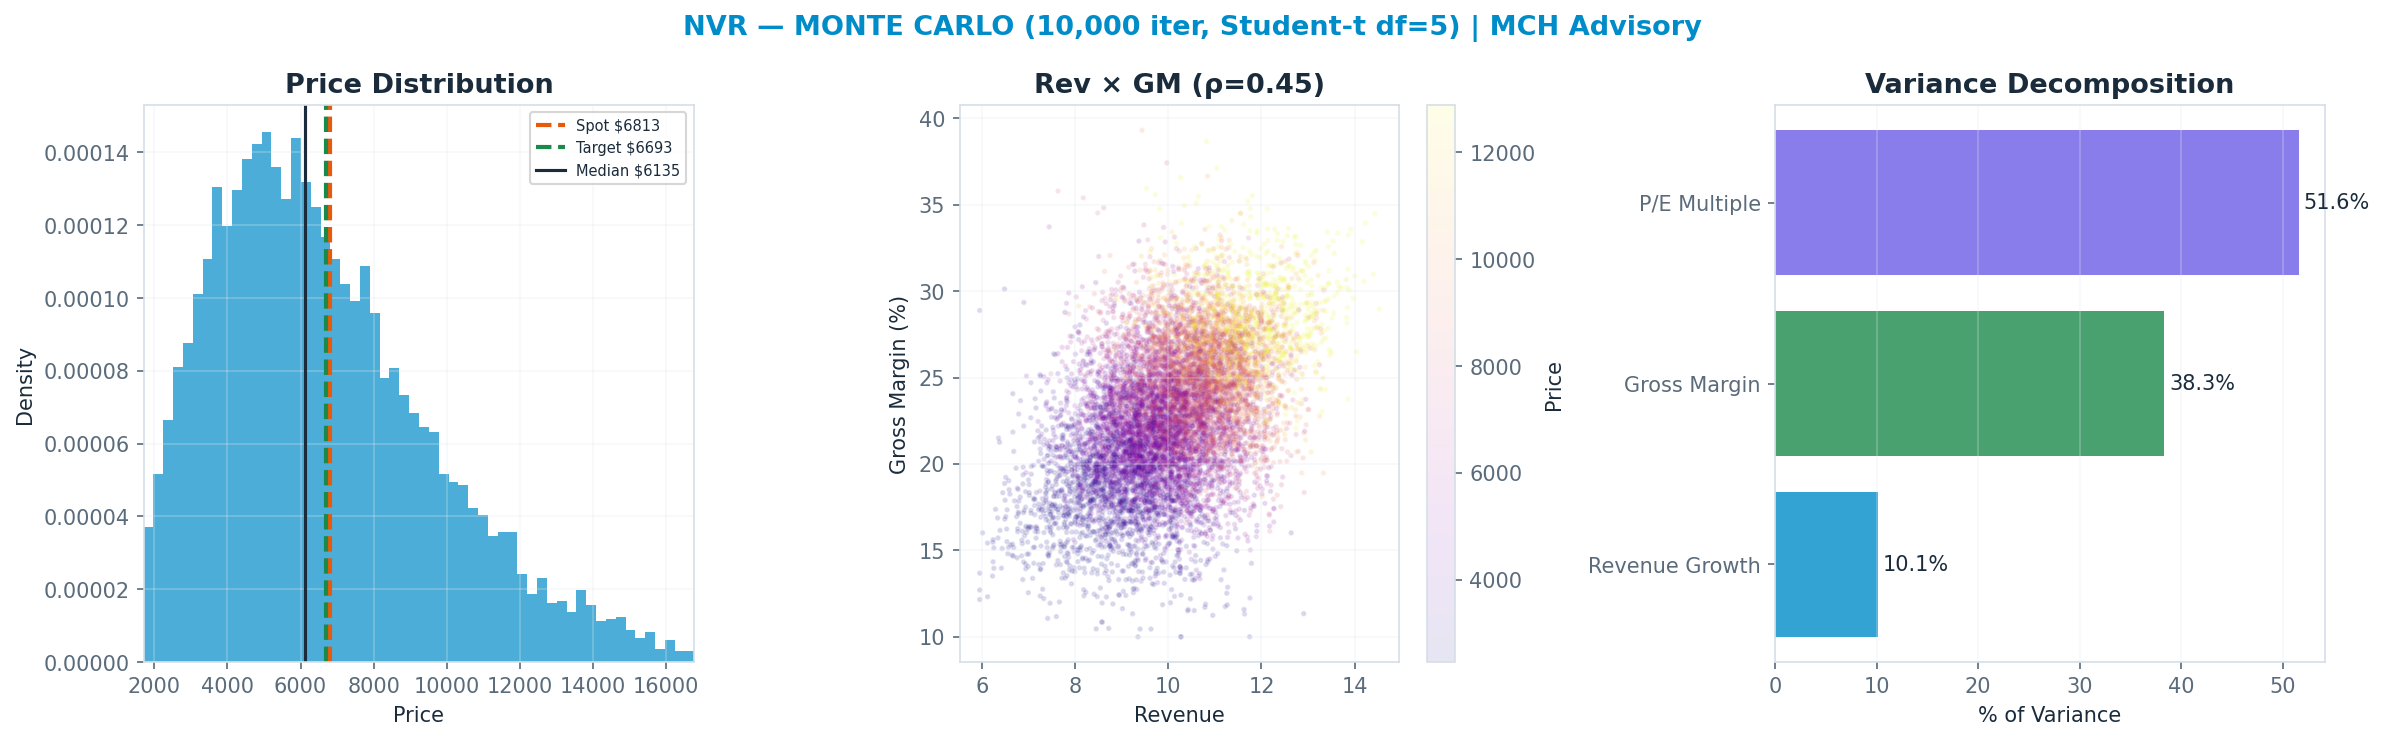
P/E Multiple explains 52% of Monte Carlo outcome variance — i.e. value is set by the multiple the market will pay, a rate/sentiment regime bet as much as an earnings bet.
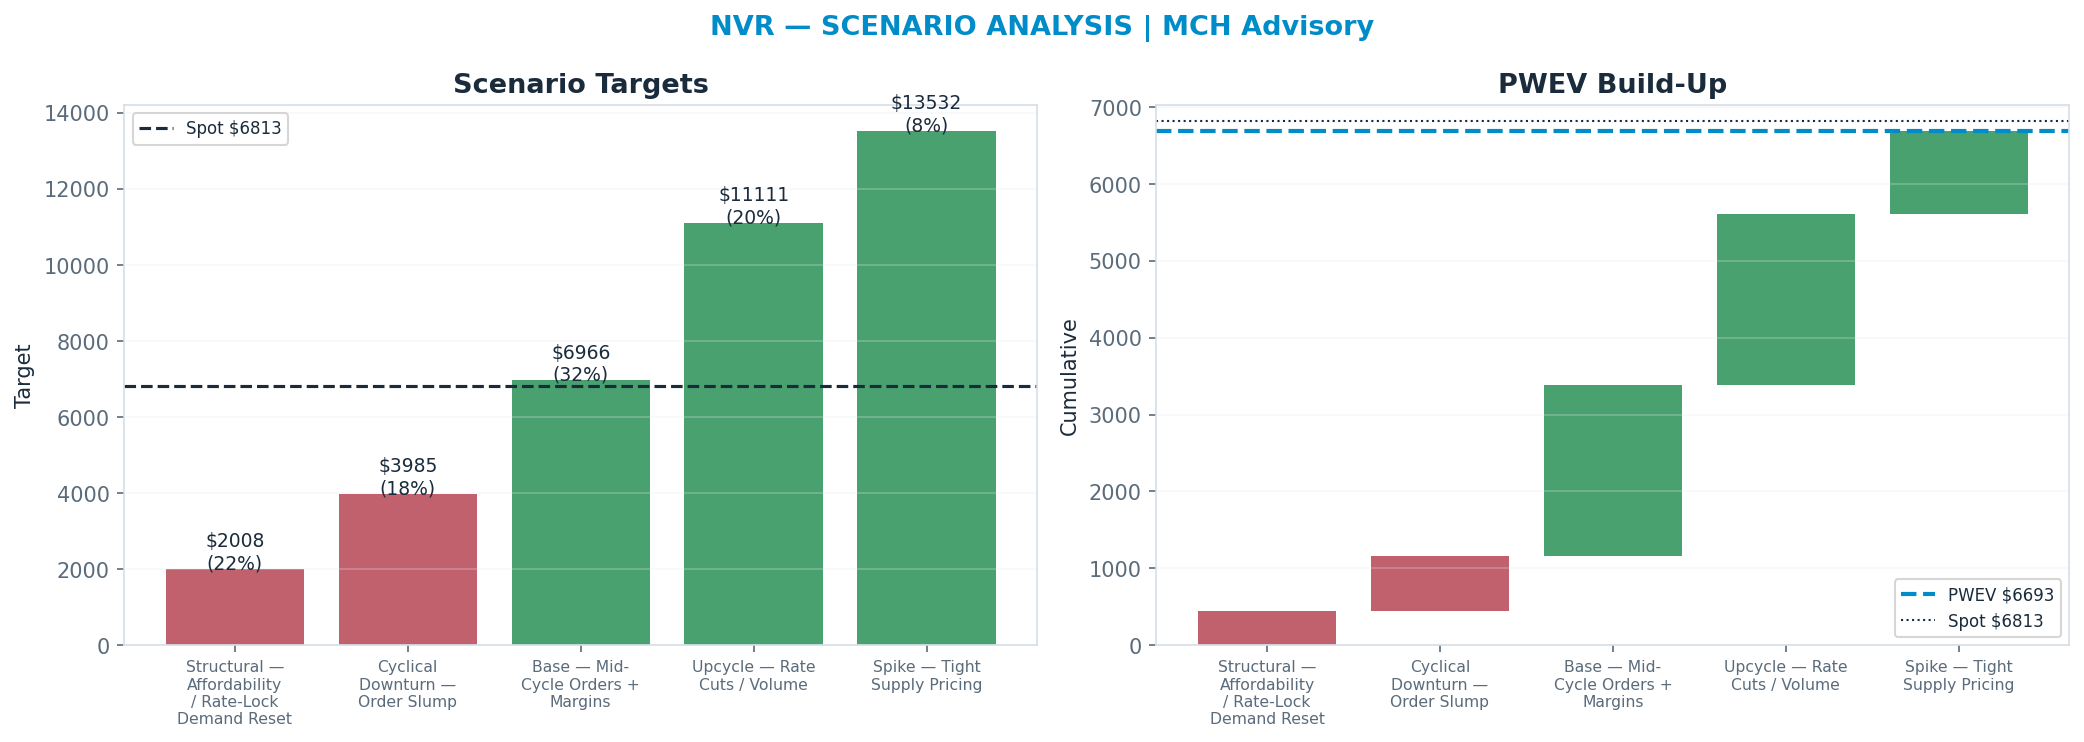
Scenario Analysis
The tree runs from a structural 'Structural — Affordability / Rate-Lock Demand Reset' downside ($2,008) to a 'Spike — Tight Supply Pricing' bull case ($13,532); the probability-weighted blend (PWEV $6,693) is -2% versus spot.
| Scenario | Probability | Target | Return |
|---|---|---|---|
| Structural — Affordability / Rate-Lock Demand Reset | 22% | $2,008 | -71% |
| Cyclical Downturn — Order Slump | 18% | $3,985 | -42% |
| Base — Mid-Cycle Orders + Margins | 32% | $6,966 | +2% |
| Upcycle — Rate Cuts / Volume | 20% | $11,111 | +63% |
| Spike — Tight Supply Pricing | 8% | $13,532 | +99% |
| Probability-Weighted (PWEV) | — | $6,693 | -2% |
Scenario rationale — what each probability buys (the driver path behind every target):
- Structural — Affordability / Rate-Lock Demand Reset (22%, $2,008). Structural impairment — affordability / rate-lock demand reset: earnings AND the multiple compress together. Target sits below the 52-week low by construction. Drivers — implied_target: 2007.94; probability: 0.22.
- Cyclical Downturn — Order Slump (18%, $3,985). Cyclical downturn — new-home demand (rates, affordability, household formation) + gross-margin cycle weakens for 1–2 years before normalising. Drivers — implied_target: 3984.78; probability: 0.18.
- Base — Mid-Cycle Orders + Margins (32%, $6,966). Mid-cycle — normalised new-home demand (rates, affordability, household formation) + gross-margin cycle; disciplined capital allocation; steady returns. Drivers — implied_target: 6966.41; probability: 0.32.
- Upcycle — Rate Cuts / Volume (20%, $11,111). Upside — rate cuts + volume recovery lifts earnings above mid-cycle; the multiple expands modestly. Drivers — implied_target: 11111.42; probability: 0.2.
- Spike — Tight Supply Pricing (8%, $13,532). Upside tail — sustained tight conditions or a structural re-rate on rate cuts + volume recovery. Drivers — implied_target: 13532.24; probability: 0.08.
Valuation Triangulation
Five anchors — but read them with their basis in mind. The Monte Carlo, the DCF terminal, and the peer re-rate all key off a market multiple, so they are not fully independent; only the discounted cash flows themselves are genuinely multiple-free. The discipline is to read the spread and weight the cash-based view, not to treat five numbers as five independent votes.
| Method | Basis | Fair Value | vs Spot |
|---|---|---|---|
| Monte Carlo median (Student-t + regime) | multiple | $6,135 | -10% |
| Peer P/E re-rate | multiple | $5,995 | -12% |
| Peer EV/Revenue re-rate | multiple | $5,289 | -22% |
| Scenario PWEV | multiple | $6,693 | -2% |
| DCF (5-year + terminal) | cash flow + terminal × | $5,884 | -14% |
| Triangulated (weighted) | — | $6,179 | -9% |
Monte Carlo — the distribution, not a point
10,000 paths, Student-t shocks (fat tails) with a regime-switching overlay. The median lands at $6,135 and 42% of paths finish above spot. The variance decomposition shows the p/e multiple is the dominant swing factor (52% of variance). Value is a multiple bet: fundamentals move the answer far less than the rating does.
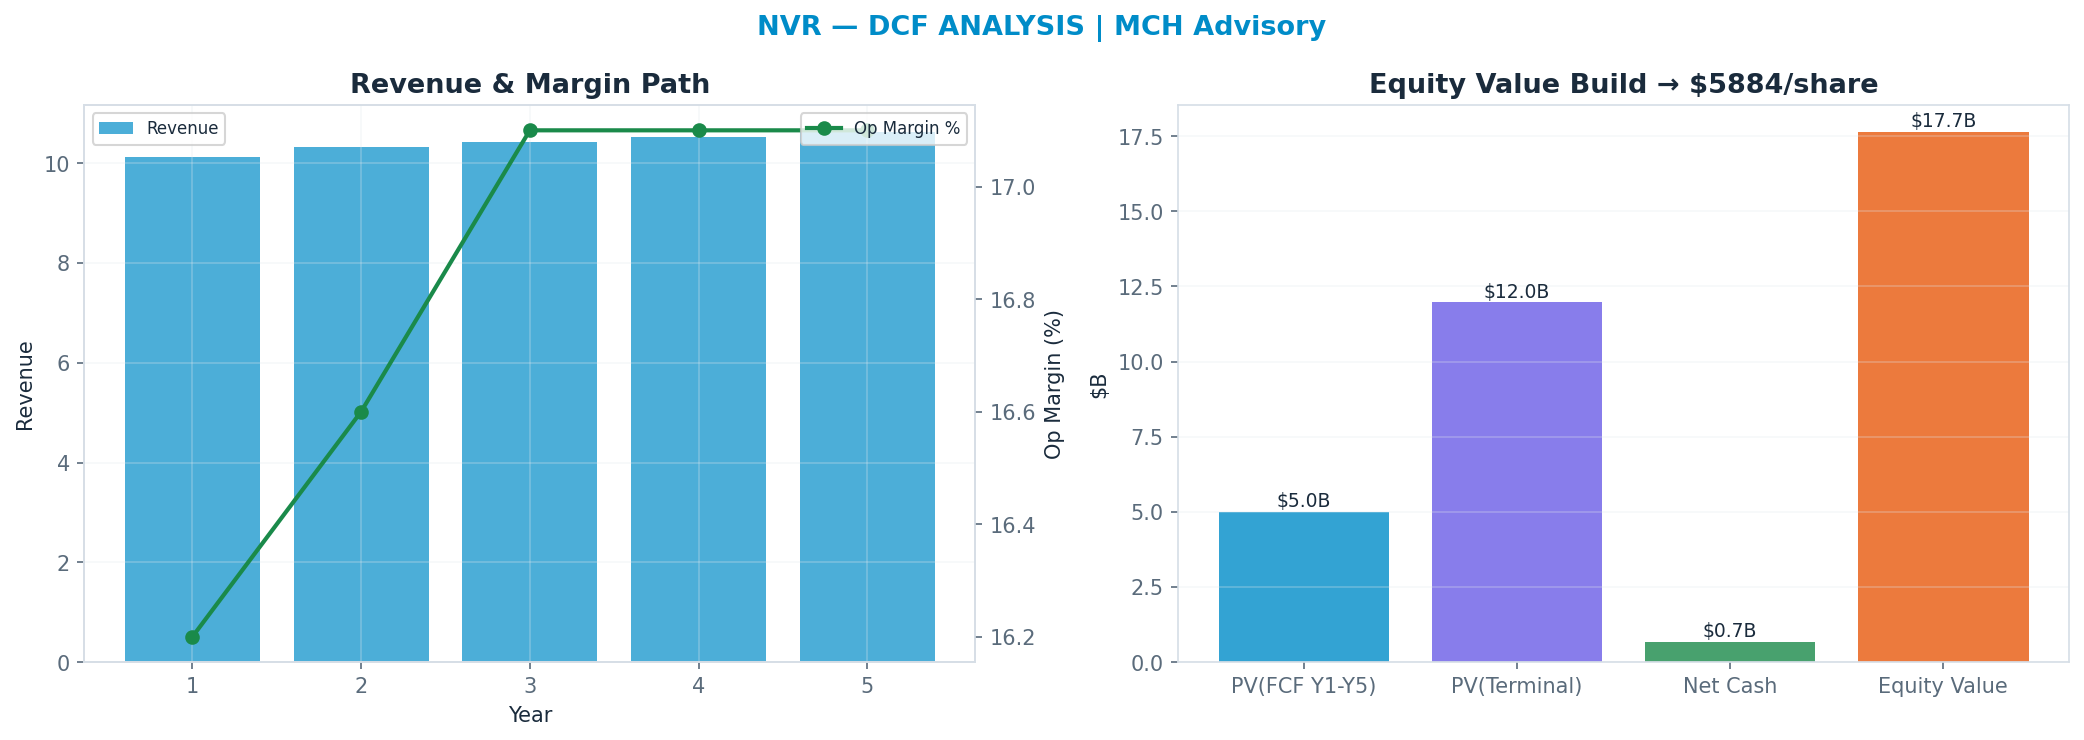
DCF — the cash-flow anchor
Independent of the market multiple: a 5-year path, WACC 10.0%, 14x terminal FCF multiple → $5,884. This anchor is deliberately the heaviest (41%): it is the valuation least hostage to the current multiple regime.
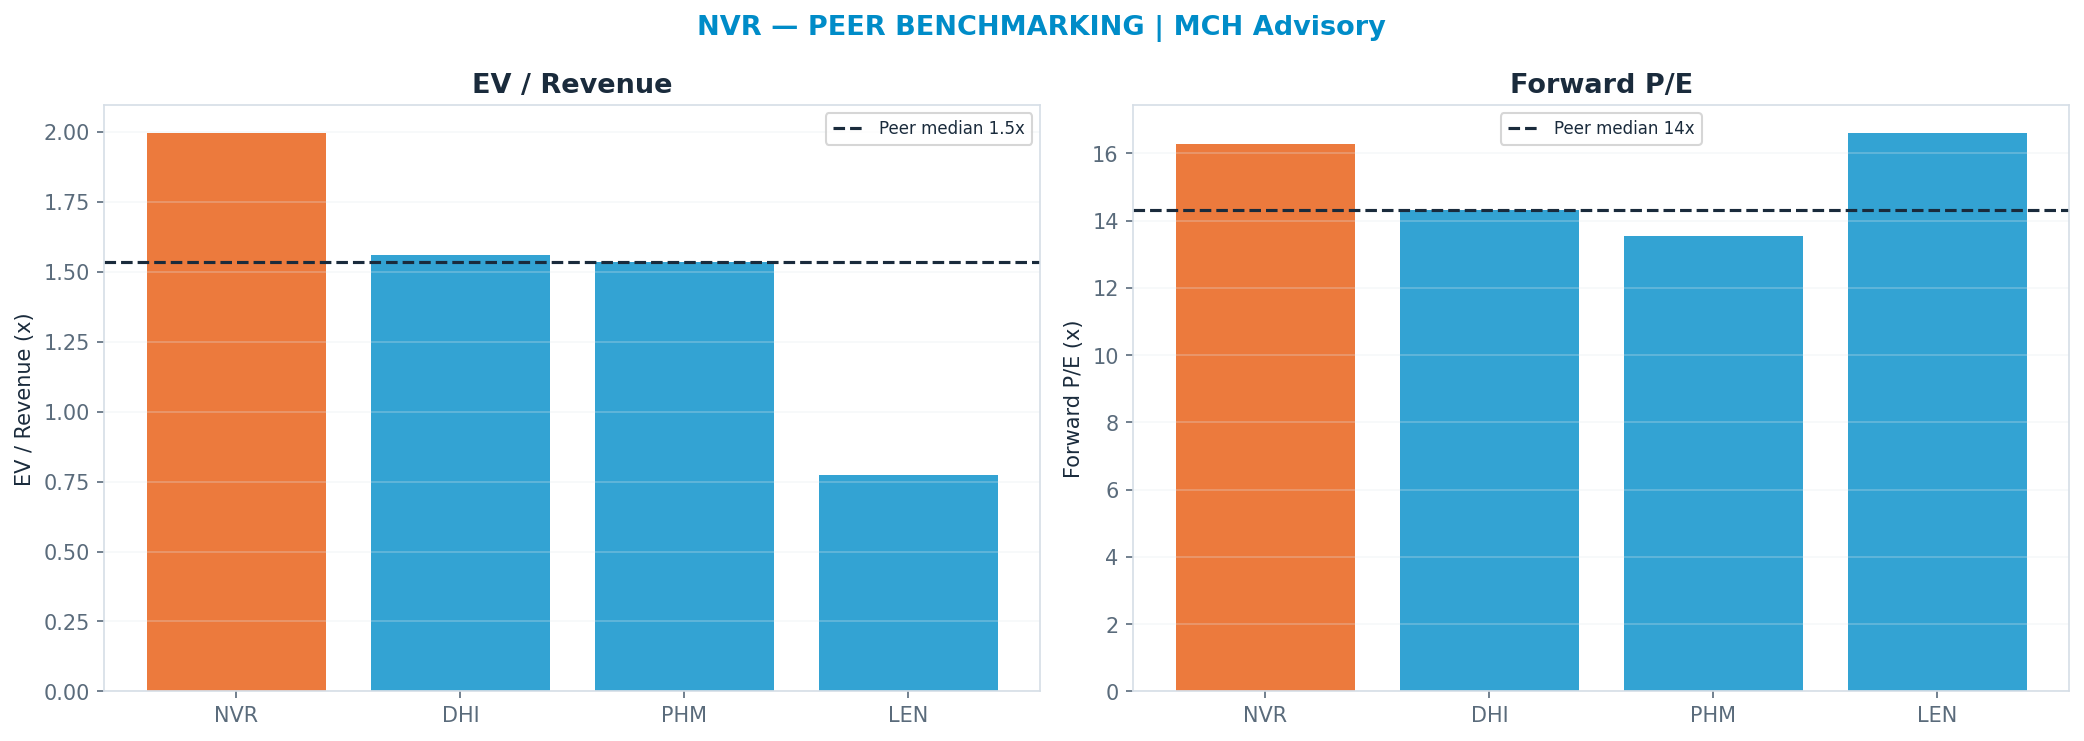
Peer benchmarking — relative value
Against the peer cohort, re-rating to the peer-median forward multiple (P/E 14.33x) implies $5,995. A premium is only justified by superior growth/margins; otherwise it is multiple risk. Weighted just 12% so the market's mood does not drive the fair value.
Across all anchors the spread is tight (the methods corroborate one another).
Revenue-Segment Breakdown
The company-specific drivers behind the valuation — each segment carries its own growth, margin, multiple and capex intensity. (Tags: FACT reported · ESTIMATE from disclosures · INFERENCE judgment.)
| Segment | Revenue | Mix | Growth | Op margin | Multiple | Capex % | Tag |
|---|---|---|---|---|---|---|---|
| Homebuilding | $9.9B | 100% | 2% | 17% | 16x | 2% | ESTIMATE |
Named Exposures
Demand & pricing cycle (FACT/ESTIMATE)
| Dimension | Assessment |
|---|---|
| driver | new-home demand (rates, affordability, household formation) + gross-margin cycle |
| net_debt_or_cash_b | 0.68 |
Capital intensity & shareholder returns (ESTIMATE)
| Dimension | Assessment |
|---|---|
| capex_pct_revenue | 0.02 |
| div_yield | None |
Structural risk vs optionality (INFERENCE)
| Dimension | Assessment |
|---|---|
| downside | affordability / rate-lock demand reset |
| upside | rate cuts + volume recovery |
Industry Context — Consumer Discretionary — Housing
This name sits in the Consumer Discretionary — Housing as a homebuilders. new-home demand (rates, affordability, household formation) + gross-margin cycle Its scenarios are not guessed in isolation — they inherit a single, shared view of the cluster's driver cycle, so the names that depend on the same event are mutually consistent.
Value chain: HD (home_improvement) · LOW (home_improvement) · DHI (homebuilders) · PHM (homebuilders) · LEN (homebuilders) · NVR (homebuilders)
| Shared state | Capex path | House view | This name implies |
|---|---|---|---|
| Housing Downturn — Affordability / Rate Lock | 39% | 40% | |
| Mid-Cycle — Repair-Remodel + Orders | 33% | 32% | |
| Recovery — Rate Cuts / Volume | 28% | 28% |
On the cluster's key downside — Housing Downturn — Affordability / Rate Lock () — this name implies 40% vs the cluster house view of 39% (in line with the house). The cluster's full cross-stock reconciliation governs that the names which ride the same capex cycle assign it comparable odds.
Structure: Shared State — The disc_housing cycle is the shared macro driver. Driver — housing turnover & new-home demand + interest rates + repair-remodel Dispersion — Members differ by cyclicality (quality compounders vs deep cyclicals).
Model Appendix
DCF — line items
| Year | Revenue | Op income | − Capex | + D&A | FCF | PV(FCF) |
|---|---|---|---|---|---|---|
| FY+1 | $10B | $2B | $0B | $0B | $1B | $1B |
| FY+2 | $10B | $2B | $0B | $0B | $1B | $1B |
| FY+3 | $10B | $2B | $0B | $0B | $1B | $1B |
| FY+4 | $11B | $2B | $0B | $0B | $1B | $1B |
| FY+5 | $11B | $2B | $0B | $0B | $1B | $1B |
| Terminal | — | — | — | — | $1B × 14x | $12B |
FCF is bridged: NOPAT + D&A − Capex − ΔNWC (capex intensity 2% of revenue, weighted from the segments) — not a single conversion fudge.
WACC 10.0% · Σ PV(FCF) $5B + PV(terminal) $12B = EV $17B; + net cash → equity $18B ÷ diluted shares 0.00B = $5,884/share (exit-multiple terminal).
- Gordon (perpetuity-growth) terminal at 2.5% → $5,789/share — a genuinely non-multiple, cash-based cross-check; the exit-multiple and Gordon values bracket the terminal-value risk.
- Incremental ROIC on the forecast capex ≈ 13% vs WACC 10% → above WACC — the build is value-creative.
Peer set
| Peer | EV/Rev | Fwd P/E | Growth | Op margin |
|---|---|---|---|---|
| DHI | 1.561x | 14.33x | 2% | 11% |
| PHM | 1.534x | 13.53x | 2% | 13% |
| LEN | 0.772x | 16.61x | 2% | 5% |
| Median | 1.534x | 14.33x | — | — |
Peer-median fwd P/E → $5,995; EV/Rev → $5,289.
Weighted fair-value math
| Anchor | Value | Weight | Contribution |
|---|---|---|---|
| DCF | $5,884 | 41% | $2,423 |
| Scenario PWEV | $6,693 | 29% | $1,969 |
| Monte Carlo median | $6,135 | 18% | $1,083 |
| Peer P/E | $5,995 | 12% | $705 |
| Triangulated | — | 100% | $6,179 |
Sensitivity
DCF/share — WACC × terminal multiple
| WACC \ Term× | 9.8x | 11.9x | 14.0x | 16.1x | 18.2x |
|---|---|---|---|---|---|
| 8% | $5,046 | $5,702 | $6,357 | $7,013 | $7,669 |
| 9% | $4,862 | $5,488 | $6,114 | $6,740 | $7,367 |
| 10% | $4,687 | $5,285 | $5,884 | $6,482 | $7,080 |
| 11% | $4,521 | $5,093 | $5,665 | $6,236 | $6,808 |
| 12% | $4,363 | $4,910 | $5,457 | $6,003 | $6,550 |
DCF/share — revenue CAGR Δ × op-margin Δ
| CAGRΔ \ MgnΔ | -3.0pp | -1.5pp | +0.0pp | +1.5pp | +3.0pp |
|---|---|---|---|---|---|
| -3.0pp | $4,359 | $4,798 | $5,238 | $5,678 | $6,118 |
| -1.5pp | $4,613 | $5,083 | $5,552 | $6,022 | $6,491 |
| +0.0pp | $4,882 | $5,383 | $5,884 | $6,384 | $6,885 |
| +1.5pp | $5,165 | $5,699 | $6,233 | $6,767 | $7,301 |
| +3.0pp | $5,464 | $6,033 | $6,601 | $7,170 | $7,739 |
Tornado — DCF/share swing by driver (widest first)
| Driver | Low | High | Swing |
|---|---|---|---|
| Op margin ±3pp | $4,882 | $6,885 | $2,003 |
| Revenue CAGR ±3pp | $5,238 | $6,601 | $1,363 |
| Terminal × ±15% | $5,285 | $6,482 | $1,196 |
| WACC ±1pp | $5,665 | $6,114 | $450 |
| FCF conversion ±10% | $5,884 | $5,884 | $0 |
Company lever — SoP/share vs Homebuilding multiple (AI re-rating) (base 16x)
| Multiple | 11.2x | 13.6x | 16.0x | 18.4x | 20.8x |
|---|---|---|---|---|---|
| SoP/share | $37,187 | $45,107 | $53,027 | $60,947 | $68,867 |
Load-Bearing Assumptions
DCF: WACC 10%, terminal multiple 14×, FY+5 revenue $11B. Triangulation leans 41% on DCF, 29% on PWEV.
Reasons the Thesis Could Fail (Falsifiable)
The valuation is multiple-dependent (52% of variance); a de-rating toward the DCF anchor ($5,884) implies -14%.
Fact / Inference / Speculation
- FACT: Spot $6,813; 52-week range $5,501–$8,618; engine rating HOLD; base-case target $6,693 (-2%).
- INFERENCE: Triangulated FV $6,179 (-9%). P/E Multiple explains 52% of Monte Carlo outcome variance — i.e. value is set by the multiple the market will pay, a rate/sentiment regime bet as much as an earnings bet.
- SPECULATION: At current prices the embedded bet is that the multiple holds or expands — P/E Multiple carries 52% of outcome variance.
Recommendation: HOLD
Balanced: triangulated fair value $6,179 (-9% vs spot); the outcome hinges on P/E Multiple. The debate is P/E Multiple (52% of variance) — fundamentally a multiple/regime call. SBC runs —M TTM (disclosed in the appendix).