Rating: HOLD
| Metric | Value |
|---|---|
| Current Price | $99 |
| Triangulated Fair Value | $94 |
| 12-mo Scenario PWEV | $98 |
| Implied Return | -6% |
| Forward P/E | 24.2x |
| Market Cap | $102B |
| 52-Week Range | $81 – $211 |
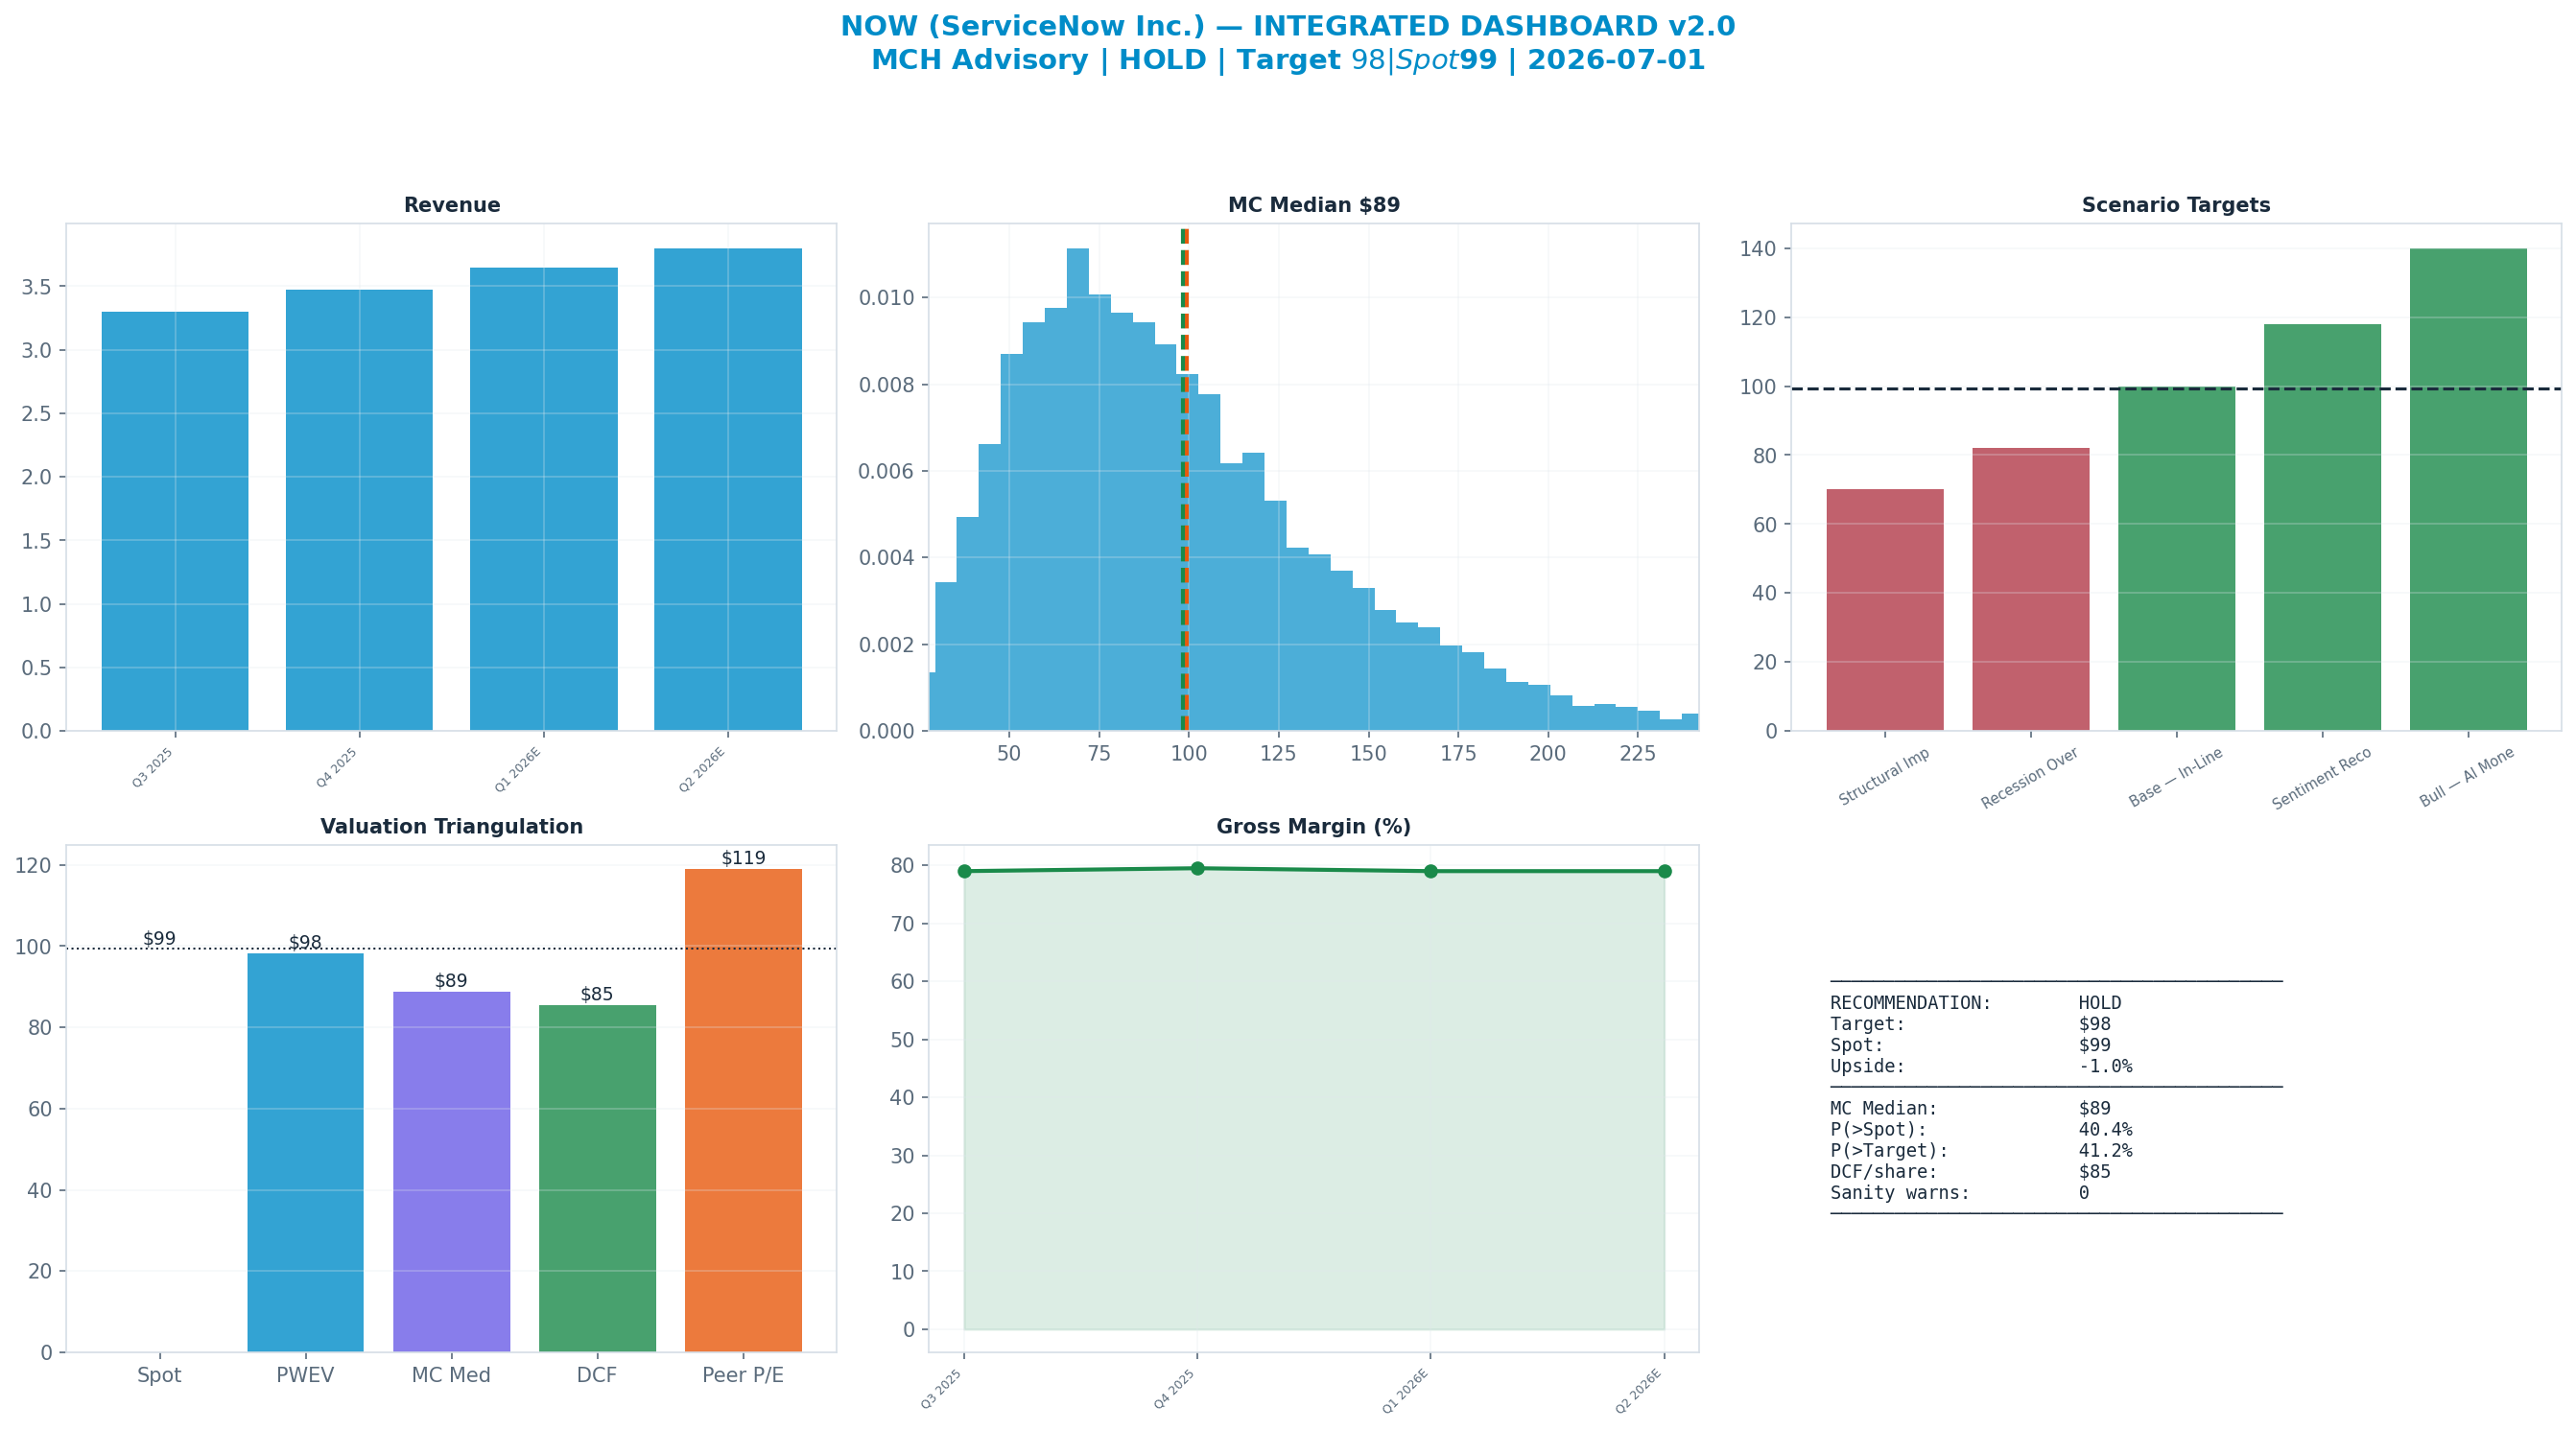
Methodology: Valuation triangulated across five independent anchors — Monte Carlo (Student-t + regime switching), an independent DCF, peer re-rating, a sum-of-parts, and a scenario-weighted PWEV. Figures reconciled to mch_weekly_run live prices. Each chart below sits with the part of the thesis it evidences.
Investment Thesis
The bull case — 'Bull — AI Monetizes' (13% weight) — targets $140, +41% vs spot. It needs the multiple to hold or expand.
The dashboard below is the whole argument on one page: spot ($99) against each valuation anchor, the scenario tree, technicals and the options-implied move.
Anti-Thesis (The Real Bear Case)
The structural case — 'Structural Impairment' (20%) — targets $70, -29% vs spot. This sits below the 52-week low — a genuine structural impairment, not a mild pullback.
Key Debate
P/E Multiple explains 94% of Monte Carlo outcome variance — i.e. value is set by the multiple the market will pay, a rate/sentiment regime bet as much as an earnings bet.
Earnings-Call Disconfirmation & Sentiment
Derived signals from the MCH market-data store (Alpha Vantage transcripts + news). Quantitative tone only — a disconfirmation flag, not a substitute for reading the call.
Management vs analyst tone (2026Q1): management +0.71 vs analyst floor +0.02 → delta +0.69 (n=29 mgmt / 16 Q&A; 97th pctile across the S&P book, z +1.8).
Flag: ELEVATED — management unusually upbeat vs the analyst floor relative to peers (disconfirmation watch).
| Quarter | Mgmt | Analyst | Delta |
|---|---|---|---|
| 2026Q1 | +0.71 | +0.02 | +0.69 |
| 2025Q4 | +0.54 | +0.44 | +0.10 |
| 2025Q3 | +0.68 | +0.48 | +0.21 |
| 2025Q2 | +0.64 | +0.39 | +0.25 |
News (last 365d, 1000 articles): avg ticker sentiment +0.16 (bullish 18% / bearish 6%)
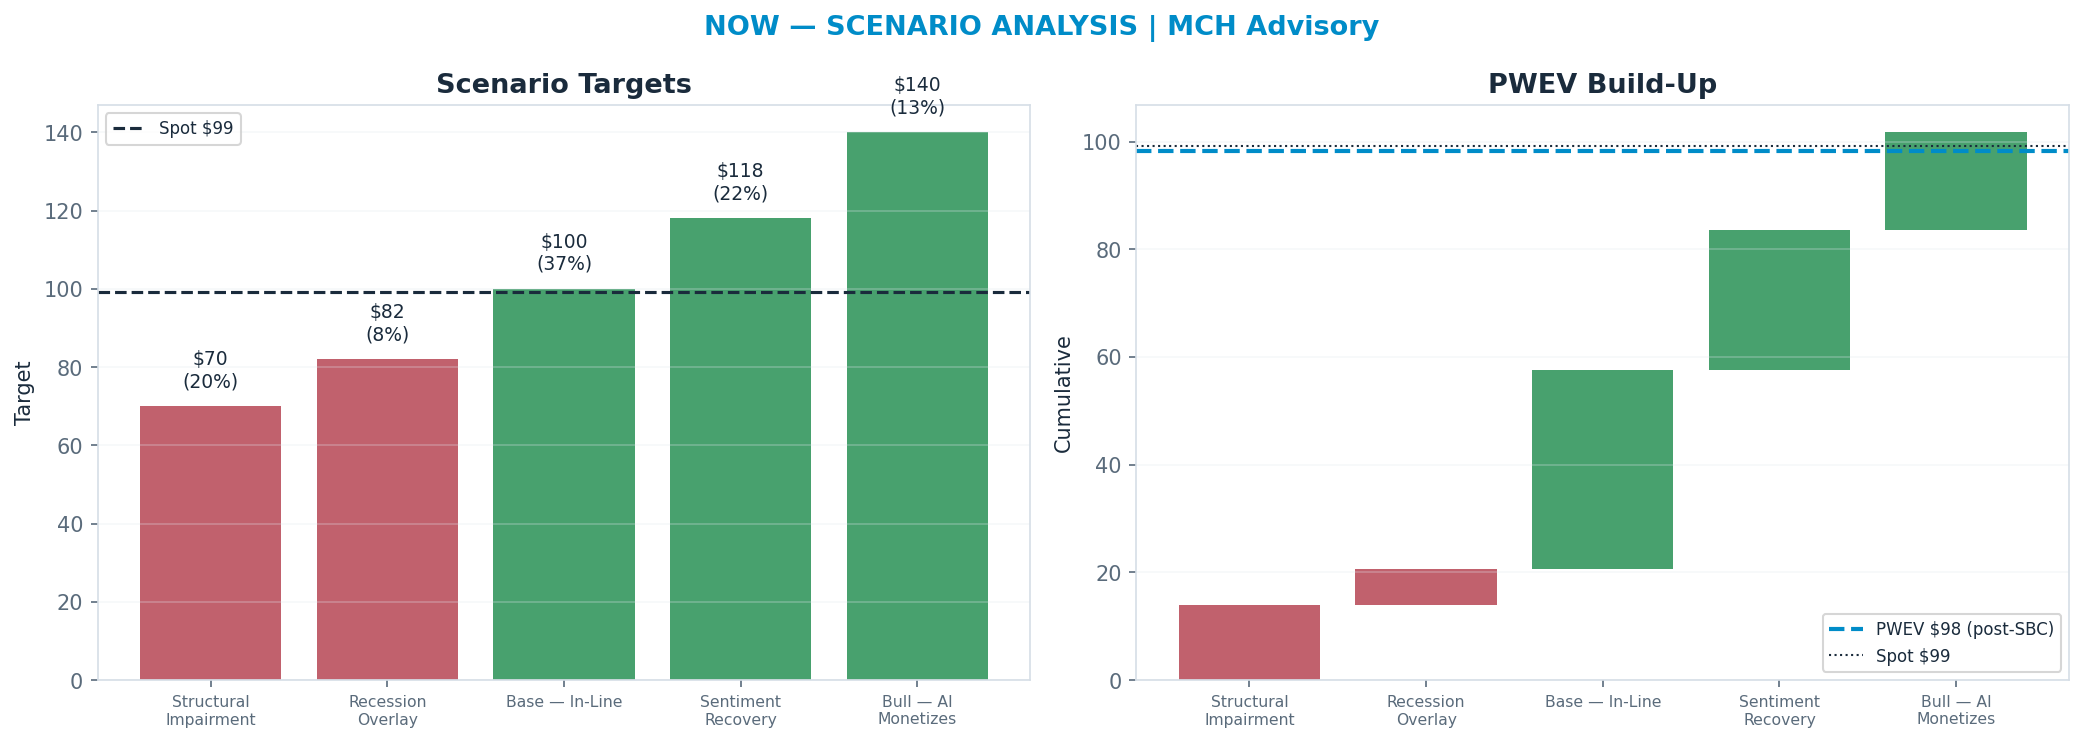
Scenario Analysis
The tree runs from a structural 'Structural Impairment' downside ($70) to a 'Bull — AI Monetizes' bull case ($140); the probability-weighted blend (PWEV $98) is -1% versus spot.
| Scenario | Probability | Target | Return |
|---|---|---|---|
| Structural Impairment | 20% | $70 | -29% |
| Recession Overlay | 8% | $82 | -17% |
| Base — In-Line | 37% | $100 | +1% |
| Sentiment Recovery | 22% | $118 | +19% |
| Bull — AI Monetizes | 13% | $140 | +41% |
| Probability-Weighted (PWEV, after SBC dilution) | — | $98 | -1% |
SBC charge: scenario targets are gross per-share prices; the PWEV is reduced by one year of stock-based-compensation dilution (3.5% of shares, on SBC ≈ 35% of revenue), trimming the gross PWEV of $102 to $98 (-3.4%). SBC is charged once, as dilution — never also deducted from FCF.
Scenario rationale — what each probability buys (the driver path behind every target):
- Structural Impairment (20%, $70). Now Assist attach disappoints and platform bundlers (MSFT/CRM) commoditize workflow GenAI, compressing the Pro Plus premium; subscription growth decelerates toward low-teens and net retention slips as expansion stalls. Non-GAAP operating margin stalls near 27-28% and the premium multiple breaks. Target sits below the 52-week low — a genuine structural impairment of the platform-consolidation thesis, not a pullback. Drivers — subscription_growth: ~12%; now_assist_attach: stalls; op_margin: ~27%; multiple: ~9x EV/Rev.
- Recession Overlay (8%, $82). Enterprise IT budgets tighten and federal/government deals slip; net new ACV and expansion decelerate even though the renewal base holds (>97%). Subscription growth fades to mid-teens, margins hold roughly flat on cost discipline, and the multiple stays capped as the market waits for budget recovery. Drivers — subscription_growth: ~15%; now_assist_attach: slows; op_margin: ~29%; multiple: ~11x EV/Rev.
- Base — In-Line (37%, $100). Subscription grows ~20% in line with cRPO; Now Assist Pro Plus attach ramps steadily as a real but still-early uplift; non-GAAP operating margin holds ~29-30% with scale leverage. The de-rated multiple normalizes modestly toward the lower end of NOW's historical premium band as durable growth is re-confirmed. Drivers — subscription_growth: ~20%; now_assist_attach: ramps steadily; op_margin: ~30%; multiple: ~13x EV/Rev.
- Sentiment Recovery (22%, $118). Growth and cRPO hold ~20%+ and the market re-rates the de-rated multiple back toward NOW's prior premium as the soft-landing / IT-budget fear fades; Now Assist provides visible attach proof points without yet inflecting. Re-rating, not fundamentals, does most of the work. Drivers — subscription_growth: ~21%; now_assist_attach: visible proof points; op_margin: ~31%; multiple: ~16x EV/Rev.
- Bull — AI Monetizes (13%, $140). Now Assist inflects — Pro Plus attach broadens across the installed base and consumption/value-based pricing de-links revenue from seat counts, re-accelerating subscription growth above 22% with positive net-AI-accretion. Operating margin expands past 31% on platform leverage and the multiple re-rates back toward the premium band. Drivers — subscription_growth: >22%; now_assist_attach: inflects / consumption-priced; op_margin: >31%; multiple: ~18x EV/Rev.
Valuation Triangulation
Five anchors — but read them with their basis in mind. The Monte Carlo, the DCF terminal, and the peer re-rate all key off a market multiple, so they are not fully independent; only the discounted cash flows themselves are genuinely multiple-free. The discipline is to read the spread and weight the cash-based view, not to treat five numbers as five independent votes.
| Method | Basis | Fair Value | vs Spot |
|---|---|---|---|
| Monte Carlo median (Student-t + regime) | multiple | $89 | -11% |
| Peer P/E re-rate | multiple | $119 | +20% |
| Peer EV/Revenue re-rate | multiple | $112 | +13% |
| Scenario PWEV | multiple | $98 | -1% |
| DCF (5-year + terminal) | cash flow + terminal × | $85 | -14% |
| Triangulated (weighted) | — | $94 | -6% |
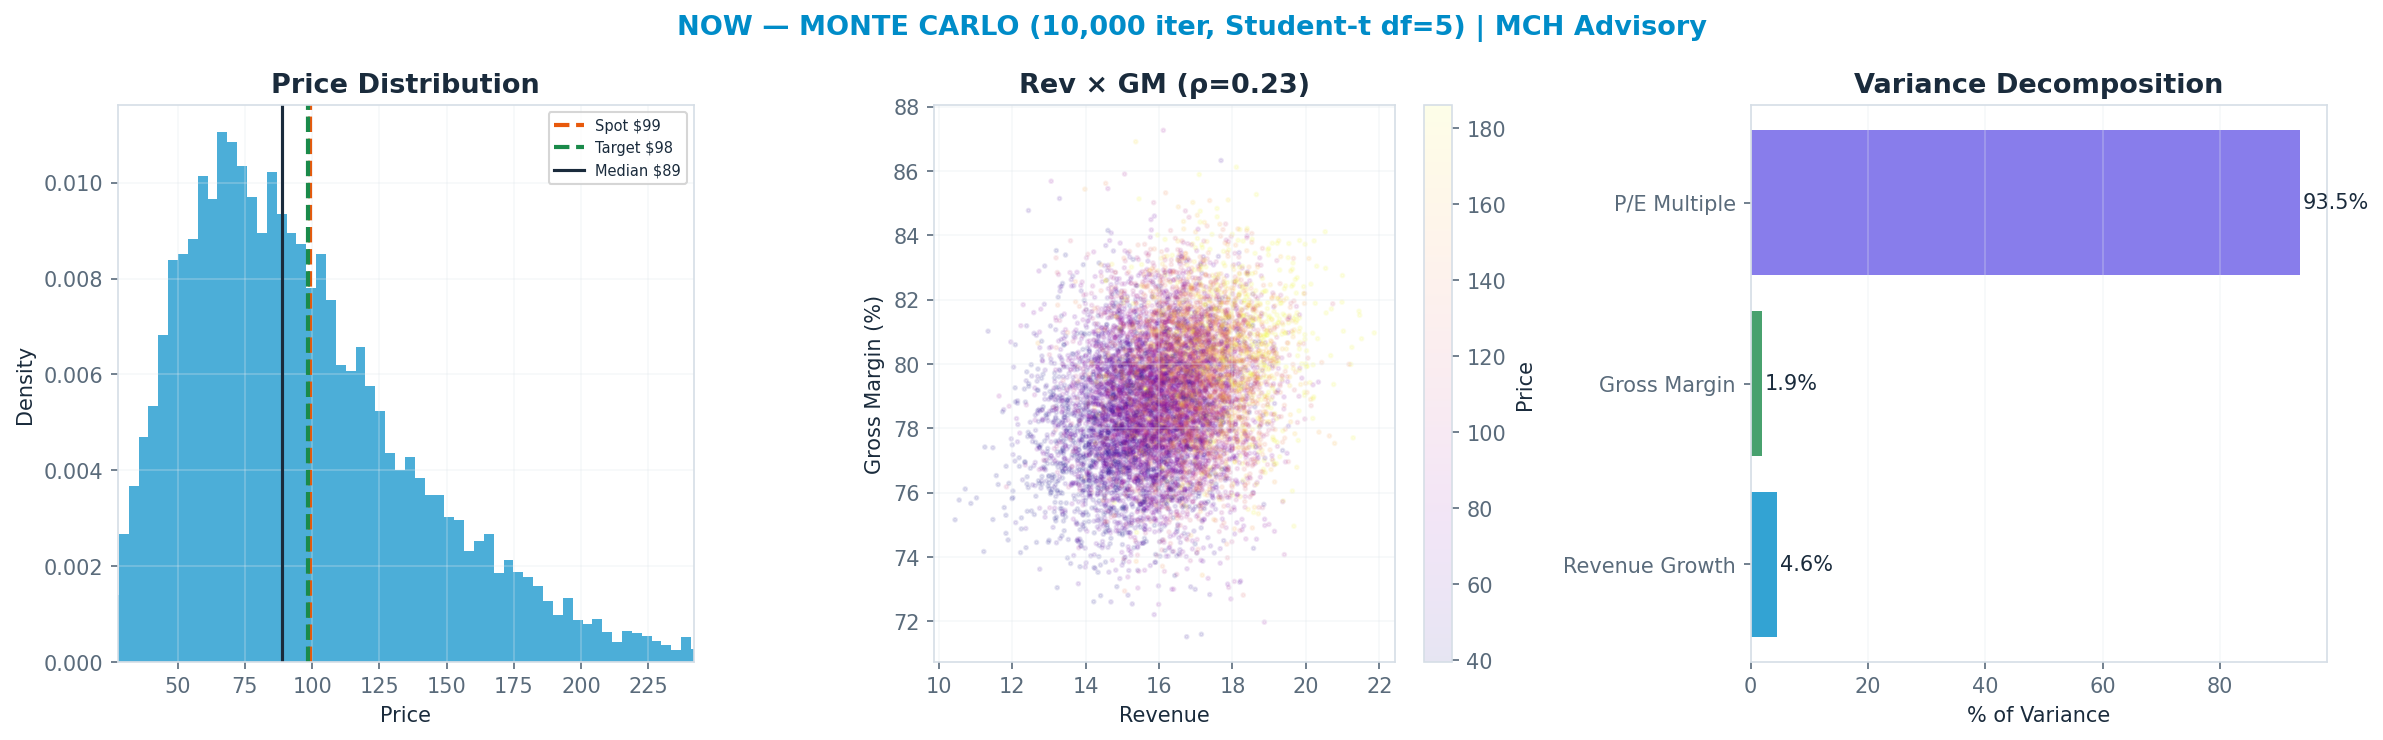
Monte Carlo — the distribution, not a point
10,000 paths, Student-t shocks (fat tails) with a regime-switching overlay. The median lands at $89 and 40% of paths finish above spot. The variance decomposition shows the p/e multiple is the dominant swing factor (94% of variance). Value is a multiple bet: fundamentals move the answer far less than the rating does.
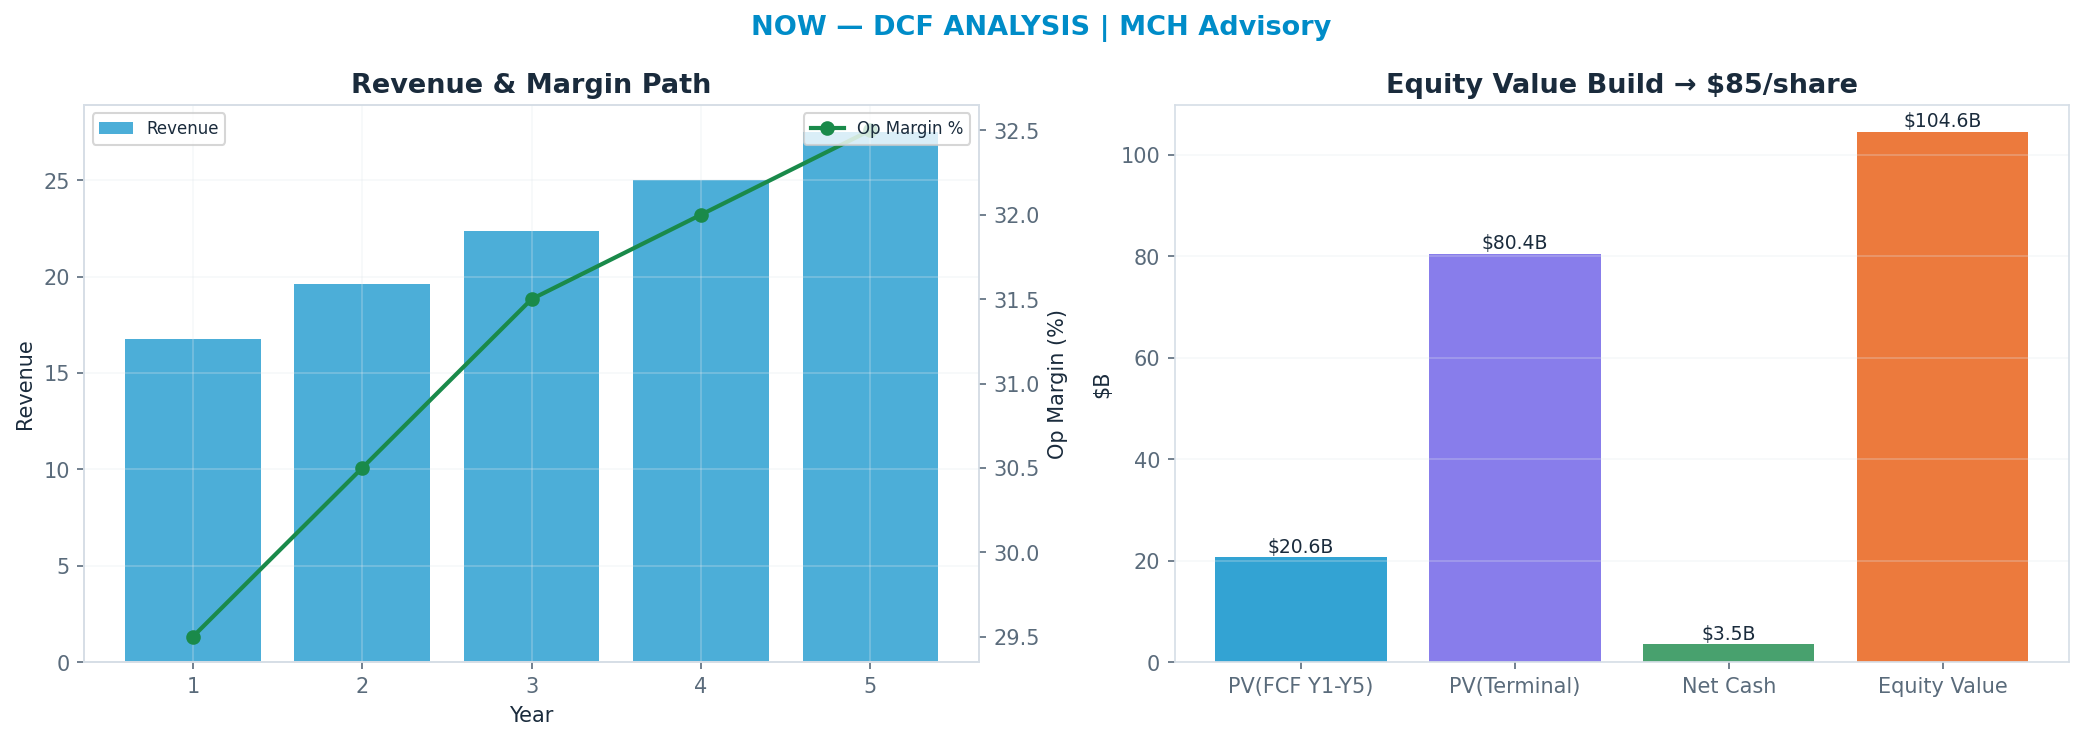
DCF — the cash-flow anchor
Independent of the market multiple: a 5-year path, WACC 9.5%, 18x terminal FCF multiple → $85. This anchor is deliberately the heaviest (41%): it is the valuation least hostage to the current multiple regime.
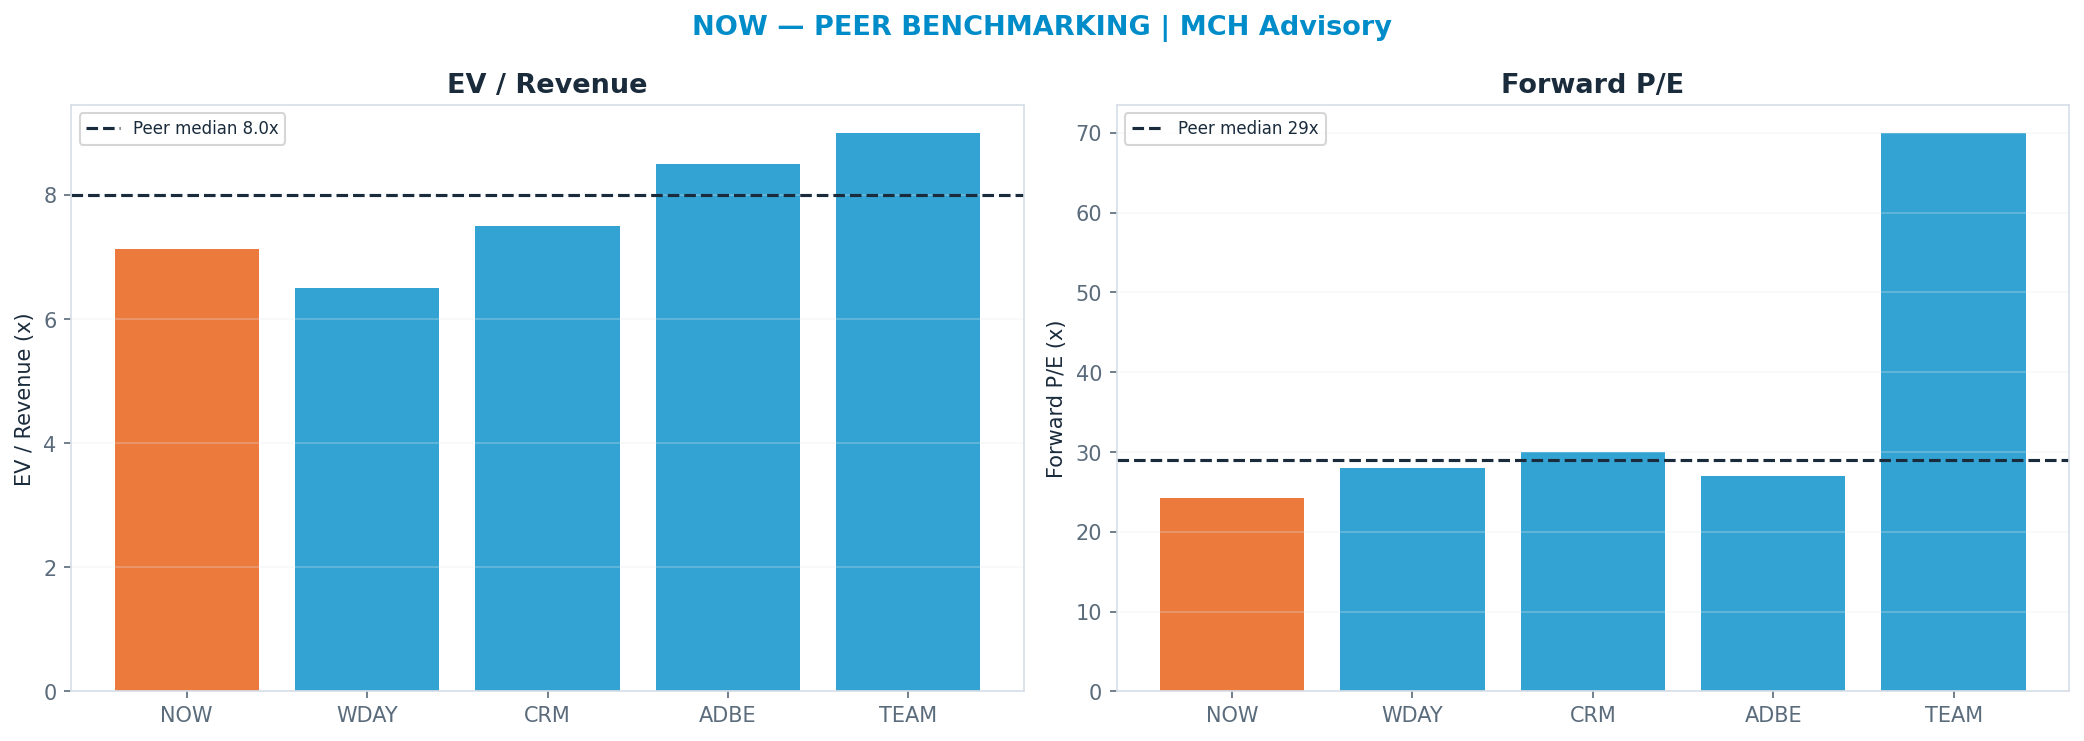
Peer benchmarking — relative value
Against the peer cohort, re-rating to the peer-median forward multiple (P/E 29.0x) implies $119. A premium is only justified by superior growth/margins; otherwise it is multiple risk. Weighted just 12% so the market's mood does not drive the fair value.
Across all anchors the spread is tight (the methods corroborate one another).
Revenue-Segment Breakdown
The company-specific drivers behind the valuation — each segment carries its own growth, margin, multiple and capex intensity. (Tags: FACT reported · ESTIMATE from disclosures · INFERENCE judgment.)
| Segment | Revenue | Mix | Growth | Op margin | Multiple | Capex % | Tag |
|---|---|---|---|---|---|---|---|
| IT Workflows (ITSM / ITOM — core) | $7.5B | 45% | 17% | 31% | 12x | 2% | FACT/ESTIMATE |
| Employee Workflows (HR / Workplace) | $2.5B | 15% | 22% | 28% | 11x | 2% | FACT/ESTIMATE |
| Customer & Industry Workflows (CSM / FSM / industry) | $3.5B | 21% | 24% | 27% | 11x | 2% | FACT/ESTIMATE |
| Creator / Platform + Now Assist (low-code + GenAI add-on) | $3.2B | 19% | 30% | 30% | 16x | 2% | FACT/ESTIMATE/INFERENCE |
AI revenue, decomposed — the AI lines broken out (Azure-AI / Copilot / model-API / pass-through style), so the AI contribution is auditable:
| AI line | Run-rate | Growth | Gross margin | Capex % | Tag |
|---|---|---|---|---|---|
| Now Assist Pro Plus (GenAI uplift) | $1.5B | 100% | 75% | 4% | ESTIMATE |
| Core Now Platform subscription (ex-AI) | $15.0B | 18% | 82% | 2% | FACT/ESTIMATE |
| AI-agent / workflow-automation optionality | $0.3B | 150% | 70% | 5% | INFERENCE |
- Now Assist Pro Plus (GenAI uplift): GenAI add-on sold as premium 'Pro Plus' SKUs at a price uplift over Pro; the fastest-growing motion but still EARLY — ~$1-3B ACV ramping. ACV (bookings) leads recognized revenue.
- Core Now Platform subscription (ex-AI): The durable installed base across IT / Employee / Customer / Creator workflows; high-renewal subscription. NOT additive with Pro Plus shown separately — this is the base the AI uplift attaches onto.
- AI-agent / workflow-automation optionality: Emerging agentic / consumption-priced automation layer; immaterial today, speculative optionality — value separately, do not blend into the base. Outcome highly uncertain.
Named Exposures
AI monetization & seat model (ESTIMATE/INFERENCE)
| Dimension | Assessment |
|---|---|
| Now Assist attach | Pro Plus attach into the installed base is the key swing variable; early-but-rising — most large new deals now include some Now Assist (est.) |
| Now Assist ACV | ~$1-3B ACV ramping (est.); ACV/bookings lead recognized subscription revenue by several quarters |
| Pricing model shift | Transition from seat-based to consumption / value-based pricing for AI — could de-link revenue from headcount (upside) or compress it if AI reduces seats |
| Seat cannibalization risk | If Now Assist automates work and shrinks human seats, AI uplift must outrun seat erosion to be net-accretive — unproven |
| Premium pricing durability | Pro Plus commands a price uplift today; competitive GenAI bundling (MSFT/CRM) could pressure that premium over time |
Enterprise IT-budget & competition (ESTIMATE/INFERENCE)
| Dimension | Assessment |
|---|---|
| IT-spend cyclicality | Subscription is sticky (renewal >97%) but NET NEW ACV and expansion are sensitive to enterprise IT-budget tightening and deal-cycle elongation |
| Federal / government exposure | Material US federal and public-sector book — exposed to budget timing, shutdown / appropriations risk and procurement delays |
| Competition — platform bundlers | MSFT (Power Platform + Copilot bundled into M365/Azure), Salesforce (Agentforce/CSM overlap), Workday (HR overlap) can bundle adjacent capability at marginal price |
| Moat — platform consolidation | Single Now Platform + workflow data + system-of-action position is the defense; risk is that GenAI lowers switching costs and lets bundlers encroach |
| Net retention / cRPO | cRPO growth and net expansion rate are the leading health indicators; deceleration here is the first sign of structural pressure |
Industry Context — Enterprise Software (premium SaaS)
This name sits in the Enterprise Software (premium SaaS) as a workflow platform (ITSM/HR/CSM + Now Assist). AI = Now Assist 'Pro Plus' upsell; bull if AI adds ACV without cannibalizing seats, bear if budgets tighten or the multiple de-rates. Its scenarios are not guessed in isolation — they inherit a single, shared view of the cluster's driver cycle, so the names that depend on the same event are mutually consistent.
Value chain: NOW (workflow platform (ITSM/HR/CSM + Now Assist)) · PANW (cybersecurity platform (Strata/Prisma/Cortex)) · PLTR (AI/data platform (AIP, Gov + Commercial))
| Shared state | Capex path | House view | This name implies |
|---|---|---|---|
| SaaS De-rate / AI Disruption | multiple compression + AI-native/MSFT disruption | 25% | 20% |
| Budget Digestion | enterprise IT spend softens | 18% | 8% |
| Steady Monetization | AI adds modestly; multiples hold | 37% | 37% |
| AI Monetization Inflection | AI becomes a major revenue line; re-rate | 20% | 35% |
On the cluster's key downside — SaaS De-rate / AI Disruption (multiple compression + AI-native/MSFT disruption) — this name implies 20% vs the cluster house view of 25% (in line with the house). The cluster's full cross-stock reconciliation governs that the names which ride the same capex cycle assign it comparable odds.
Structure: Spend Cycle — Enterprise IT/software budgets — resilient but cyclical; AI is currently additive to budgets, a risk if it later substitutes. (INFERENCE) Ai Monetization — Open question across the group: does GenAI become a durable premium SKU (Now Assist, Cortex, AIP) or does it commoditize/compress software value? (INFERENCE) Multiple Regime — All three trade at premium-to-extreme forward multiples; a SaaS de-rating compresses the whole group together. (FACT) Competition — Microsoft bundling (Copilot, Sentinel/Defender, Power Platform) is the shared distribution-power threat; AI-native startups are the disruption tail. (INFERENCE)
Model Appendix
DCF — line items
| Year | Revenue | Op income | − Capex | + D&A | FCF | PV(FCF) |
|---|---|---|---|---|---|---|
| FY+1 | $17B | $5B | $0B | $0B | $4B | $4B |
| FY+2 | $20B | $6B | $0B | $0B | $5B | $4B |
| FY+3 | $22B | $7B | $0B | $0B | $6B | $4B |
| FY+4 | $25B | $8B | $1B | $0B | $6B | $4B |
| FY+5 | $28B | $9B | $1B | $0B | $7B | $4B |
| Terminal | — | — | — | — | $7B × 18x | $80B |
FCF is bridged: NOPAT + D&A − Capex − ΔNWC (capex intensity 2% of revenue, weighted from the segments) — not a single conversion fudge.
WACC 9.5% · Σ PV(FCF) $21B + PV(terminal) $80B = EV $101B; + net cash → equity $105B ÷ diluted shares 1.22B = $85/share (exit-multiple terminal).
- Gordon (perpetuity-growth) terminal at 2.5% → $73/share — a genuinely non-multiple, cash-based cross-check; the exit-multiple and Gordon values bracket the terminal-value risk.
- Incremental ROIC on the forecast capex ≈ 144% vs WACC 10% → above WACC — the build is value-creative.
Peer set
| Peer | EV/Rev | Fwd P/E | Growth | Op margin |
|---|---|---|---|---|
| WDAY | 6.5x | 28x | 14% | 26% |
| CRM | 7.5x | 30x | 10% | 30% |
| ADBE | 8.5x | 27x | 10% | 45% |
| TEAM | 9.0x | 70x | 20% | 15% |
| Median | 8.0x | 29.0x | — | — |
Peer-median fwd P/E → $119; EV/Rev → $112.
Weighted fair-value math
| Anchor | Value | Weight | Contribution |
|---|---|---|---|
| DCF | $85 | 41% | $35 |
| Scenario PWEV | $98 | 29% | $29 |
| Monte Carlo median | $89 | 18% | $16 |
| Peer P/E | $119 | 12% | $14 |
| Triangulated | — | 100% | $94 |
Sensitivity
DCF/share — WACC × terminal multiple
| WACC \ Term× | 12.6x | 15.3x | 18.0x | 20.7x | 23.4x |
|---|---|---|---|---|---|
| 8% | $71 | $82 | $93 | $104 | $114 |
| 8% | $68 | $79 | $89 | $99 | $110 |
| 10% | $66 | $76 | $85 | $95 | $105 |
| 10% | $63 | $73 | $82 | $91 | $101 |
| 12% | $61 | $70 | $79 | $88 | $97 |
DCF/share — revenue CAGR Δ × op-margin Δ
| CAGRΔ \ MgnΔ | -3.0pp | -1.5pp | +0.0pp | +1.5pp | +3.0pp |
|---|---|---|---|---|---|
| -3.0pp | $69 | $73 | $76 | $80 | $83 |
| -1.5pp | $73 | $77 | $81 | $84 | $88 |
| +0.0pp | $78 | $81 | $85 | $89 | $93 |
| +1.5pp | $82 | $86 | $90 | $94 | $99 |
| +3.0pp | $87 | $91 | $96 | $100 | $104 |
Tornado — DCF/share swing by driver (widest first)
| Driver | Low | High | Swing |
|---|---|---|---|
| Terminal × ±15% | $76 | $95 | $20 |
| Revenue CAGR ±3pp | $76 | $96 | $19 |
| Op margin ±3pp | $78 | $93 | $16 |
| WACC ±1pp | $82 | $89 | $7 |
| FCF conversion ±10% | $85 | $85 | $0 |
Company lever — SoP/share vs IT Workflows (ITSM / ITOM — core) multiple (AI re-rating) (base 12x)
| Multiple | 8.4x | 10.2x | 12.0x | 13.8x | 15.6x |
|---|---|---|---|---|---|
| SoP/share | $178 | $191 | $204 | $217 | $231 |
Load-Bearing Assumptions
DCF: WACC 10%, terminal multiple 18×, FY+5 revenue $28B. Triangulation leans 41% on DCF, 29% on PWEV.
Reasons the Thesis Could Fail (Falsifiable)
The valuation is multiple-dependent (94% of variance); a de-rating toward the DCF anchor ($85) implies -14%.
Fact / Inference / Speculation
- FACT: Spot $99; 52-week range $81–$211; engine rating HOLD; base-case target $98 (-1%).
- INFERENCE: Triangulated FV $94 (-6%). P/E Multiple explains 94% of Monte Carlo outcome variance — i.e. value is set by the multiple the market will pay, a rate/sentiment regime bet as much as an earnings bet.
- SPECULATION: At current prices the embedded bet is that the multiple holds or expands — P/E Multiple carries 94% of outcome variance.
Recommendation: HOLD
Balanced: triangulated fair value $94 (-6% vs spot); the outcome hinges on P/E Multiple. The debate is P/E Multiple (94% of variance) — fundamentally a multiple/regime call. SBC runs 4646M TTM (disclosed in the appendix).