Rating: SELL
| Metric | Value |
|---|---|
| Current Price | $100 |
| Triangulated Fair Value | $60 |
| 12-mo Scenario PWEV | $79 |
| Implied Return | -40% |
| Forward P/E | 52.2x |
| Market Cap | $79B |
| 52-Week Range | $64 – $154 |
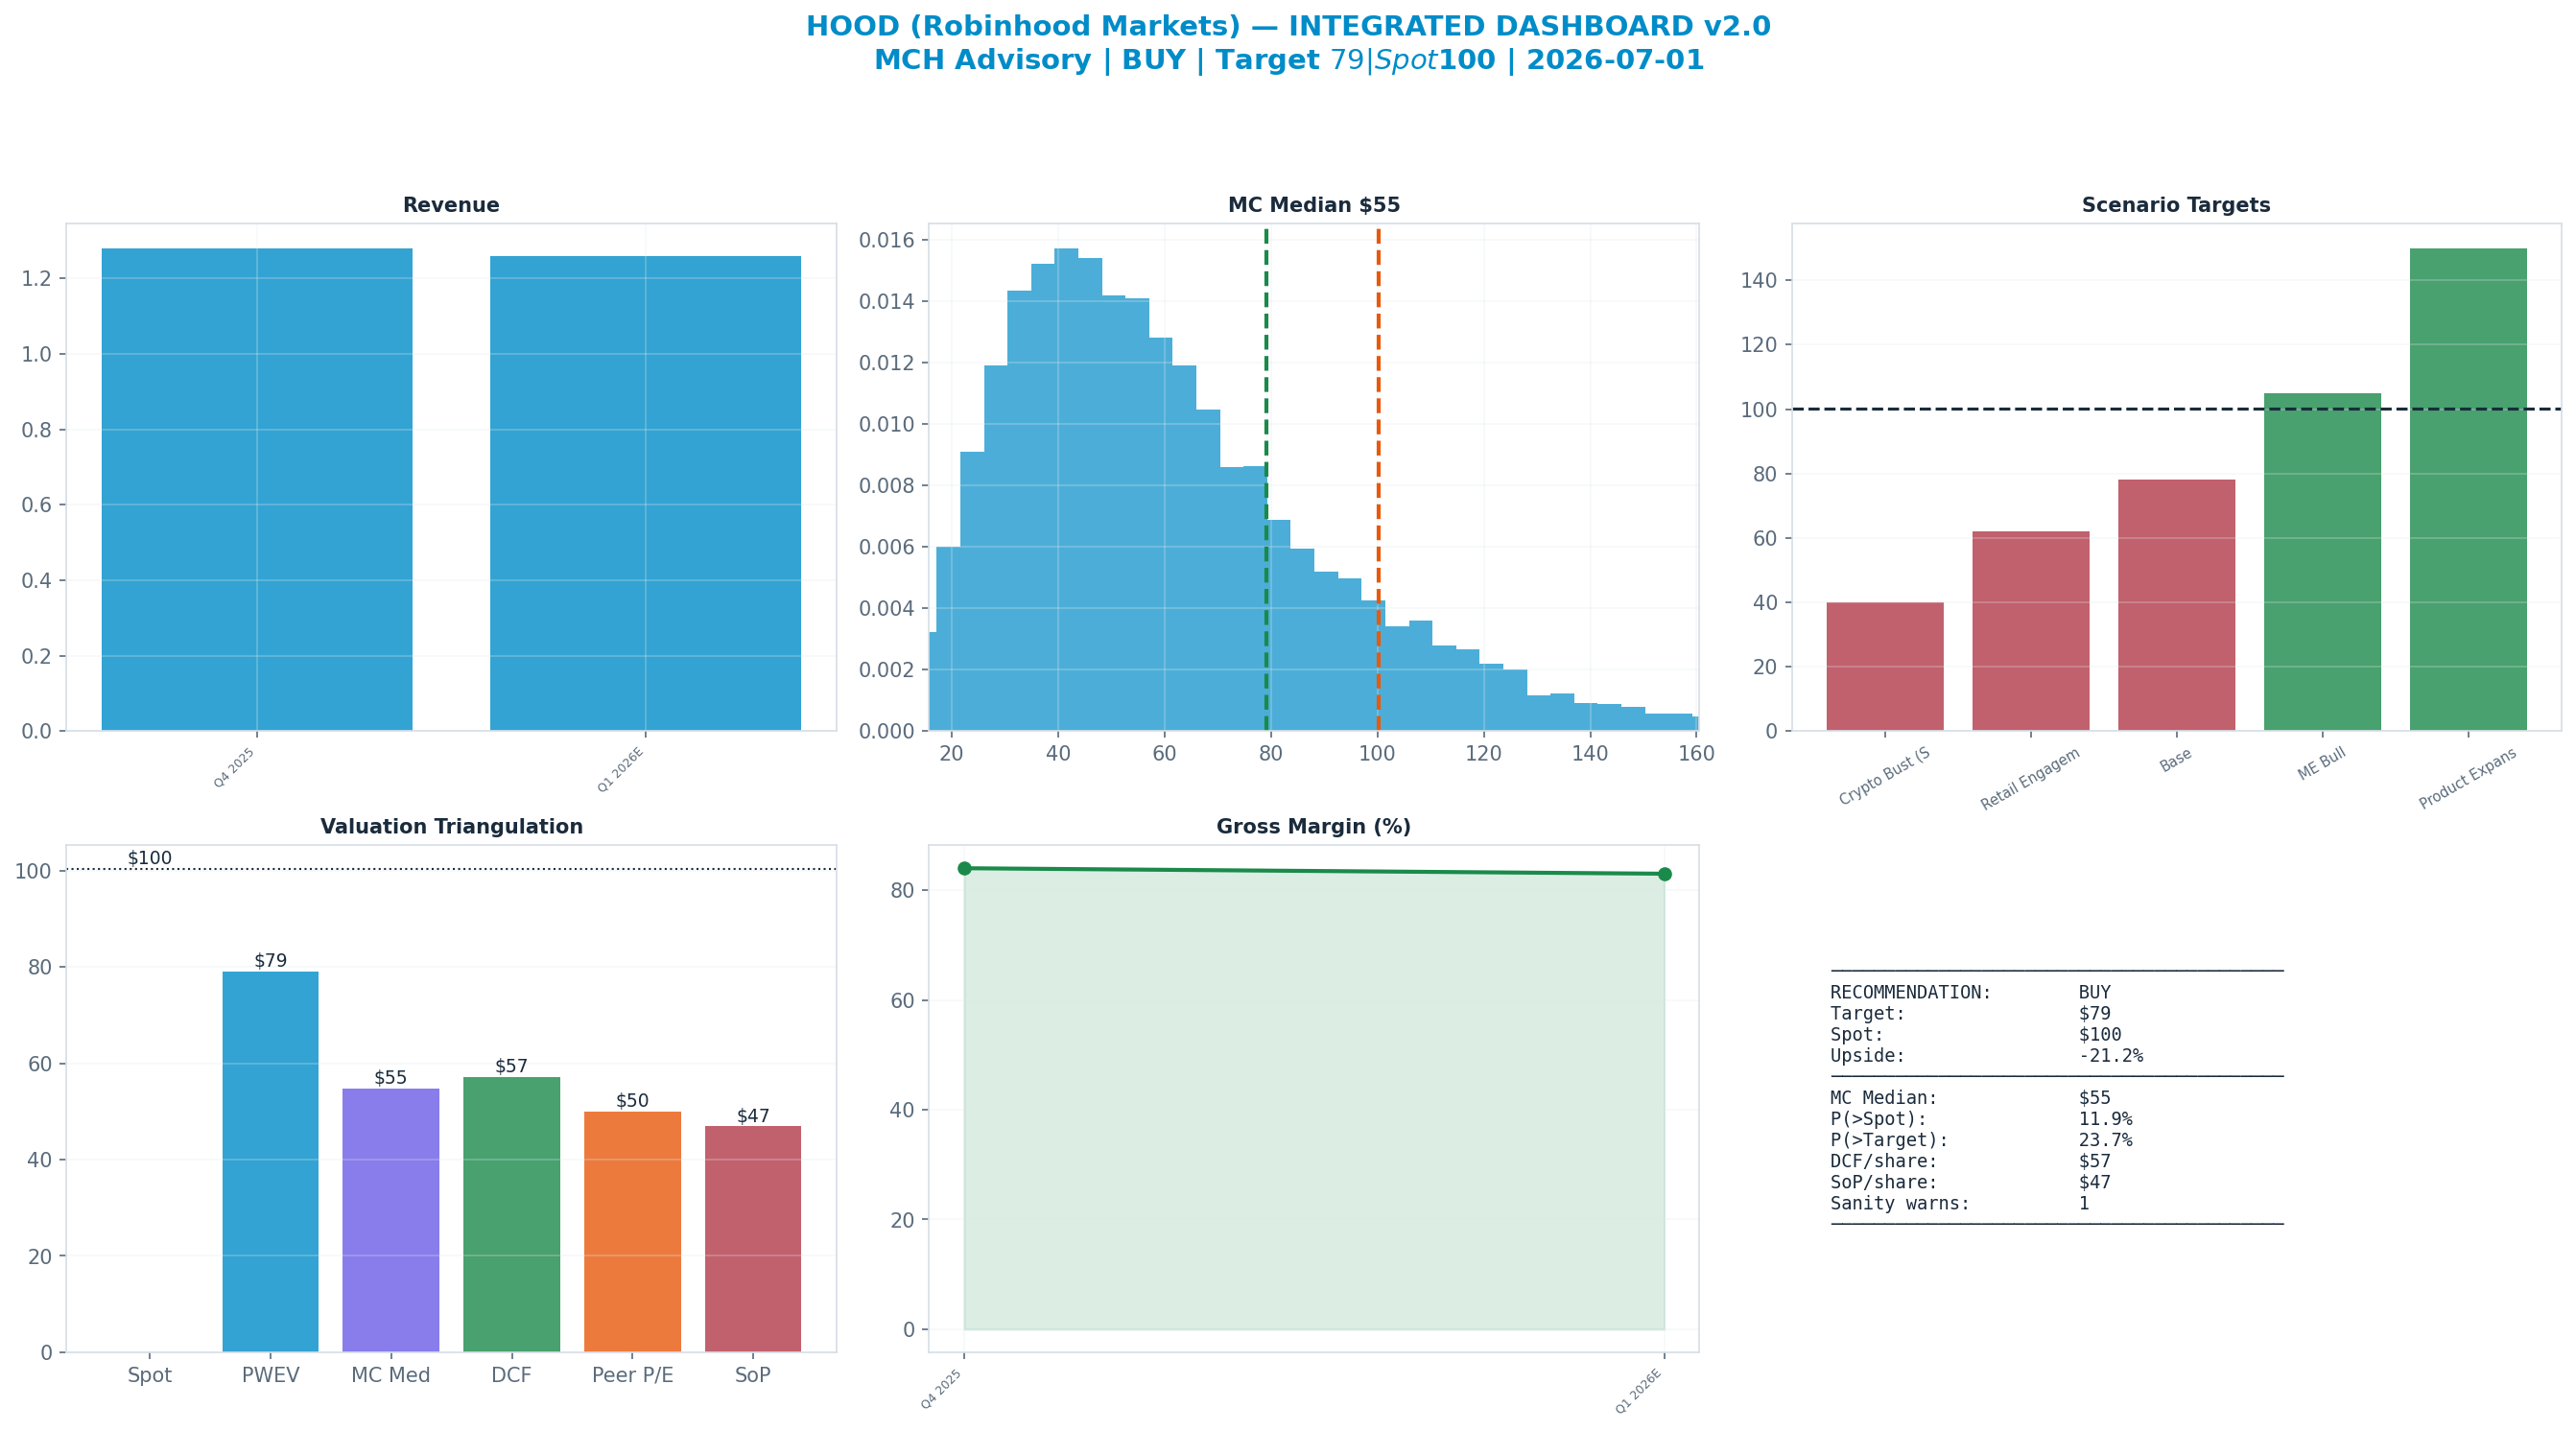
Methodology: Valuation triangulated across five independent anchors — Monte Carlo (Student-t + regime switching), an independent DCF, peer re-rating, a sum-of-parts, and a scenario-weighted PWEV. Figures reconciled to mch_weekly_run live prices. Each chart below sits with the part of the thesis it evidences.
Investment Thesis
The bull case — 'Product Expansion Win' (10% weight) — targets $150, +50% vs spot. It needs the multiple to hold or expand.
The dashboard below is the whole argument on one page: spot ($100) against each valuation anchor, the scenario tree, technicals and the options-implied move.
Anti-Thesis (The Real Bear Case)
The structural case — 'Crypto Bust (Structural)' (20%) — targets $40, -60% vs spot. This sits below the 52-week low — a genuine structural impairment, not a mild pullback.
Key Debate
P/E Multiple explains 84% of Monte Carlo outcome variance — i.e. value is set by the multiple the market will pay, a rate/sentiment regime bet as much as an earnings bet.
Earnings-Call Disconfirmation & Sentiment
Derived signals from the MCH market-data store (Alpha Vantage transcripts + news). Quantitative tone only — a disconfirmation flag, not a substitute for reading the call.
Management vs analyst tone (2026Q1): management +0.24 vs analyst floor +0.00 → delta +0.24 (n=63 mgmt / 19 Q&A; 20th pctile across the S&P book, z -0.9).
Flag: TYPICAL — management-vs-analyst tone within the normal cross-sectional range.
| Quarter | Mgmt | Analyst | Delta |
|---|---|---|---|
| 2026Q1 | +0.24 | +0.00 | +0.24 |
| 2025Q4 | +0.40 | +0.18 | +0.21 |
| 2025Q3 | +0.35 | +0.02 | +0.33 |
| 2025Q2 | +0.48 | +0.22 | +0.26 |
News (last 365d, 216 articles): avg ticker sentiment +0.09 (bullish 12% / bearish 3%)
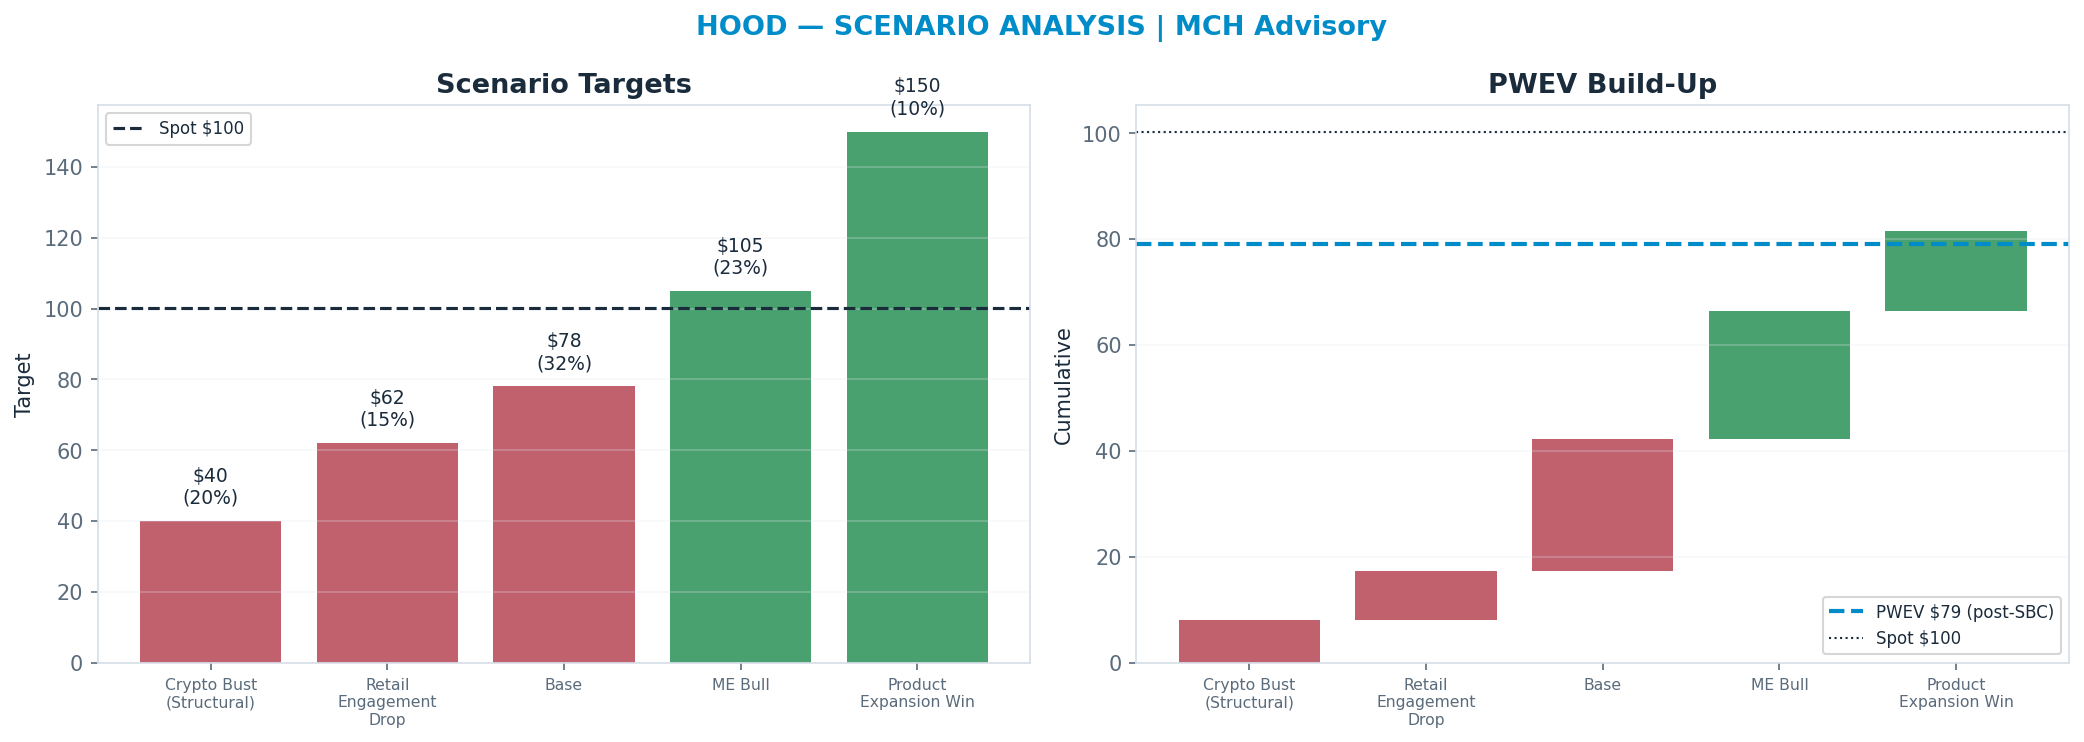
Scenario Analysis
The tree runs from a structural 'Crypto Bust (Structural)' downside ($40) to a 'Product Expansion Win' bull case ($150); the probability-weighted blend (PWEV $79) is -21% versus spot.
| Scenario | Probability | Target | Return |
|---|---|---|---|
| Crypto Bust (Structural) | 20% | $40 | -60% |
| Retail Engagement Drop | 15% | $62 | -38% |
| Base | 32% | $78 | -22% |
| ME Bull | 23% | $105 | +5% |
| Product Expansion Win | 10% | $150 | +50% |
| Probability-Weighted (PWEV, after SBC dilution) | — | $79 | -21% |
SBC charge: scenario targets are gross per-share prices; the PWEV is reduced by one year of stock-based-compensation dilution (3.0% of shares, on SBC ≈ 10% of revenue), trimming the gross PWEV of $81 to $79 (-2.9%). SBC is charged once, as dilution — never also deducted from FCF.
Scenario rationale — what each probability buys (the driver path behind every target):
- Crypto Bust (Structural) (20%, $40). A multi-quarter crypto winter collapses crypto transaction volume and take-rate, and a quiet equity tape drags options/equities revenue alongside — transaction revenue falls 40%+ as in 2022. Funded-account growth stalls and ARPU compresses as the most active cohort goes dormant; NII cushions but cannot offset. The multiple de-rates to a brokerage-like level on the view that fintech growth was a cycle, not a structural trajectory; the target sits below the 52-week low — a genuine structural impairment, not a pullback. Drivers — funded_accounts: flat to slightly down; arpu: down ~25-35%; crypto_mix: collapses; nii_path: holds but cannot offset; multiple: ~10-12x.
- Retail Engagement Drop (15%, $62). Markets stay calm with low volatility; retail trading frequency fades without a crypto crash. Transaction revenue softens on lower volume even as funded accounts hold roughly flat; ARPU drifts lower. NII and Other (Gold/cards) provide ballast, so the de-rate is milder than a structural bust. Drivers — funded_accounts: flat; arpu: down ~10-15%; crypto_mix: lower; nii_path: stable; multiple: ~16x.
- Base (32%, $78). Funded accounts grow steadily and ARPU rises on deeper product attach (options, Gold, retirement); crypto mix normalizes to a mid-cycle level rather than boom or bust. NII holds with balances offsetting a modest rate-cut path, and Other scales as the fastest line. The multiple holds in the low-20s on proven diversification beyond pure transaction beta. Drivers — funded_accounts: up ~8-10%; arpu: up ~10%; crypto_mix: mid-cycle; nii_path: stable; multiple: ~22x.
- ME Bull (23%, $105). A strong risk-on tape lifts both crypto and options volume, driving an upside ARPU surprise on the existing funded base; NII stays elevated as margin balances and rates cooperate. Operating leverage expands margins as the asset-light model scales. The multiple expands as the market extrapolates the growth tape. Drivers — funded_accounts: up ~12%; arpu: up ~20-25%; crypto_mix: elevated; nii_path: elevated; multiple: ~28x.
- Product Expansion Win (10%, $150). The newer pillars inflect — Gold subscriptions, cards/spending, retirement AUC and advisory scale into a durable, less-cyclical revenue base that re-rates the mix away from transaction beta. Cortex AI and platform breadth lift engagement and ARPU structurally rather than cyclically. The market pays a higher multiple for the lower-beta, recurring-revenue trajectory and a larger AUC-driven NII base. Drivers — funded_accounts: up ~10-12%; arpu: up ~15-20% (recurring-led); crypto_mix: less dominant; nii_path: rising on AUC growth; multiple: ~30x.
Valuation Triangulation
Five anchors — but read them with their basis in mind. The Monte Carlo, the DCF terminal, and the peer re-rate all key off a market multiple, so they are not fully independent; only the discounted cash flows themselves are genuinely multiple-free. The discipline is to read the spread and weight the cash-based view, not to treat five numbers as five independent votes.
| Method | Basis | Fair Value | vs Spot |
|---|---|---|---|
| Monte Carlo median (Student-t + regime) | multiple | $55 | -45% |
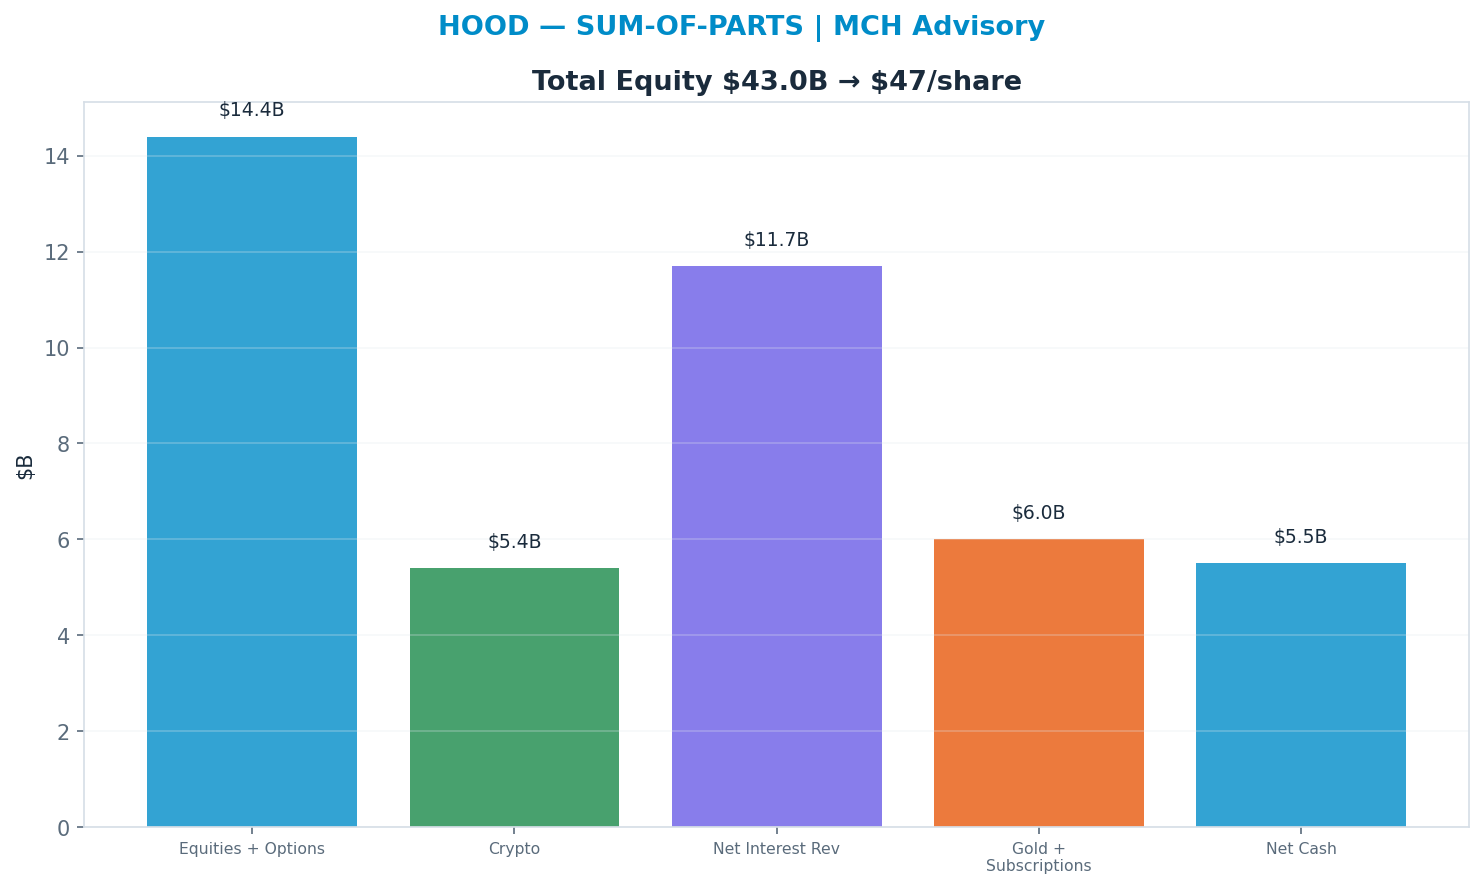
| Sum-of-Parts | multiple | $47 | -53% |
| Peer P/E re-rate | multiple | $50 | -50% |
| Peer EV/Revenue re-rate | multiple | $49 | -51% |
| Scenario PWEV | multiple | $79 | -21% |
| DCF (5-year + terminal) | cash flow + terminal × | $57 | -43% |
| Triangulated (weighted) | — | $60 | -40% |
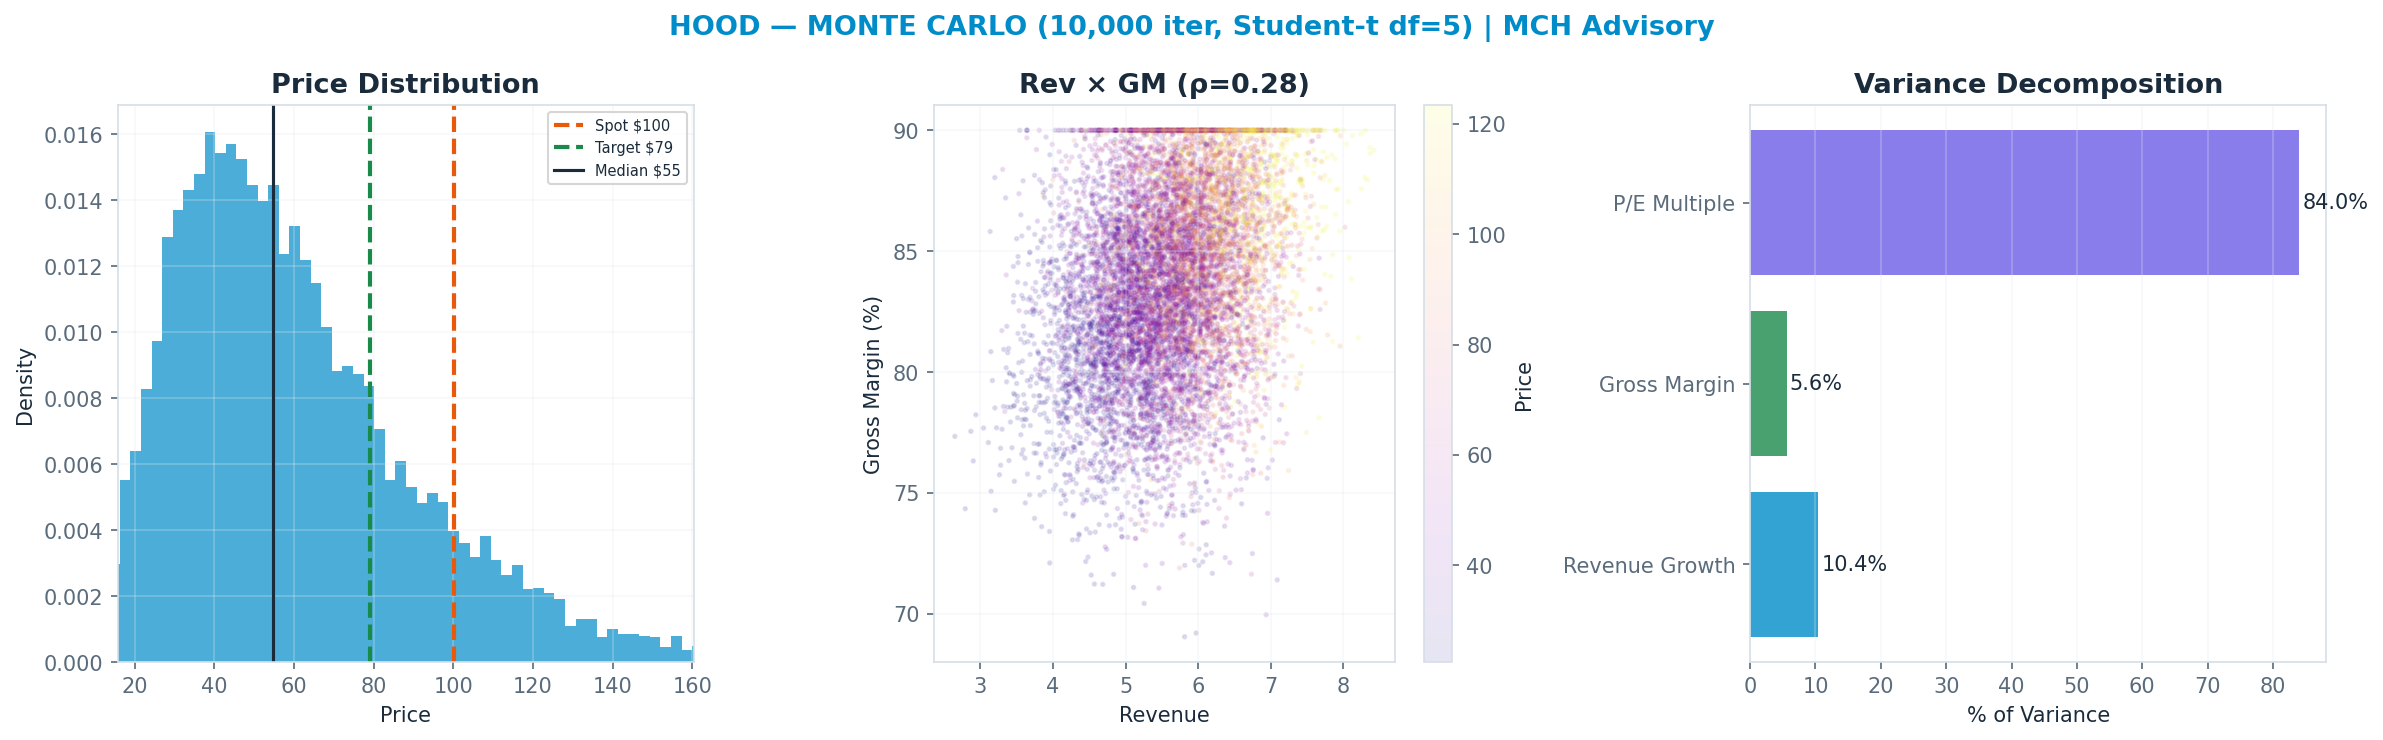
Monte Carlo — the distribution, not a point
10,000 paths, Student-t shocks (fat tails) with a regime-switching overlay. The median lands at $55 and 12% of paths finish above spot. The variance decomposition shows the p/e multiple is the dominant swing factor (84% of variance). Value is a multiple bet: fundamentals move the answer far less than the rating does.
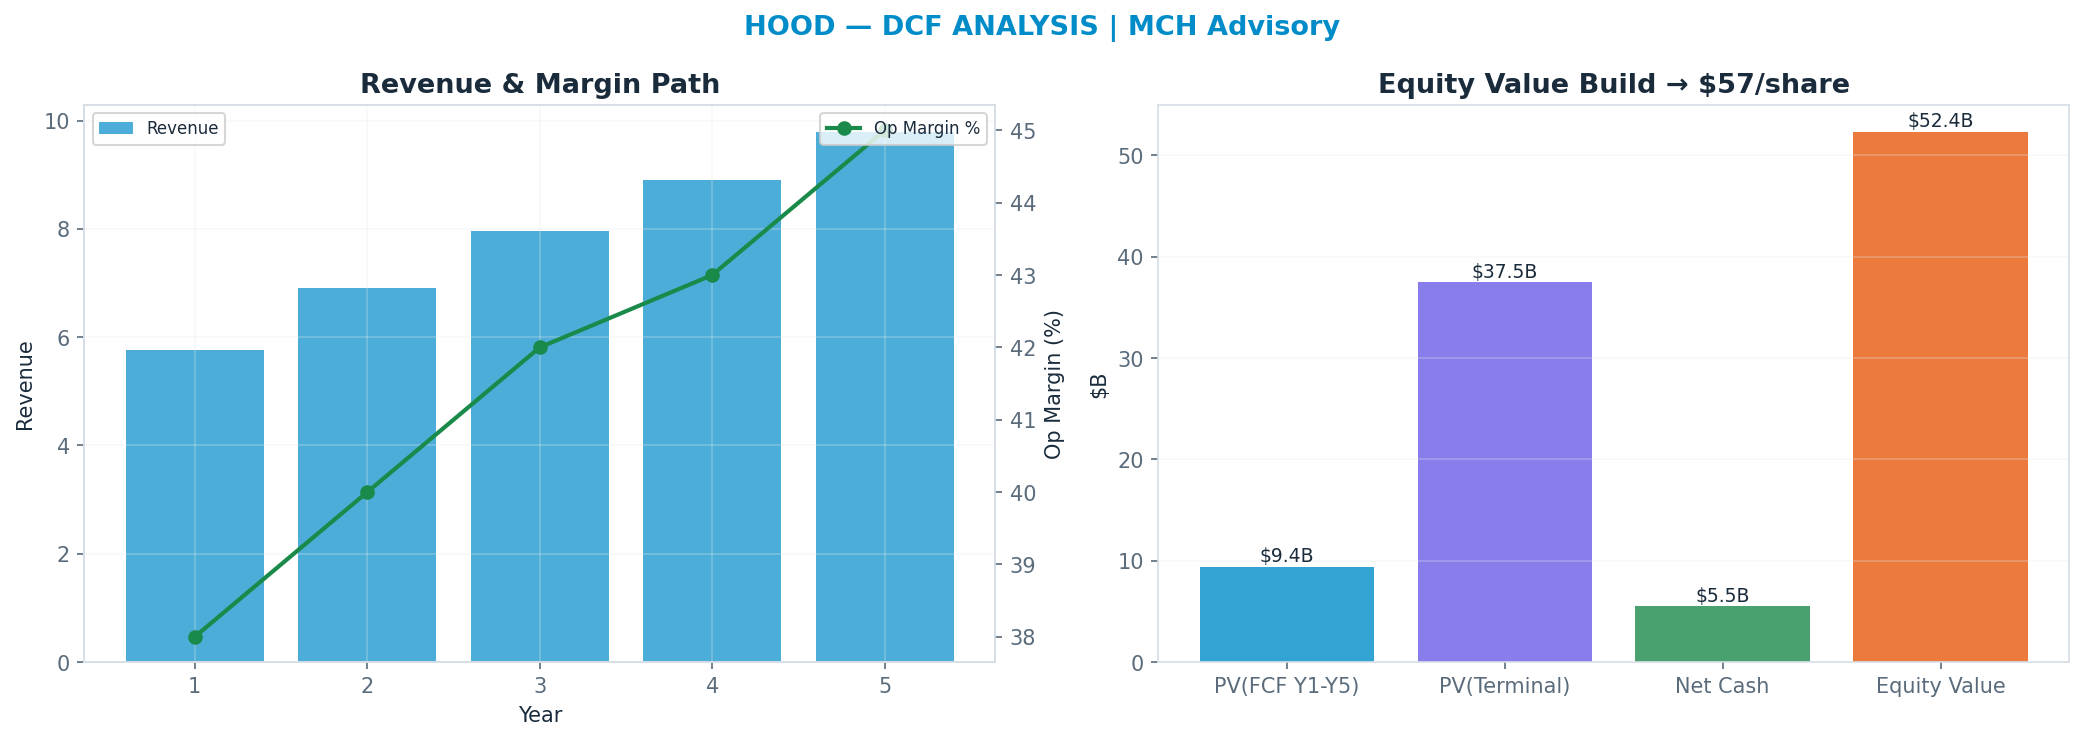
DCF — the cash-flow anchor
Independent of the market multiple: a 5-year path, WACC 11.0%, 18x terminal FCF multiple → $57. This anchor is deliberately the heaviest (35%): it is the valuation least hostage to the current multiple regime.
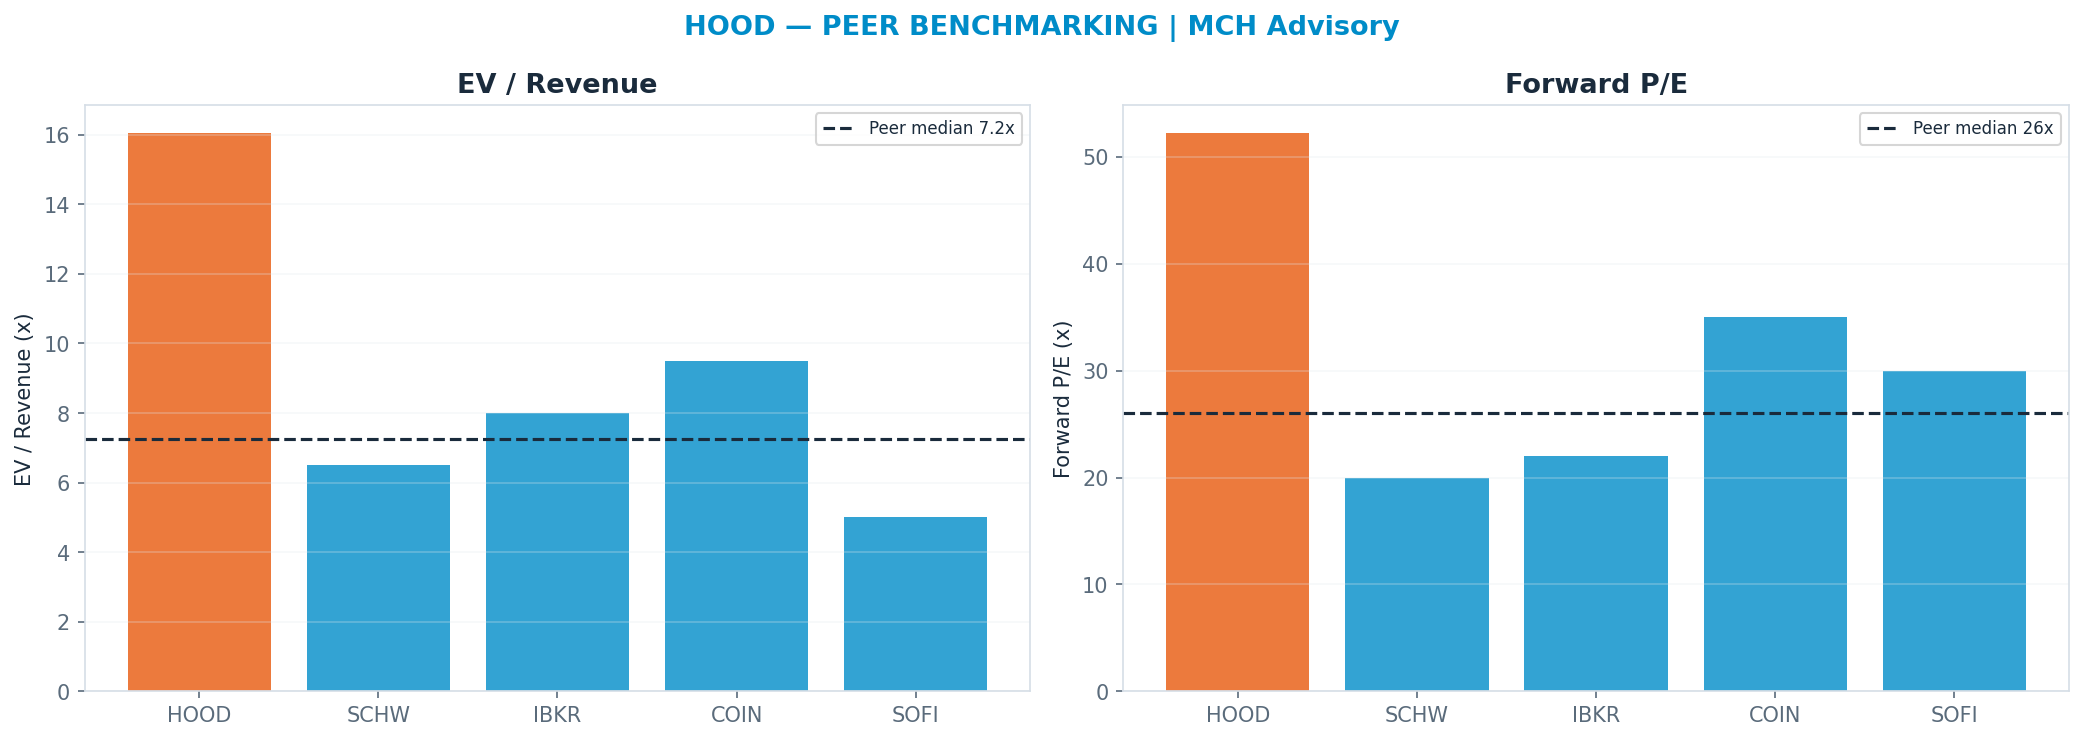
Peer benchmarking — relative value
Against the peer cohort, re-rating to the peer-median forward multiple (P/E 26.0x) implies $50. A premium is only justified by superior growth/margins; otherwise it is multiple risk. Weighted just 10% so the market's mood does not drive the fair value.
Sum-of-parts
Valuing each piece at the multiple it deserves (Equities + Options 8x, Crypto 6x, Net Interest Rev 9x, Gold + Subscriptions 12x) → $47. 'Equities + Options' dominates at 8.0× → $14B (38% of EV) — the segment whose multiple matters most.
Across all anchors the spread is wide (genuine disagreement — low valuation confidence).
Revenue-Segment Breakdown
The company-specific drivers behind the valuation — each segment carries its own growth, margin, multiple and capex intensity. (Tags: FACT reported · ESTIMATE from disclosures · INFERENCE judgment.)
| Segment | Revenue | Mix | Growth | Op margin | Multiple | Capex % | Tag |
|---|---|---|---|---|---|---|---|
| Transaction-based — Equities & Options | $1.5B | 33% | 20% | 55% | 14x | 1% | FACT/ESTIMATE |
| Transaction-based — Crypto | $0.9B | 20% | 25% | 50% | 10x | 1% | FACT/ESTIMATE |
| Net Interest Revenue | $1.4B | 30% | 10% | 65% | 8x | 0% | FACT/ESTIMATE |
| Other (Gold, Cards, Advisory/Retirement) | $0.8B | 17% | 30% | 45% | 18x | 2% | FACT/ESTIMATE |
Named Exposures
Crypto & market cyclicality (FACT/INFERENCE)
| Dimension | Assessment |
|---|---|
| Crypto share of transaction revenue | ~30-40% of transaction-based revenue and ~20% of total revenue (est.); swings sharply quarter-to-quarter with retail crypto activity |
| Engagement dependence | Revenue is geared to retail trading volume, which rises with volatility/speculation and falls in quiet tapes — high operating sensitivity to sentiment |
| Boom-bust history | 2021 retail/crypto boom inflated revenue; 2022 bust cut transaction revenue >50% YoY and drove a multi-quarter drawdown — a demonstrated structural-cyclicality risk, not hypothetical |
| Concentration | Transaction-based lines together are ~50-55% of revenue and are the most cyclical; a crypto winter compresses both volume and take-rate simultaneously |
| Tail risk | A crypto bear market plus a flat-vol equity tape can hit two transaction lines at once — correlated, not diversifying |
Rate sensitivity & regulation (ESTIMATE/INFERENCE)
| Dimension | Assessment |
|---|---|
| NII rate sensitivity | Net interest revenue (~30% of total) is rate-sensitive; a return toward zero-rate conditions could cut NII materially (est. order of magnitude: a sustained ~200bp cut pressures NII by a high-single to low-double-digit percent, balance-dependent) |
| Balance sensitivity | NII also scales with margin balances, cash-sweep deposits and securities-lending — outflows in a risk-off shock compress the base independently of rates |
| PFOF regulatory risk | Payment-for-order-flow underpins equities/options transaction revenue; an SEC ban or restriction (periodically debated) is a direct structural threat to the largest transaction line |
| Crypto regulatory risk | Token-listing scope, custody, staking and exchange registration remain contested; adverse rulings could force delistings or raise compliance cost on the crypto line |
| Mitigants | Diversification into Gold subscriptions, cards, retirement and advisory reduces single-line dependence over time, but does not offset a simultaneous rate-cut + PFOF-restriction shock |
Industry Context — Consumer Platforms
This name sits in the Consumer Platforms as a retail brokerage / fintech platform (equities, options, crypto). Net interest income on customer cash makes HOOD directly rate-sensitive; but the dominant swing factor is the crypto cycle and retail trading engagement, plus PFOF/crypto regulatory risk. Its scenarios are not guessed in isolation — they inherit a single, shared view of the cluster's driver cycle, so the names that depend on the same event are mutually consistent.
Value chain: UBER (mobility/delivery platform (Rides + Eats + Freight)) · HOOD (retail brokerage / fintech platform (equities, options, crypto))
| Shared state | Capex path | House view | This name implies |
|---|---|---|---|
| Consumer Recession / Regulatory | consumer pulls back + rate cuts hit NII; adverse regulatory rulings (gig reclassify / crypto crackdown) | 22% | 20% |
| Soft Patch / Disruption | sluggish consumer + the name-specific disruption tail bites (AV share for UBER, retail engagement fade for HOOD) | 18% | 15% |
| Base | steady consumer, rates drift, regulation manageable | 35% | 32% |
| Consumer Strength / Re-rate | strong consumer + risk-on tape; AV becomes a partner tailwind, crypto/product expansion inflects | 25% | 33% |
On the cluster's key downside — Consumer Recession / Regulatory (consumer pulls back + rate cuts hit NII; adverse regulatory rulings (gig reclassify / crypto crackdown)) — this name implies 20% vs the cluster house view of 22% (in line with the house). The cluster's full cross-stock reconciliation governs that the names which ride the same capex cycle assign it comparable odds.
Structure: Consumer Demand — Both depend on discretionary consumer activity — UBER on ride/delivery frequency, HOOD on retail trading engagement. Soft consumer confidence pressures both, but via different mechanisms. (INFERENCE) Rate Sensitivity — HOOD is directly rate-sensitive via net interest income on customer cash/margin balances; UBER is indirectly rate-sensitive through consumer spending power and (more importantly) the discount rate applied to a long-duration growth/AV-optionality valuation. (FACT) Regulation — UBER faces gig-worker classification risk (driver reclassification raises cost structure); HOOD faces payment-for-order-flow (PFOF) scrutiny and crypto/securities regulatory overhang. Shared theme: both are regulated consumer-facing platforms exposed to policy shifts. (FACT) Disruption Tails — UBER's tail is robotaxi/AV (Waymo/Tesla) — a partner-and-supply upside or a network-displacement downside. HOOD's tail is the crypto cycle — a structural bust that removes a high-margin revenue and engagement pillar. These tails are uncorrelated with each other. (INFERENCE)
Model Appendix
DCF — line items
| Year | Revenue | Op income | − Capex | + D&A | FCF | PV(FCF) |
|---|---|---|---|---|---|---|
| FY+1 | $6B | $2B | $0B | $0B | $2B | $2B |
| FY+2 | $7B | $3B | $0B | $0B | $2B | $2B |
| FY+3 | $8B | $3B | $0B | $0B | $3B | $2B |
| FY+4 | $9B | $4B | $0B | $0B | $3B | $2B |
| FY+5 | $10B | $4B | $0B | $0B | $4B | $2B |
| Terminal | — | — | — | — | $4B × 18x | $37B |
FCF is bridged: NOPAT + D&A − Capex − ΔNWC (capex intensity 1% of revenue, weighted from the segments) — not a single conversion fudge.
WACC 11.0% · Σ PV(FCF) $9B + PV(terminal) $37B = EV $47B; + net cash → equity $52B ÷ diluted shares 0.92B = $57/share (exit-multiple terminal).
- Gordon (perpetuity-growth) terminal at 2.5% → $44/share — a genuinely non-multiple, cash-based cross-check; the exit-multiple and Gordon values bracket the terminal-value risk.
- Incremental ROIC on the forecast capex ≈ 519% vs WACC 11% → above WACC — the build is value-creative.
Peer set
| Peer | EV/Rev | Fwd P/E | Growth | Op margin |
|---|---|---|---|---|
| SCHW | 6.5x | 20x | 8% | 43% |
| IBKR | 8.0x | 22x | 15% | 70% |
| COIN | 9.5x | 35x | 25% | 38% |
| SOFI | 5.0x | 30x | 20% | 15% |
| Median | 7.25x | 26.0x | — | — |
Peer-median fwd P/E → $50; EV/Rev → $49.
Weighted fair-value math
| Anchor | Value | Weight | Contribution |
|---|---|---|---|
| DCF | $57 | 35% | $20 |
| Scenario PWEV | $79 | 25% | $20 |
| Monte Carlo median | $55 | 15% | $8 |
| Sum-of-parts | $47 | 15% | $7 |
| Peer P/E | $50 | 10% | $5 |
| Triangulated | — | 100% | $60 |
Sensitivity
DCF/share — WACC × terminal multiple
| WACC \ Term× | 12.6x | 15.3x | 18.0x | 20.7x | 23.4x |
|---|---|---|---|---|---|
| 9% | $48 | $55 | $62 | $68 | $75 |
| 10% | $46 | $53 | $59 | $66 | $72 |
| 11% | $45 | $51 | $57 | $63 | $69 |
| 12% | $43 | $49 | $55 | $61 | $67 |
| 13% | $42 | $47 | $53 | $59 | $64 |
DCF/share — revenue CAGR Δ × op-margin Δ
| CAGRΔ \ MgnΔ | -3.0pp | -1.5pp | +0.0pp | +1.5pp | +3.0pp |
|---|---|---|---|---|---|
| -3.0pp | $48 | $50 | $51 | $53 | $54 |
| -1.5pp | $51 | $53 | $54 | $56 | $57 |
| +0.0pp | $54 | $55 | $57 | $59 | $61 |
| +1.5pp | $57 | $58 | $60 | $62 | $64 |
| +3.0pp | $60 | $61 | $63 | $65 | $67 |
Tornado — DCF/share swing by driver (widest first)
| Driver | Low | High | Swing |
|---|---|---|---|
| Terminal × ±15% | $51 | $63 | $12 |
| Revenue CAGR ±3pp | $51 | $63 | $12 |
| Op margin ±3pp | $54 | $61 | $7 |
| WACC ±1pp | $55 | $59 | $4 |
| FCF conversion ±10% | $57 | $57 | $0 |
Company lever — SoP/share vs Other (Gold, Cards, Advisory/Retirement) multiple (AI re-rating) (base 18x)
| Multiple | 12.6x | 15.3x | 18.0x | 20.7x | 23.4x |
|---|---|---|---|---|---|
| SoP/share | $72 | $75 | $77 | $80 | $83 |
Load-Bearing Assumptions
DCF: WACC 11%, terminal multiple 18×, FY+5 revenue $10B. Triangulation leans 35% on DCF, 25% on PWEV.
Reasons the Thesis Could Fail (Falsifiable)
P(>current)=11.9% below 30% band — bear weighting or opex may be too severe; verify. The valuation is multiple-dependent (84% of variance); a de-rating toward the DCF anchor ($57) implies -43%.
Fact / Inference / Speculation
- FACT: Spot $100; 52-week range $64–$154; engine rating SELL; base-case target $79 (-21%).
- INFERENCE: Triangulated FV $60 (-40%). P/E Multiple explains 84% of Monte Carlo outcome variance — i.e. value is set by the multiple the market will pay, a rate/sentiment regime bet as much as an earnings bet.
- SPECULATION: At current prices the embedded bet is that the multiple holds or expands — P/E Multiple carries 84% of outcome variance.
Recommendation: SELL
Defensive: rating SELL; triangulated fair value $60 (-40% vs spot) — the risk/reward is skewed to the downside on P/E Multiple. The debate is P/E Multiple (84% of variance) — fundamentally a multiple/regime call. SBC runs 450M TTM (disclosed in the appendix).