Rating: HOLD
HOLD (5-tier) · turnaround · conviction: medium
| Metric | Value |
|---|---|
| Current Price | $211 |
| Triangulated Fair Value | $179 (-15% vs spot · triangulated FV) |
| 12-mo Scenario PWEV | $214 (+1% vs spot · 12m PWEV) |
| Forward P/E | 24.7x |
| Market Cap | $65B |
| 52-Week Range | $192–$298 |
EPS basis for the forward P/E and all scenario multiples: consensus forward EPS (broker-adjusted, non-GAAP).
Methodology: Valuation triangulated across five independent anchors — Monte Carlo (Student-t + regime switching), an independent DCF, peer re-rating, a sum-of-parts, and a scenario-weighted PWEV. Figures reconciled to Alpha Vantage 2026-07-27. Each chart below sits with the part of the thesis it evidences.
General research for a skeptical institutional reader. Not personalised investment advice; no position sizing or trade instructions. Figures as of the analysis date; verify before acting.
Investment Committee Summary
| Rating | HOLD · HOLD (5-tier) |
| Classification · conviction | turnaround · medium |
| Triangulated fair value | $179 (-15% vs spot · triangulated FV) |
| 12-mo scenario PWEV | $214 (+1% vs spot · 12m PWEV) |
| Next catalyst | 2026-08-05 — Quarterly earnings |
| Primary thesis-break | Commercial aftermarket revenue growth (YoY) < 0 (2 consecutive quarters) |
📎 Download the full model (Excel) — DCF line items, scenarios, sensitivity, assumptions, and extended fundamentals.
Rating Bridge
Rating = HOLD because:
- Probability-weighted scenario value implies +1% vs spot
- Monte Carlo median implies -1% vs spot
- DCF fair value implies -33% vs spot — but this is terminal-value sensitive (exit-multiple $142 vs Gordon $114, 20% apart), so it carries less weight
- Bear case (Structural — Defense-Budget Cuts / Aero-Production Halt) downside is -55% vs spot
- Net: reward/risk of 0.3× is not asymmetric enough for a Buy and not impaired enough for a Sell — hence Hold.
Company Overview & Business Model
Honeywell Aerospace Inc — INDUSTRIALS · AEROSPACE & DEFENSE. None
Edge. Wide moat — The moat is the installed base and the certification barrier around it, not the technology. Aerospace components are certified to a platform; once HONA content is on a wing, the aftermarket revenue for that airframe's 25-30 year life is effectively annuitised — a competitor has to win the next platform and then wait a decade for the base to turn. That supports a premium terminal multiple relative to industrial peers, but it is an aftermarket-weighted premium: it is justified by the ~40% of revenue that is recurring service and spares, and it is NOT extended to the OE or defence-programme revenue, which is competitively bid and margin-capped. A terminal multiple in the low-to-mid 20s is defensible on that mix; anything materially above it prices a re-rate rather than the franchise.
Investment Thesis
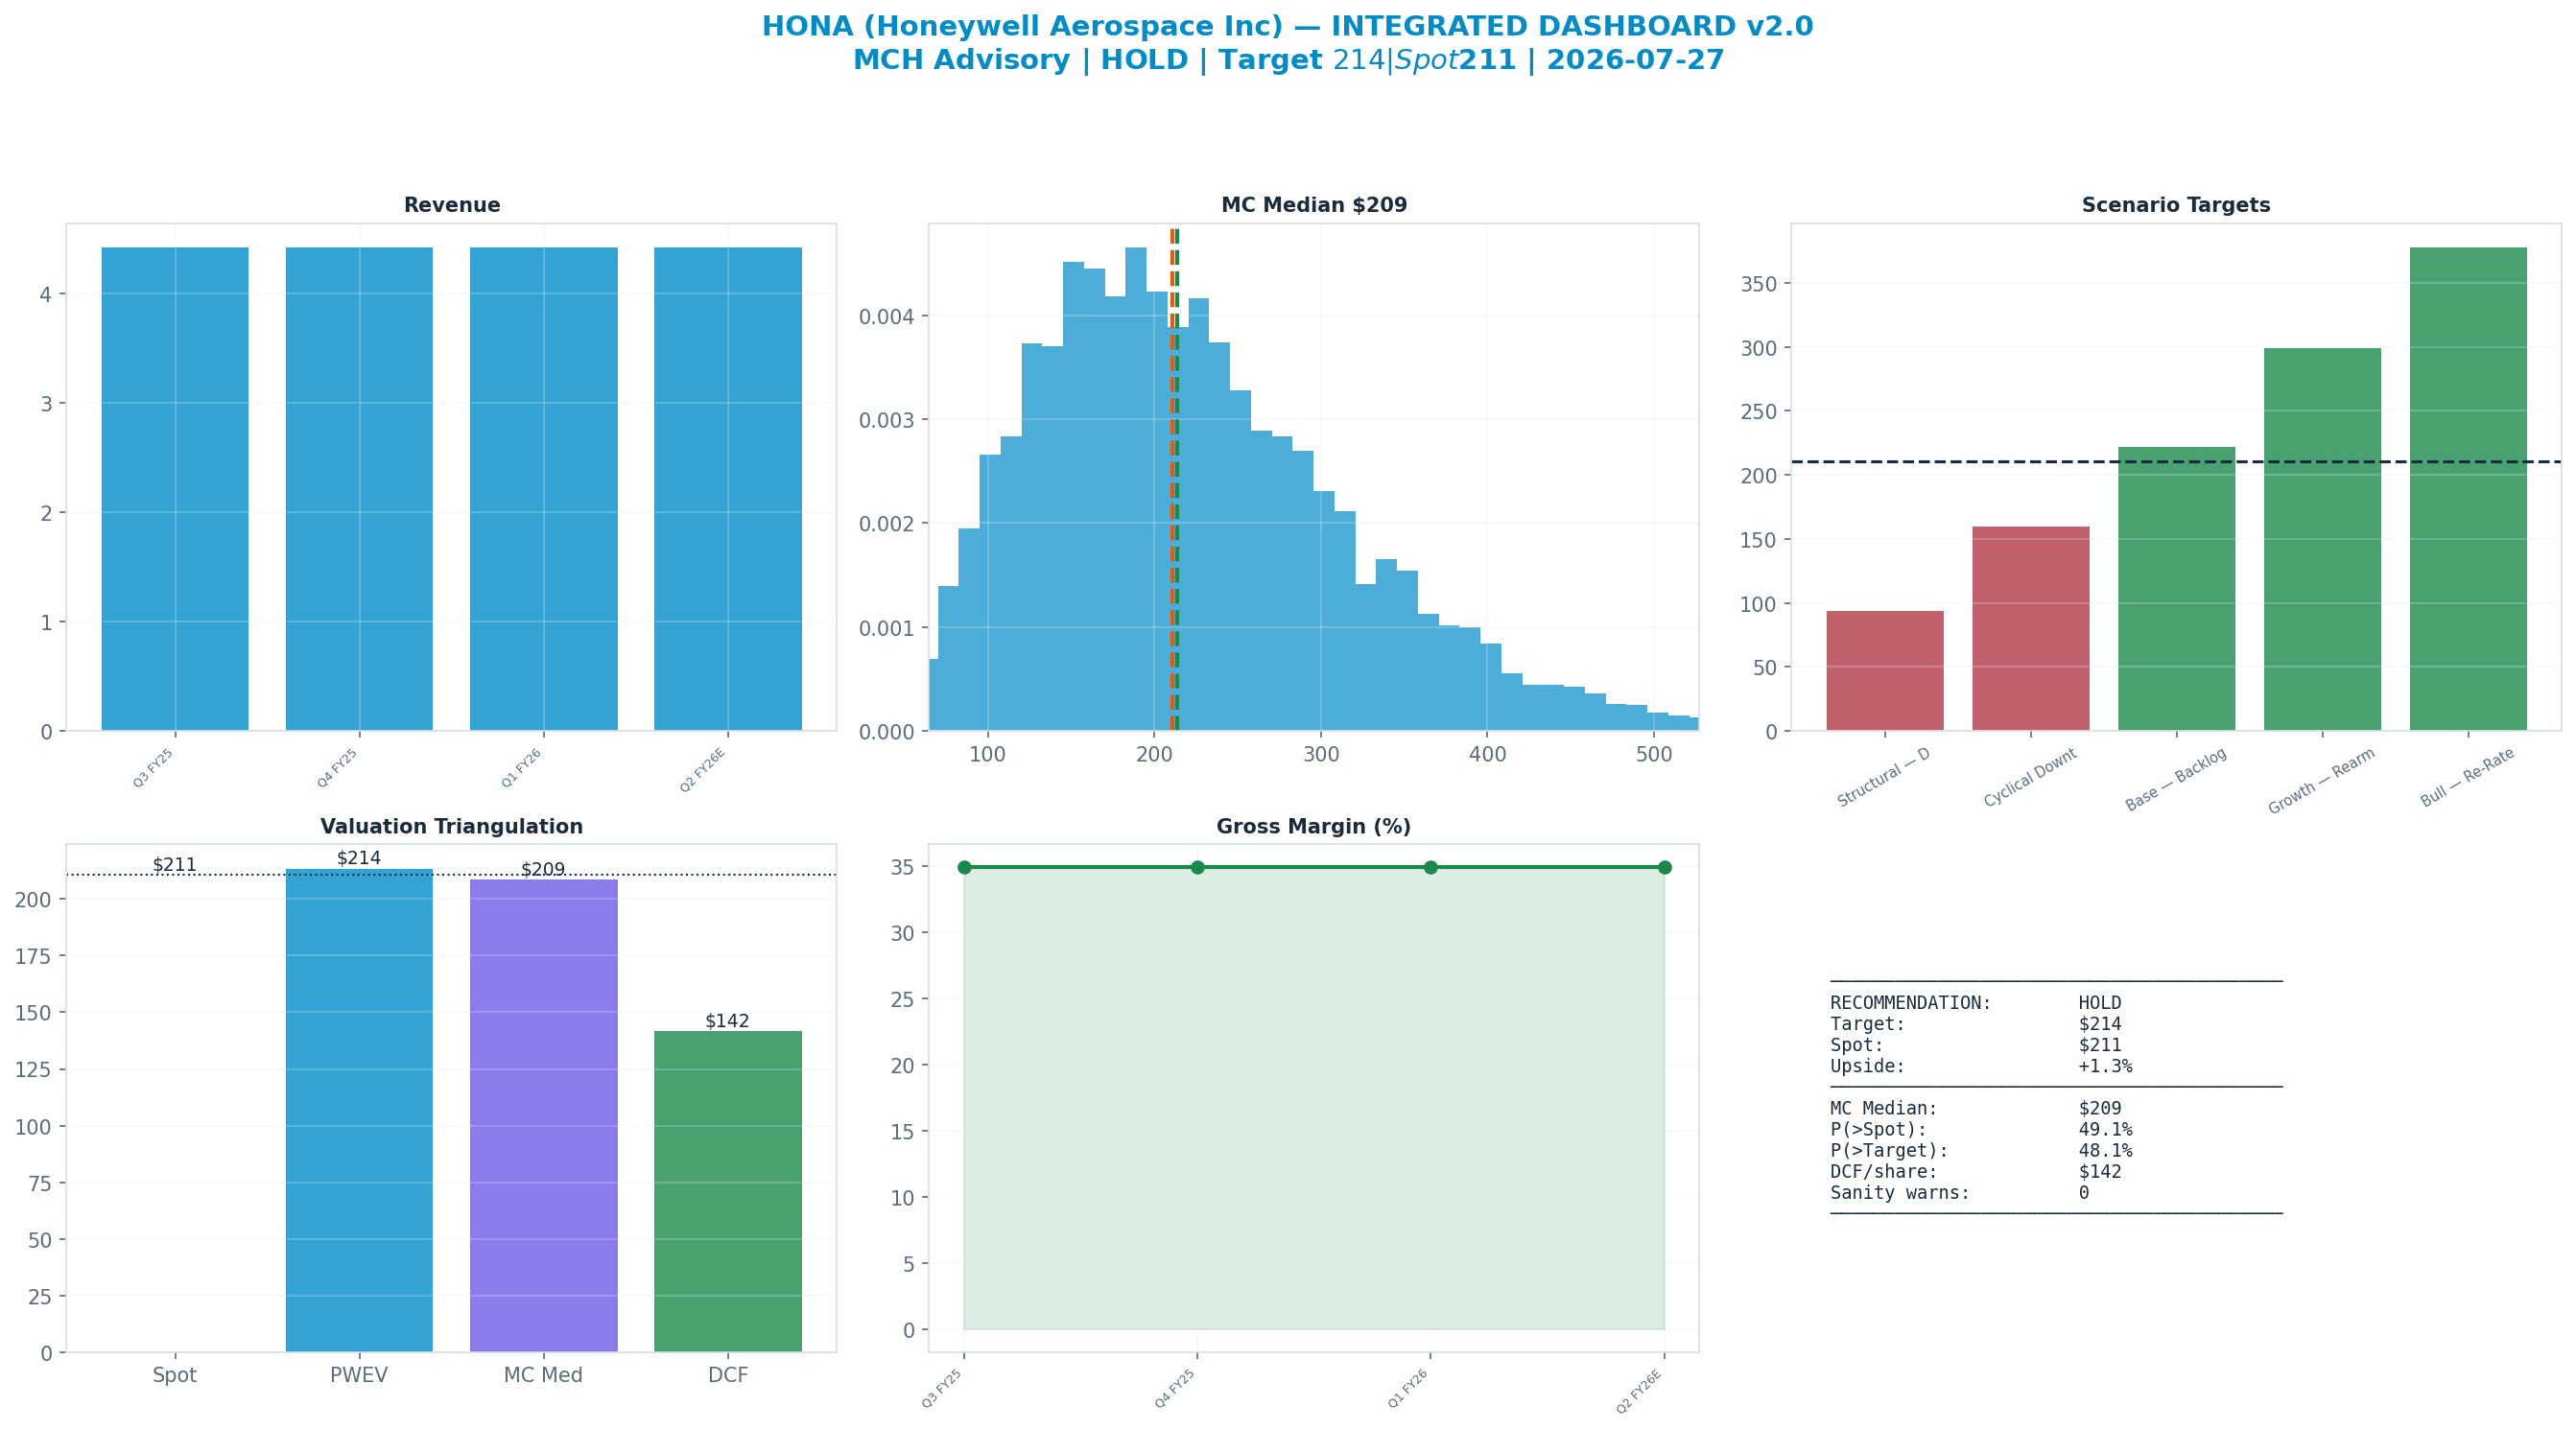
At $211 (28 July 2026) HONA is the rarest thing in aerospace supply: a pure-play with an aftermarket-weighted mix and no conglomerate discount attached. The end-market split is the whole argument — roughly 40% commercial aftermarket, 45% defence & space, and only ~15% commercial OE. That is the inverse of the usual supplier problem. OE work is where aerospace margins go to die (content is won at low or negative margin to install a base); HONA carries the least of it and the most of what OE exists to create. The installed base spans virtually every commercial and defence platform flying, and aftermarket revenue tracks flight hours and mandated maintenance intervals, not new-build rates — so the cash engine is decoupled from the OEM delivery cycle that whipsaws its peers. A ~$18.4B backlog against $17.7B of annual revenue gives better-than-one-year visibility, and defence at 45% is contracted, slow-moving work that keeps the trough shallow. On $211 the market pays ~24.7x forward earnings for a 20.2% operating margin business with that mix. The bull case is not heroic growth: it is that a standalone board allocates capital to the aftermarket franchise rather than funding a diversified parent, and that the multiple converges on aerospace pure-play peers as two or three clean standalone quarters accumulate.
The dashboard below is the whole argument on one page: spot ($211) against each valuation anchor, the scenario tree, technicals and the options-implied move.
Anti-Thesis (The Real Bear Case)
The bear case is the balance sheet and the calendar, not the franchise. HONA came public carrying $14.85B of net debt against roughly $3.6B of EBIT — leverage in the 3.5-4x area, which is a spin-co structure, not a choice, and it is the first thing to bite if either end market softens. Two of them can: the ~40% aftermarket is a flight-hours annuity that has never been tested in this configuration, and a travel downcycle hits the highest-margin revenue first and hardest; the ~45% defence exposure is contracted but hostage to budget cycles and appropriations timing, which converts a growth story into a flat one without any operational failure. Layer on the ordinary spin-co frictions — standalone public-company cost, dis-synergies the parent used to absorb, no independent operating history for the market to underwrite, and index/holder churn as former HON holders who wanted a diversified industrial sell a pure-play they did not choose. At 24.7x forward there is no discount for any of that. The structural case does not need a recession: it needs leverage to stay high while aftermarket growth normalises to GDP-plus, and the multiple to de-rate toward the low-to-mid teens that levered, defence-weighted suppliers have historically earned.
Key Debate
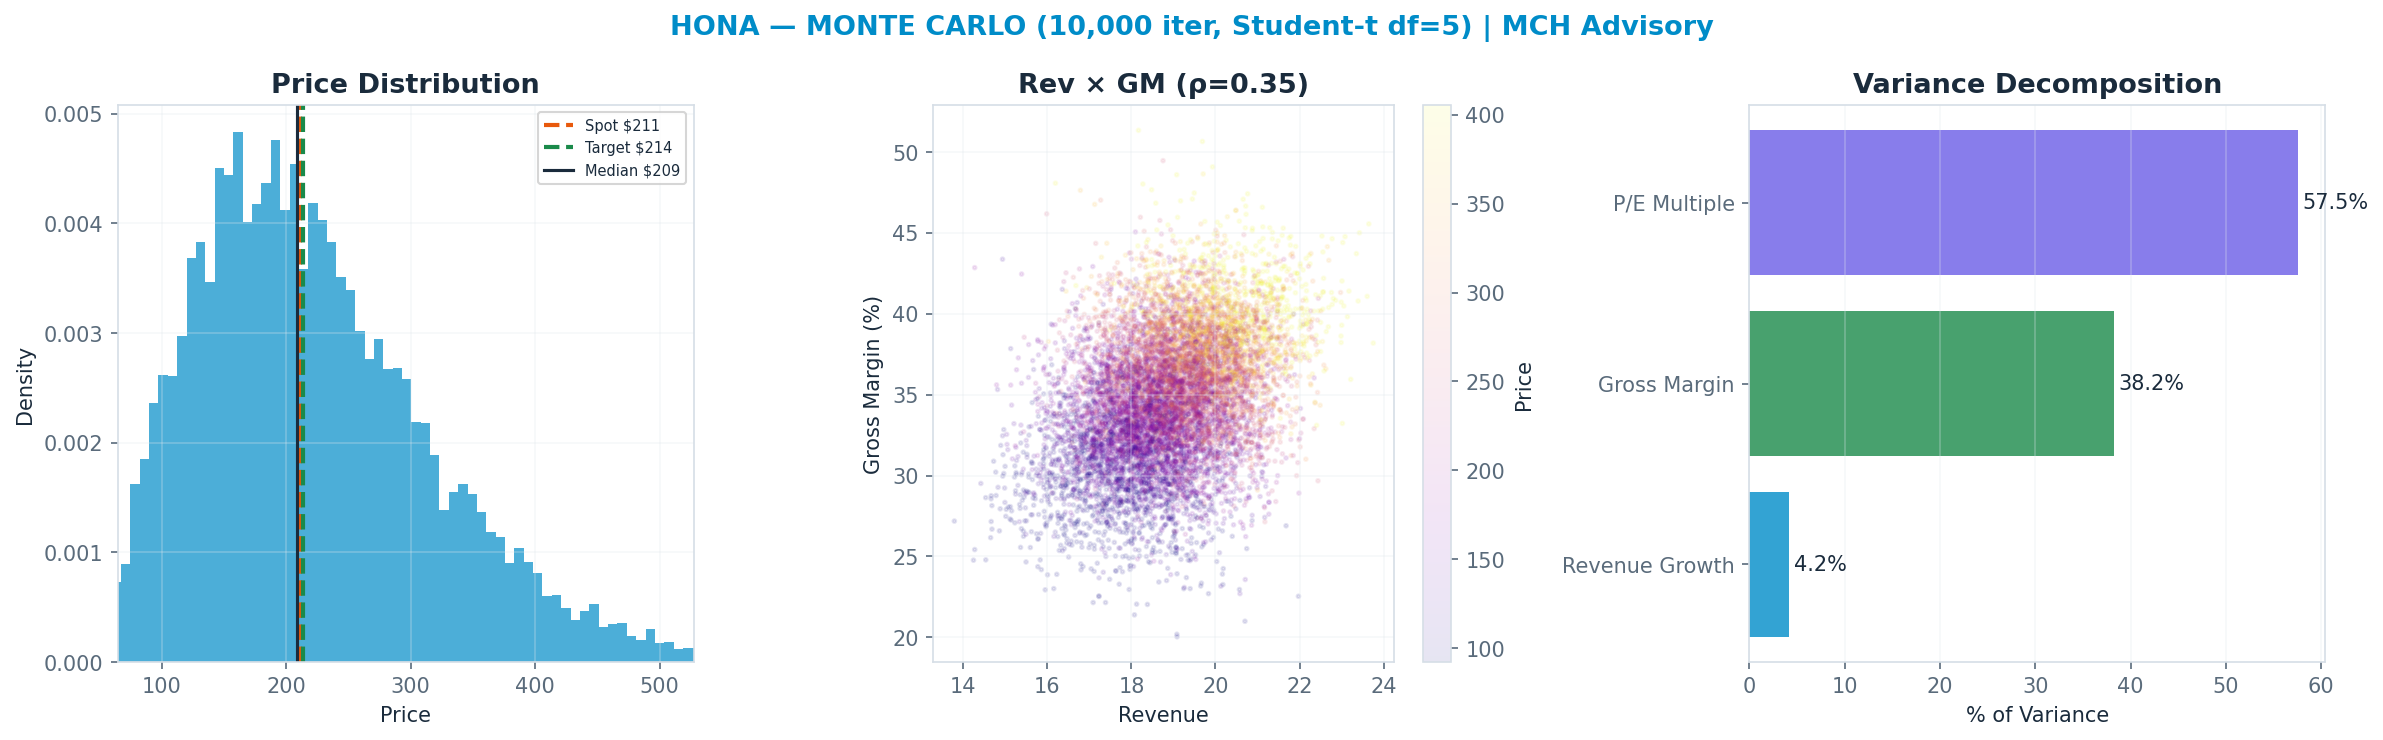
P/E Multiple explains 58% of Monte Carlo outcome variance — i.e. value is set by the multiple the market will pay, a rate/sentiment regime bet as much as an earnings bet.
Scenario Analysis
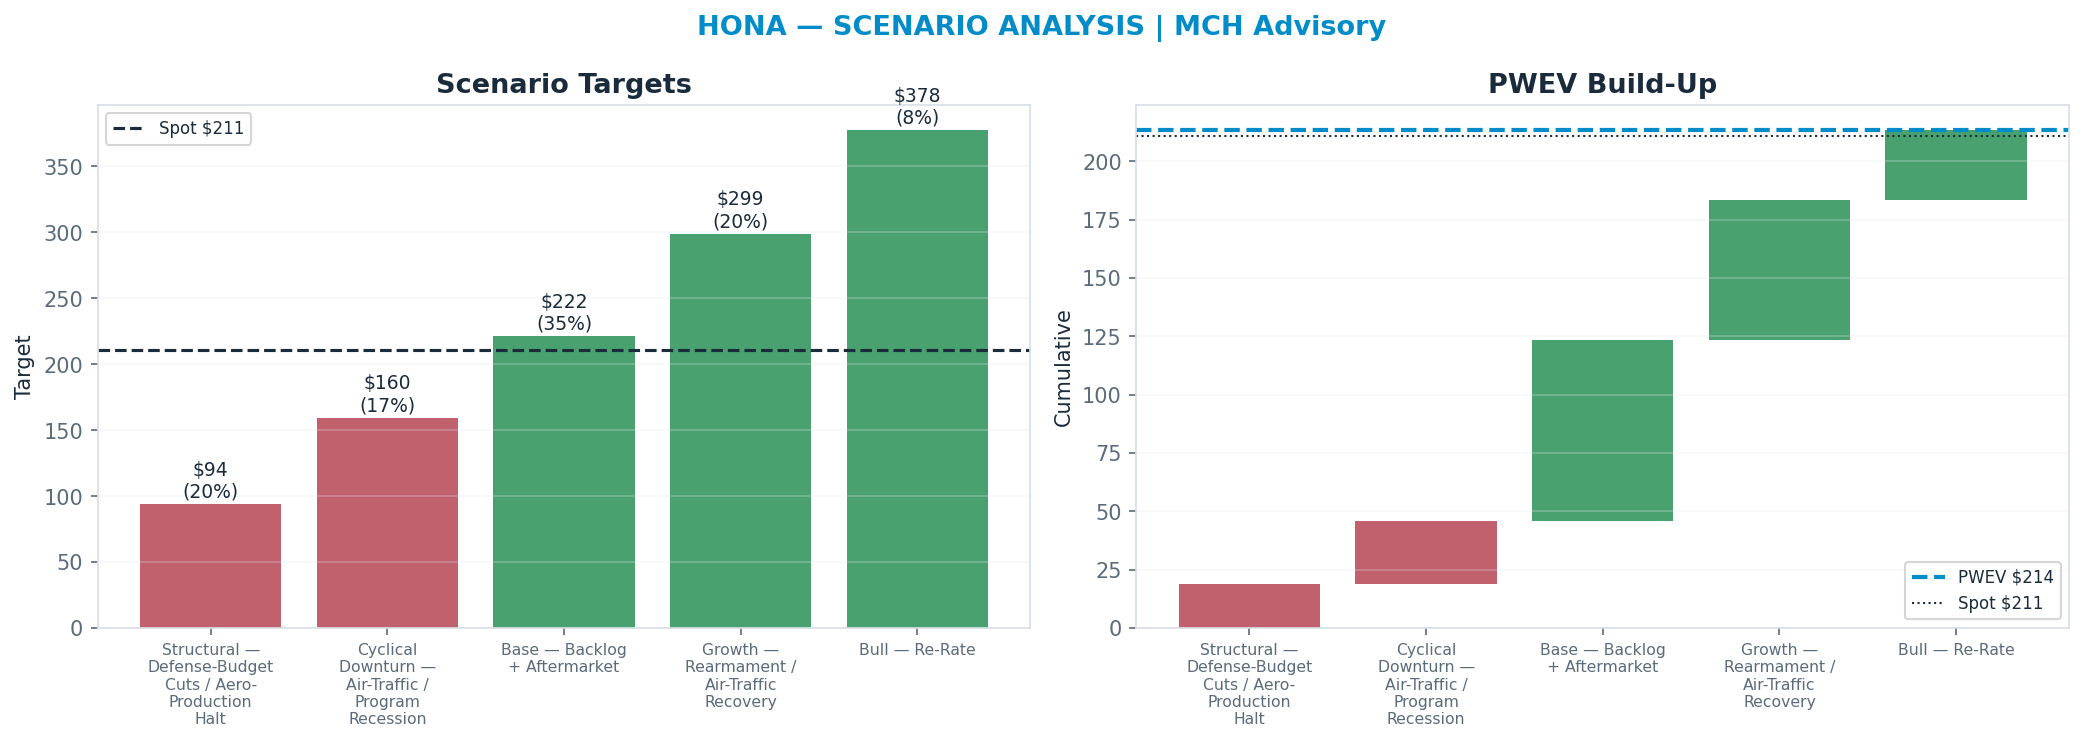
The tree runs from a structural 'Structural — Defense-Budget Cuts / Aero-Production Halt' downside ($93.94) to a 'Bull — Re-Rate' bull case ($378); the probability-weighted blend (PWEV $214) is +1% versus spot.
| Scenario | Probability | Target | Return vs spot |
|---|---|---|---|
| Structural — Defense-Budget Cuts / Aero-Production Halt | 20% | $93.94 | -55% |
| Cyclical Downturn — Air-Traffic / Program Recession | 17% | $160 | -24% |
| Base — Backlog + Aftermarket | 35% | $222 | +5% |
| Growth — Rearmament / Air-Traffic Recovery | 20% | $299 | +42% |
| Bull — Re-Rate | 8% | $378 | +79% |
| Probability-Weighted (PWEV) | — | $214 | +1% |
Scenario rationale — what each probability buys (the driver path behind every target):
Valuation Triangulation
Five anchors — but read them with their basis in mind. The Monte Carlo, the DCF terminal, and the peer re-rate all key off a market multiple, so they are not fully independent; only the discounted cash flows themselves are genuinely multiple-free. The discipline is to read the spread and weight the cash-based view, not to treat five numbers as five independent votes.
| Method | Basis | Fair Value | vs Spot |
|---|---|---|---|
| Monte Carlo median (Student-t + regime) | multiple | $209 | -1% |
| Peer EV/Revenue re-rate | multiple | $99.73 | -53% |
| Scenario PWEV | multiple | $214 | +1% |
| DCF (5-year + terminal) | cash flow + terminal × | $142 | -33% |
| Triangulated (weighted) | — | $179 | -15% |
Peer EV/Revenue re-rate — 0% weight: it duplicates the peer-multiple information already carried by the Peer P/E anchor while ignoring margin mix; weighting both would double-count the peer view. Shown as a cross-check.
Rating vs blend — the key debate. The rating tracks the multiple-discipline fair value (Monte Carlo $209 + scenario PWEV $214, ≈ spot); the weighted blend $179 (-15%) sits below it because the cash-flow DCF ($142) is materially more conservative than the market multiple. Whether the current multiple is justified is the central question for this name — and the principal downside risk to the rating.
Monte Carlo — the distribution, not a point
10,000 paths, Student-t shocks (fat tails) with a regime-switching overlay. The median lands at $209 and 49% of paths finish above spot. The variance decomposition shows the p/e multiple is the dominant swing factor (58% of variance). Value is a multiple bet: fundamentals move the answer far less than the rating does.
DCF — the cash-flow anchor
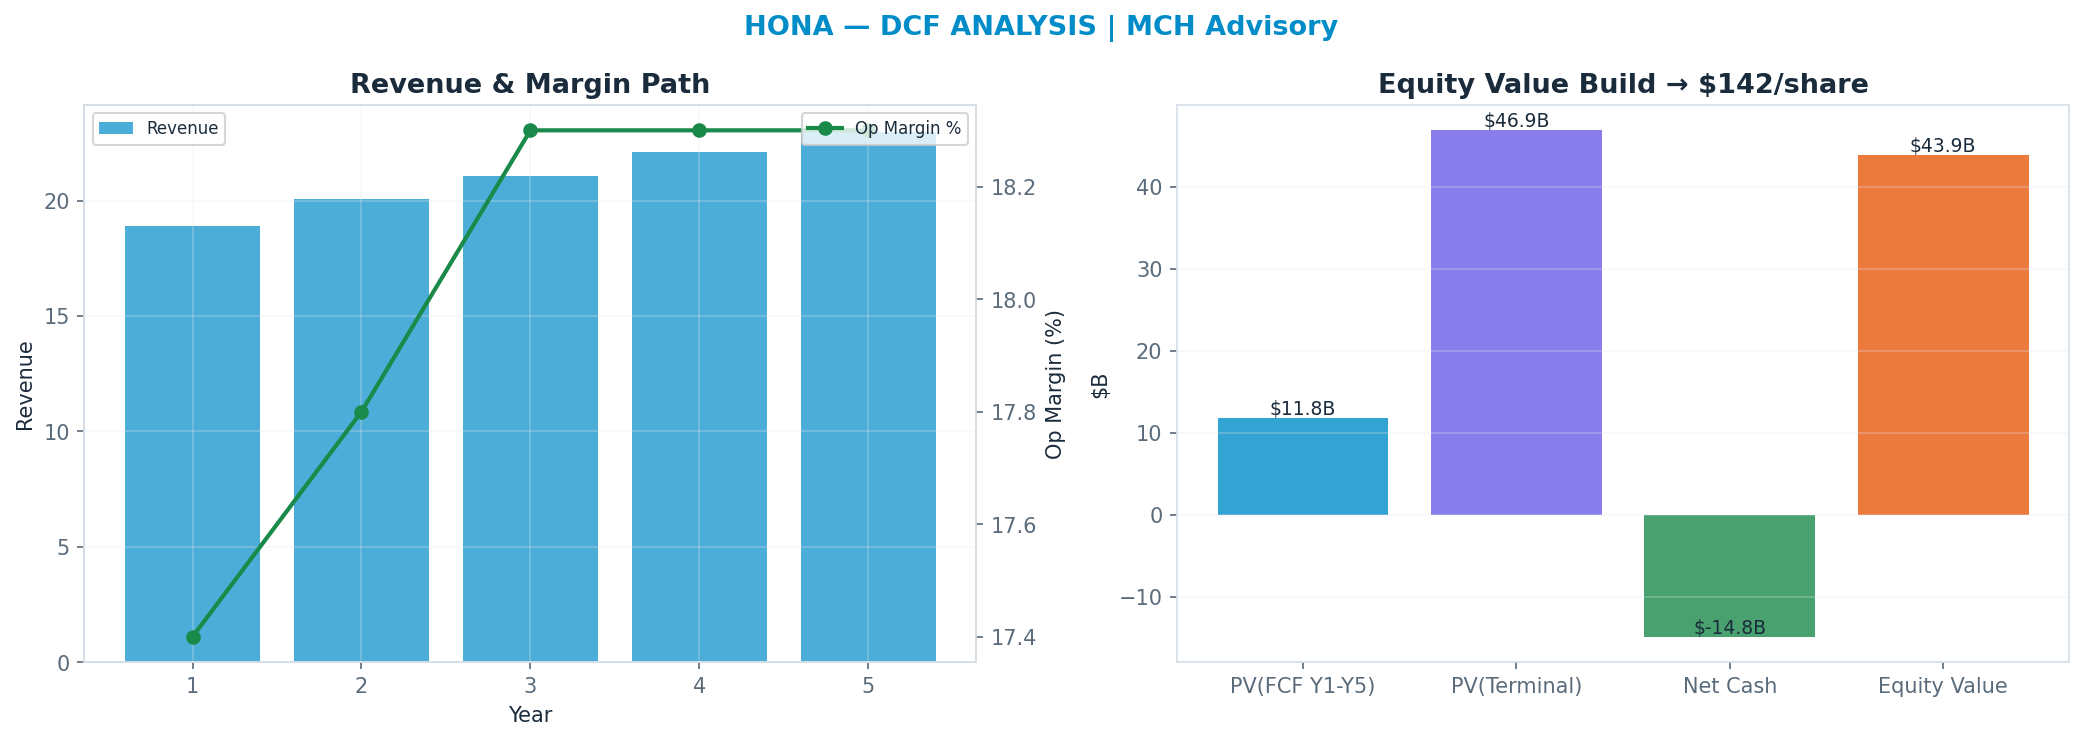
Independent of the market multiple: a 5-year path, WACC 8.5%, 21x terminal FCF multiple → $142. This anchor is deliberately the heaviest (47%): it is the valuation least hostage to the current multiple regime.
Peer benchmarking — relative value
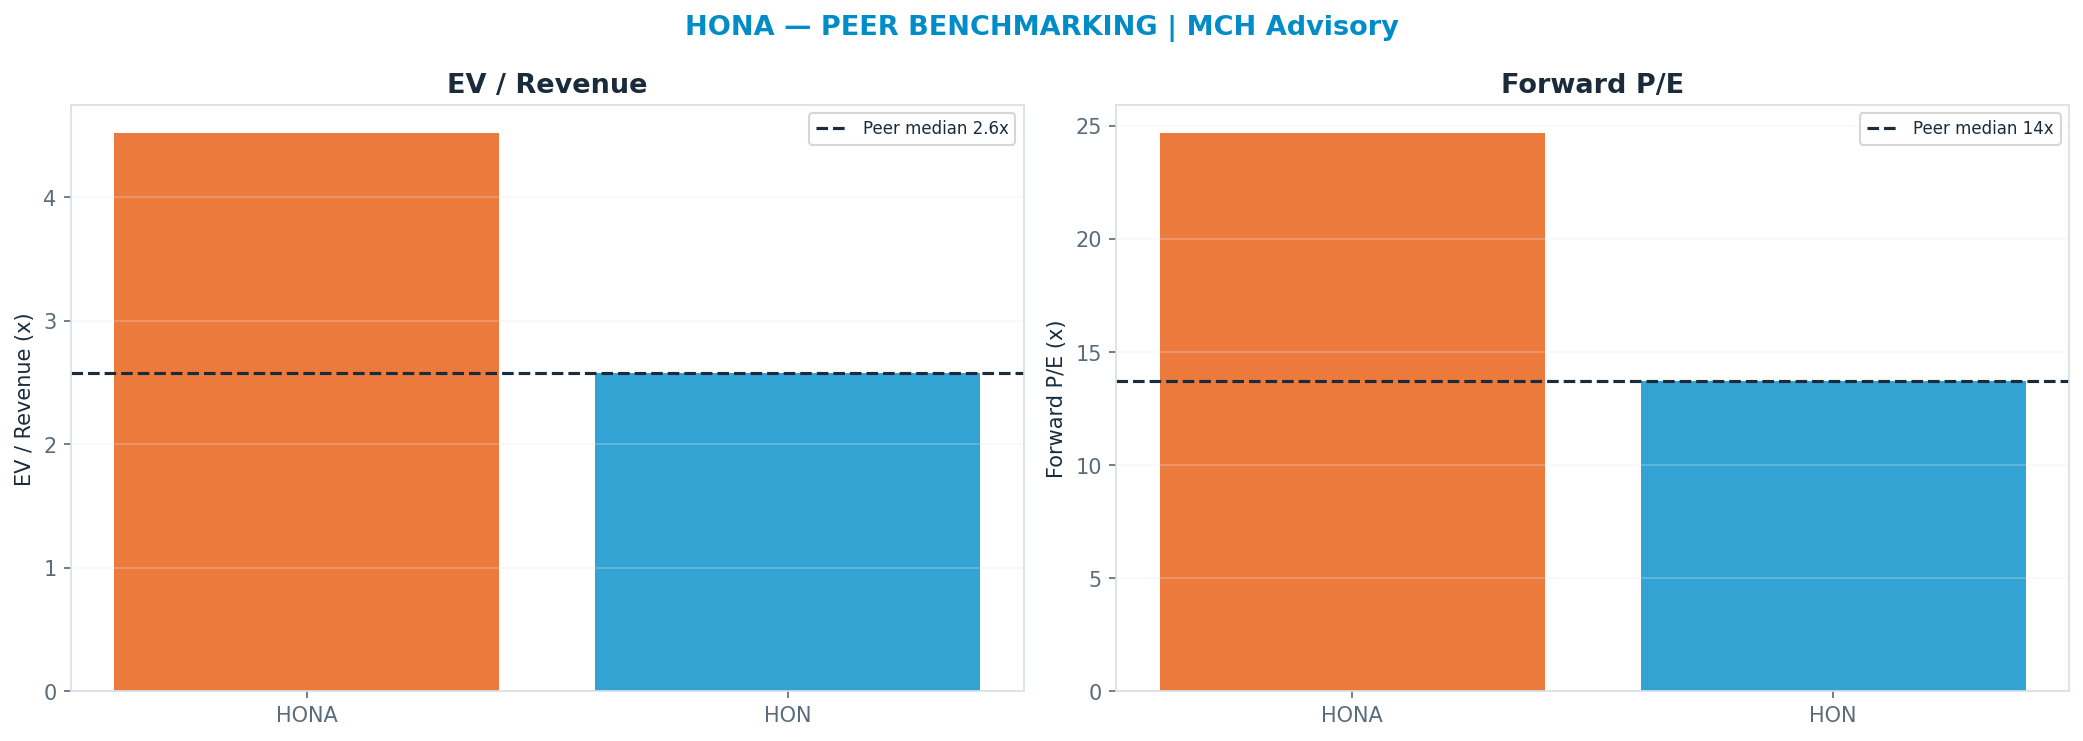
Against the peer cohort, re-rating to the peer-median forward multiple (P/E 13.74x) implies —. A premium is only justified by superior growth/margins; otherwise it is multiple risk. Weighted just 0% so the market's mood does not drive the fair value.
Across all anchors the spread is 55% of the median — wide (genuine disagreement — the blend carries low valuation confidence).
Named Exposures
Commercial aftermarket (~40% of revenue) (FACT/INFERENCE)
| Dimension | Assessment |
|---|---|
| Share of revenue | ~40% of FY25 revenue (FACT, company/sell-side disclosure) |
| Economics | Highest-margin revenue in the portfolio; spares and MRO on a certified installed base (INFERENCE — segment margins not yet disclosed) |
| Driver | Flight hours and maintenance intervals, not OEM build rates — decoupled from the delivery cycle (INFERENCE) |
| Risk | A travel downcycle hits this first and hardest; it is the profit engine, so the operating leverage runs both ways (INFERENCE) |
Defence & space (~45% of revenue) (FACT/INFERENCE)
| Dimension | Assessment |
|---|---|
| Share of revenue | ~45% of FY25 revenue (FACT) |
| Role | Backlog-supported ballast that keeps the trough shallow; slower-growing and competitively bid (INFERENCE) |
| Risk | Appropriations timing and budget cycles can flatten growth with no operational failure (INFERENCE) |
Commercial OE (~15% of revenue) (FACT/INFERENCE)
| Dimension | Assessment |
|---|---|
| Share of revenue | ~15% of FY25 revenue — deliberately the smallest leg (FACT) |
| Why it matters | OE is low/negative margin content won to install a base; carrying less of it than peers is a mix ADVANTAGE, not a coverage gap (INFERENCE) |
Balance sheet (spin-co leverage) (FACT/ESTIMATE)
| Dimension | Assessment |
|---|---|
| Net debt | $14.85B (FACT, Alpha Vantage balance sheet) |
| Leverage | ~3.5-4x EBIT on ~$3.6B EBIT — elevated, typical of a spin-co capital structure (ESTIMATE) |
| Consequence | Constrains buybacks/M&A until deleveraged; the first variable to bite if either end market softens (INFERENCE) |
Backlog (FACT)
| Dimension | Assessment |
|---|---|
| Size | ~$18.4B entering 2026 (FACT) — slightly above one year of revenue |
| Read | Better-than-one-year visibility on OE, engineering services and aftermarket support (INFERENCE) |
Model Appendix
DCF — line items
| Year | Revenue | Op income | FCF | PV(FCF) |
|---|---|---|---|---|
| FY+1 | $19B | $3B | $3B | $2B |
| FY+2 | $20B | $4B | $3B | $2B |
| FY+3 | $21B | $4B | $3B | $2B |
| FY+4 | $22B | $4B | $3B | $2B |
| FY+5 | $23B | $4B | $3B | $2B |
| Terminal | — | — | $3B × 21x | $47B |
WACC 8.5% · Σ PV(FCF) $12B + PV(terminal) $47B = EV $59B; − net debt $14.8B → equity $44B ÷ diluted shares 0.31B = $142/share (exit-multiple terminal).
- Gordon (perpetuity-growth) terminal at 2.5% → $114/share — a genuinely non-multiple, cash-based cross-check; the exit-multiple and Gordon values bracket the terminal-value risk.
Peer set
| Peer | EV/Rev | Fwd P/E | Growth | Op margin |
|---|---|---|---|---|
| HON | 2.58x | 13.74x | 10% | 21% |
| Median | 2.58x | 13.74x | — | — |
Peer-median fwd P/E → —; EV/Rev → $99.73.
Weighted fair-value math
| Anchor | Value | Weight | Contribution |
|---|---|---|---|
| DCF | $142 | 47% | $66.23 |
| Scenario PWEV | $214 | 33% | $71.17 |
| Monte Carlo median | $209 | 20% | $41.74 |
| Triangulated | — | 100% | $179 |
Sensitivity
DCF/share — WACC × terminal multiple
| WACC \ Term× | 14.7x | 17.8x | 21.0x | 24.1x | 27.3x |
|---|---|---|---|---|---|
| 6% | $109 | $134 | $159 | $183 | $209 |
| 8% | $102 | $126 | $150 | $174 | $198 |
| 8% | $96.00 | $119 | $142 | $164 | $187 |
| 10% | $91.00 | $112 | $134 | $155 | $178 |
| 10% | $85.00 | $106 | $127 | $147 | $168 |
DCF/share — revenue CAGR Δ × op-margin Δ
| CAGRΔ \ MgnΔ | -3.0pp | -1.5pp | +0.0pp | +1.5pp | +3.0pp |
|---|---|---|---|---|---|
| -3.0pp | $91.00 | $105 | $118 | $132 | $146 |
| -1.5pp | $101 | $115 | $130 | $144 | $159 |
| +0.0pp | $111 | $126 | $142 | $158 | $173 |
| +1.5pp | $121 | $138 | $155 | $171 | $188 |
| +3.0pp | $133 | $150 | $168 | $186 | $204 |
Tornado — DCF/share swing by driver (widest first)
| Driver | Low | High | Swing |
|---|---|---|---|
| Op margin ±3pp | $111 | $173 | $62.00 |
| Revenue CAGR ±3pp | $118 | $168 | $50.00 |
| Terminal × ±15% | $119 | $165 | $46.00 |
| FCF conversion ±10% | $123 | $161 | $38.00 |
| WACC ±1pp | $134 | $150 | $16.00 |
Consensus & Market Expectations
| Reference | Value |
|---|---|
| Street target (mean) | $260 (+24% vs spot · street) |
| House target | $214 (-18.0% vs street) |
| Sell-side coverage | 7 analysts (SB 2 / B 1 / H 4 / S 0 / SS 0; net score 0.36) |
| Consensus FY EPS | $9.97 (reference only — house values on EV/EBITDA) |
| Consensus FY revenue | $20.6B; house below (-8.2%) |
_Consensus figures: Alpha Vantage sell-side aggregates. Where the house view sits materially above or below the street, the divergence is itself a datum — see the thesis.
Balance Sheet & Liquidity
| Metric | Value |
|---|---|
| Net debt | $-0.2B — net cash |
| Net debt / EBITDA | -0.05x |
| Interest coverage (EBIT / interest) | 4.0x |
| Current ratio | 1.28x |
| Lease obligations | $0.3B |
| Cash & ST investments | $0.2B |
Balance-sheet data as of 2025-12-31 (Alpha Vantage).
Capital Allocation
| Metric | Value |
|---|---|
| Free cash flow | $3.2B |
| Buybacks / dividends | $0.0B / $0.0B |
| Total shareholder yield | 0.0% |
| Payout as % of FCF | 0.0% |
| Reinvestment (capex / OCF) | 13.6% |
| SBC as % of FCF | 2.6% |
Free-Cash-Flow Quality
| Metric | Value |
|---|---|
| FCF margin | 18.1% |
| FCF conversion (FCF / net income) | 179.8% |
| FCF yield | 4.9% |
| Capex intensity (capex / revenue) | 2.8% |
| FCF − SBC (diagnostic) | $3.1B |
Accounting quality: SBC 1% of revenue; cash conversion (OCF/NI) 208% — cash-backed.
Catalyst Calendar
- 2026-08-05 (~9d) — Quarterly earnings — est. EPS $2.07 (AV EARNINGS_CALENDAR)
Competitive Moat
Wide moat. The moat is the installed base and the certification barrier around it, not the technology. Aerospace components are certified to a platform; once HONA content is on a wing, the aftermarket revenue for that airframe's 25-30 year life is effectively annuitised — a competitor has to win the next platform and then wait a decade for the base to turn. That supports a premium terminal multiple relative to industrial peers, but it is an aftermarket-weighted premium: it is justified by the ~40% of revenue that is recurring service and spares, and it is NOT extended to the OE or defence-programme revenue, which is competitively bid and margin-capped. A terminal multiple in the low-to-mid 20s is defensible on that mix; anything materially above it prices a re-rate rather than the franchise.
Moat sources:
- Honeywell Aerospace spin-off disclosure 2026-06-29
- FY25 end-market mix
What the Market Is Pricing In
At the current price, the market pays 21.1× consensus forward EPS, vs the house DCF terminal 21.0×, and a peer median 13.74×. The house DCF sits 33% below spot, so the market is pricing in more than the house case — roughly 2.8pp of revenue CAGR.
Variant perception: the house view is below-consensus, and the thesis is primarily multiple-driven.
| Metric | Consensus | House | Importance |
|---|---|---|---|
| Revenue | 20.6 | 18.9 | High |
| EPS | 10.0 | 8.5 | Medium |
| Target price | 260.5 | 213.5 | Medium |
Peer Quality & Weighting
| Peer | Fwd P/E | Growth | Op margin | Quality | Weight cap |
|---|---|---|---|---|---|
| HON | 13.74× | 10% | 21% | segment | 50% |
Quality-weighted forward P/E: 13.7× (simple median 13.74×). Direct peers count 100%, segment 50%, broad 25%.
Historical-range cross-check: 52-week range $192–$298, centre $239 (+13% vs spot); spot sits at the 18th percentile of the range. Low-weight mean-reversion cross-check, not a fundamental anchor.
Risk / Reward & Margin of Safety
| Metric | Value |
|---|---|
| Upside to triangulated FV | $179 (-15% vs spot · triangulated FV) |
| Downside to bear case (Structural — Defense-Budget Cuts / Aero-Production Halt) | $93.94 (-55% vs spot · bear scenario) |
| Reward/risk ratio | 0.3× |
| Margin of safety (FV vs spot) | -18% |
| P(price > spot) — Monte Carlo | 49% |
Reward/risk compares triangulated upside against the probability-weighted bear target, not the extreme tail. Bull case (Bull — Re-Rate): $378.
Assumption Register
| Assumption | Value | Used in | Source |
|---|---|---|---|
| WACC | 8.5% | DCF discount rate | estimate (CAPM) |
| Terminal multiple | 21× | DCF exit value | estimate (peer-anchored) |
| Terminal growth | 2.5% | DCF Gordon terminal | estimate |
| SBC dilution | 0.0%/yr | PWEV, MC, DCF (charged once) | estimate (from SBC/rev) |
| EPS basis | consensus forward EPS (broker-adjusted, non-GAAP) | all forward P/E & scenario multiples | definition |
Sensitivity-ranked drivers (widest fair-value swing first): Op margin ±3pp (62.0); Revenue CAGR ±3pp (50.0); Terminal × ±15% (46.0); FCF conversion ±10% (38.0); WACC ±1pp (16.0).
Inputs, Sources & Confidence
Every load-bearing input, labelled by type and confidence. (reported fact · company guidance · consensus estimate · market data · house estimate · inference.)
| Input | Value | Type | Source | Confidence | Used in |
|---|---|---|---|---|---|
| Revenue TTM | $17.7B | reported fact | 10-K/10-Q via AV | High | Forecast base, EV/Rev |
| FY+1 guided revenue | $18.9B | company guidance | Company guidance | Medium | Forecast, SoP |
| Consensus FY EPS | $9.9693 | consensus estimate | Sell-side consensus via AV | Medium | Variant perception |
| Diluted shares | 0.309B | reported fact | 10-K via AV | High | Market cap, per-share |
| Net debt / cash | $-0.213B | reported fact | Balance sheet via AV | High | EV, DCF equity bridge |
| WACC | 8.5% | house estimate | CAPM (beta/rf) | Medium | DCF discount rate |
| Terminal multiple | 21× | house estimate | Peer/historical range | Medium | DCF exit value |
| Terminal growth | 2.5% | house estimate | Long-run GDP+ | Medium | DCF Gordon terminal |
Source Log
| Source | Type | Date | Used for | Reference |
|---|---|---|---|---|
| Alpha Vantage — GLOBAL_QUOTE / OVERVIEW | market data | 2026-07-27 | Price, market cap, EV, 52-week range, forward P/E | Alpha Vantage 2026-07-27 |
| Company income statement (10-K / 10-Q) via Alpha Vantage | reported fact | 2026-07-27 | Revenue, gross/operating margin, EBIT, interest expense | INCOME_STATEMENT / latest annual |
| Company balance sheet (10-K / 10-Q) via Alpha Vantage | reported fact | 2026-07-27 | Cash, debt, net debt, leases, equity, coverage | BALANCE_SHEET / latest annual |
| Company cash-flow statement (10-K / 10-Q) via Alpha Vantage | reported fact | 2026-07-27 | Operating cash flow, capex, FCF, buybacks, dividends, SBC | CASH_FLOW / latest annual |
| Company earnings releases via Alpha Vantage | reported fact | 2026-07-27 | Reported EPS, surprise history | EARNINGS / quarterly |
| Sell-side consensus via Alpha Vantage | consensus estimate | 2026-07-27 | Forward revenue/EPS consensus, analyst count | EARNINGS_ESTIMATES |
| Earnings calendar via Alpha Vantage | market data | 2026-07-27 | Next earnings date, catalyst timing | EARNINGS_CALENDAR |
| Company guidance | company guidance | 2026-07-27 | FY guided revenue / non-GAAP EPS basis | company guidance / earnings call |
| MCH segment model (from filings & disclosures) | house estimate | 2026-07-27 | Segment revenue, margins, multiples, AI decomposition | company_context (authored, tagged) |
| MCH qualitative analysis | inference | 2026-07-27 | Moat, regulatory risk, scenario macro, catalysts | company_context enrichment (authored) |
| MCH investment thesis & falsification triggers | house estimate | 2026-07-27 | Thesis, anti-thesis, thesis-break signals | authored §5.3 |
Citation coverage: 11/14 mandated claims sourced. Filing URLs are not available via the market-data provider; company statements are cited as 10-K/10-Q via Alpha Vantage.
Load-Bearing Assumptions
DCF: WACC 8%, terminal multiple 21×, FY+5 revenue $23B. Triangulation leans 47% on DCF, 33% on PWEV.
Reasons the Thesis Could Fail (Falsifiable)
Pre-registered signals that would break the thesis — each polices a specific scenario boundary and is checked at every earnings update:
- Commercial aftermarket revenue growth (YoY) < 0 (2 consecutive quarters → Structural — end-market disruption). The aftermarket is ~40% of revenue and the profit engine; the entire thesis is that it is a flight-hours annuity decoupled from the build cycle. Two consecutive quarters of outright decline falsifies that premise directly, and does so before it shows up in the multiple.
- Net debt / EBITDA (turns) > 4.5 (2 consecutive prints → Structural — leverage). HONA starts levered by construction, not choice. Leverage rising rather than amortising means cash is being consumed by the separation or by softening end markets, and it converts a franchise story into a balance-sheet story — the point at which the multiple, not the earnings, does the damage.
- Backlog ($B) < 16.0 (2 consecutive quarters → Structural — visibility erosion). Backlog entering 2026 was ~$18.4B, slightly over one year of revenue. Falling below ~$16B — under a year of coverage — removes the visibility that justifies paying a premium multiple for a levered supplier, and would signal either defence appropriations slipping or OE share loss.
- Operating margin (%) < 17.0 (2 consecutive quarters → Structural — dis-synergies). 20.2% is the inherited margin. Sustained erosion below ~17% would say the standalone cost base and lost parent-absorbed dis-synergies are structural rather than transitional — the specific spin-co risk this initiation underwrites.
Fact / Inference / Speculation
- FACT: Spot $211; 52-week range $192–$298; engine rating HOLD; house target $214 (+1%). (source: Alpha Vantage 2026-07-27, 28 July 2026)
- INFERENCE: Triangulated FV $179 (-15% vs spot · triangulated FV); the rating tracks the Monte-Carlo + scenario-PWEV core; the cash-flow anchor sits below the multiple-discipline core.
- SPECULATION: At current prices the embedded bet is that the market keeps paying the current multiple through the capex cycle — a regime call the engine cannot verify from fundamentals alone.
Recommendation: HOLD
Balanced: triangulated fair value $179 (-15% vs spot); the outcome hinges on P/E Multiple. The debate is P/E Multiple — fundamentally a multiple/regime call.
Options Overlay
A defined-risk way to express the HOLD equity view. Chain as of 2026-07-27 (last close) — indicative, not executable quotes.
Market signals — ATM IV 55.1% (elevated regime) · expected move ±11.6% (2026-08-21) · put/call OI 0.58 · ATM Δ 0.546 / Θ -0.247 / ν 0.219 · next earnings 2026-08-05. Direction: NEUTRAL (implied return -15.0% to triangulated fair value $179.14).
Covered Call (if held) (Income / neutral) — Short 230 C · 2026-08-21 · premium $4.65 · yield 2.21% · live chain
Converts a near-fair holding into income by agreeing to sell at a higher strike — worth weighing when upside looks limited near fair value and being called away is acceptable. Elevated implied volatility currently enriches the premium collected. Illustrative — no outcome is implied or guaranteed.
Put Spread (income) (Income / would-own) — Short 195 P / Long 180 P · 2026-09-18 · net $4.2 · net entry $190.8 · yield 2.2% · RoR 39% · max loss $10.8 · live chain
Gets paid to wait for a lower entry, with the tail capped: the sold put collects premium while the cheaper long wing below it caps the maximum loss at the spread width — a defined-risk alternative to a naked cash-secured put. Elevated implied volatility currently enriches the premium collected. Illustrative — no outcome is implied or guaranteed.
Protective Collar (if held) (Hedge) — Long 190 P / Short 230 C · 2026-12-18 · net $4.0 · floor -10% · cap +9% · live chain
For a holder who wants to stay invested but cap risk: the sold call funds most of the protective put, fencing the position into a band — a way to ride out a de-rating without selling. Elevated implied volatility currently enriches the premium collected. Illustrative — no outcome is implied or guaranteed.
Indicative options structures — a defined-risk expression of the equity view, model-and-market illustrated from the last-close chain. NOT personalised advice or an executable quote; premiums, IV and greeks move intraday. Options carry the risk of total loss of premium. Not a registered financial adviser.
Data Sources
- Prices, fundamentals, options chain, earnings — Alpha Vantage.
- Company filings (10-K / 10-Q) — SEC filings via EDGAR.
Disclosures & Limitations
This report is for informational and research purposes only. It is not personalised investment advice and does not consider any investor's objectives, financial situation, risk tolerance, tax position, or liquidity needs.
- This report is produced by the MCH Advisory quantitative research engine — valuation, scenarios, Monte Carlo and the decision layer are generated systematically from the disclosed inputs and the archetype/industry driver sets, and reviewed rather than written name-by-name. Every figure reconciles to the appendix and every score exposes its inputs.
- No suitability assessment has been performed for any individual.
- Market data may be delayed or inaccurate; figures are as of the analysis date.
- Model outputs (fair values, targets, scenario probabilities) are estimates and may be wrong.
- Forecasts are uncertain; past performance is not indicative of future returns.
- The author or publisher may hold positions in securities mentioned.
- Users should verify information against primary sources (company filings) before acting.
- Investing involves risk of loss; there is no guarantee any target price is achieved.
- Ratings follow a defined research methodology (12-month expected-return thresholds), not individual circumstances.