Rating: HOLD
| Metric | Value |
|---|---|
| Current Price | $141 |
| Triangulated Fair Value | $144 |
| 12-mo Scenario PWEV | $153 |
| Implied Return | +2% |
| Forward P/E | 35.3x |
| Market Cap | $23B |
| 52-Week Range | $115 – $337 |
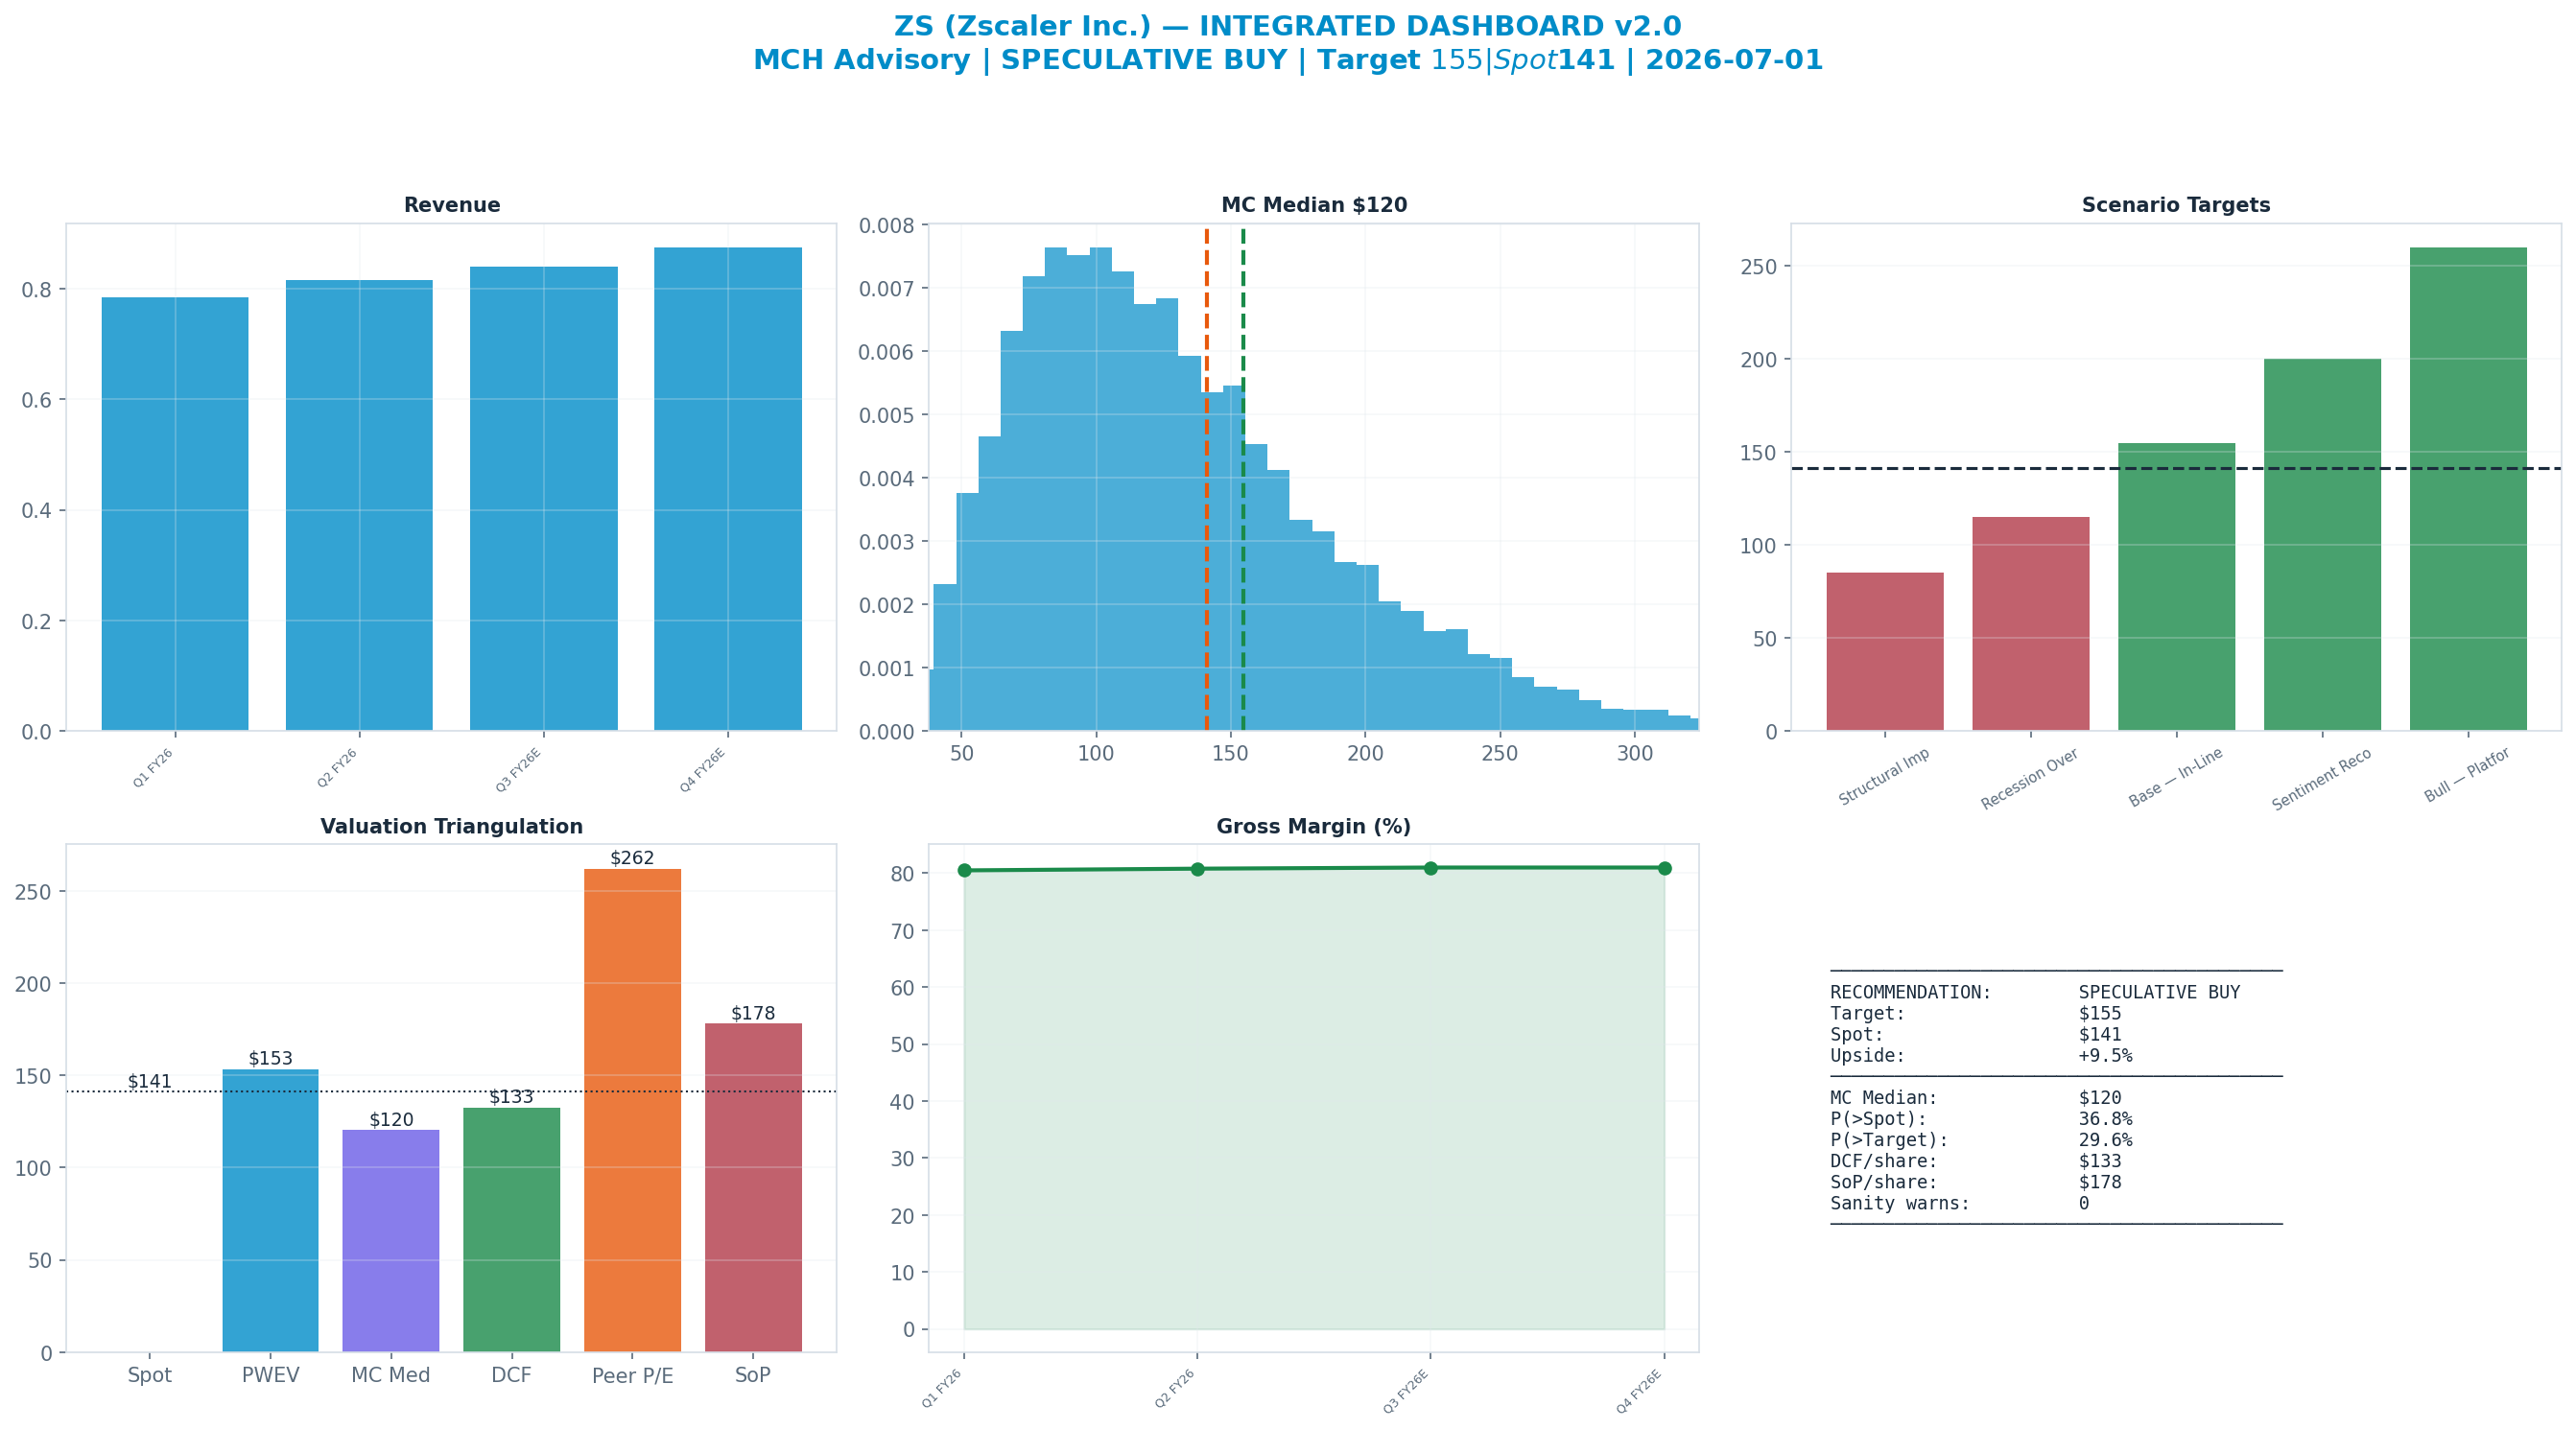
Methodology: Valuation triangulated across five independent anchors — Monte Carlo (Student-t + regime switching), an independent DCF, peer re-rating, a sum-of-parts, and a scenario-weighted PWEV. Figures reconciled to Alpha Vantage 2026-04-20. Each chart below sits with the part of the thesis it evidences.
Investment Thesis
The bull case — 'Bull — Platform Winner' (10% weight) — targets $260, +84% vs spot. It needs the multiple to hold or expand.
The dashboard below is the whole argument on one page: spot ($141) against each valuation anchor, the scenario tree, technicals and the options-implied move.
Anti-Thesis (The Real Bear Case)
The structural case — 'Structural Impairment' (20%) — targets $85, -40% vs spot. This sits below the 52-week low — a genuine structural impairment, not a mild pullback.
Key Debate
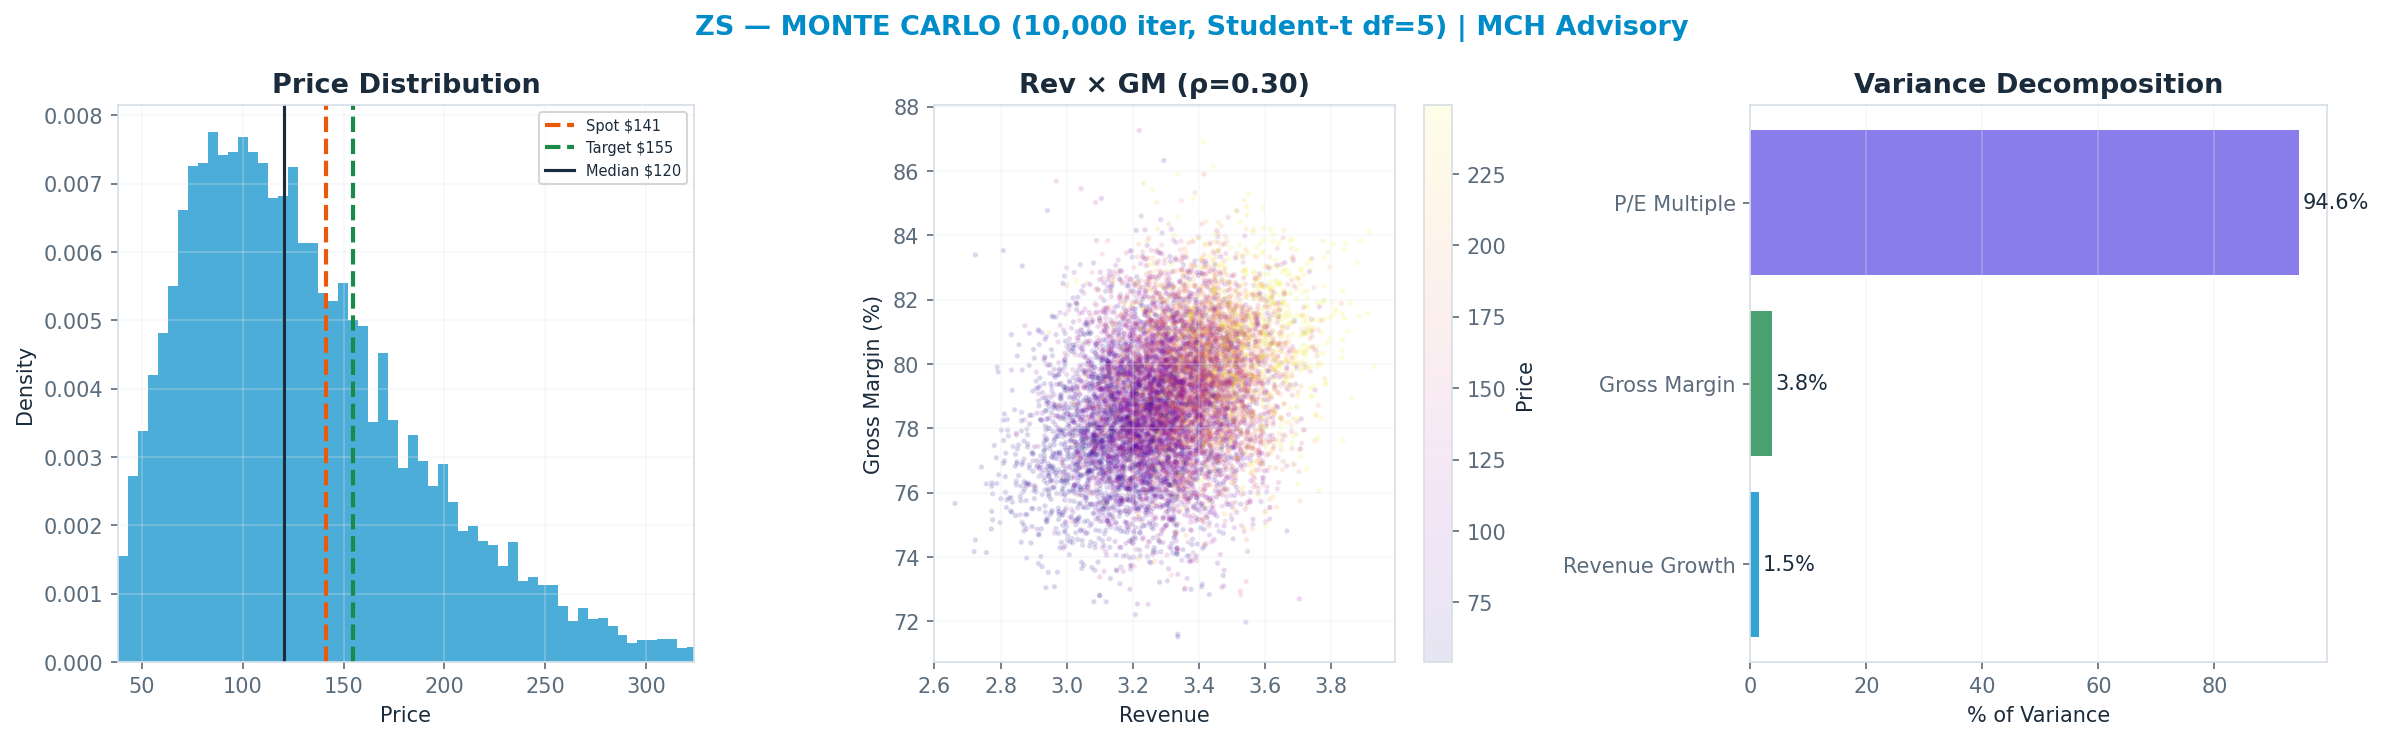
P/E Multiple explains 95% of Monte Carlo outcome variance — i.e. value is set by the multiple the market will pay, a rate/sentiment regime bet as much as an earnings bet.
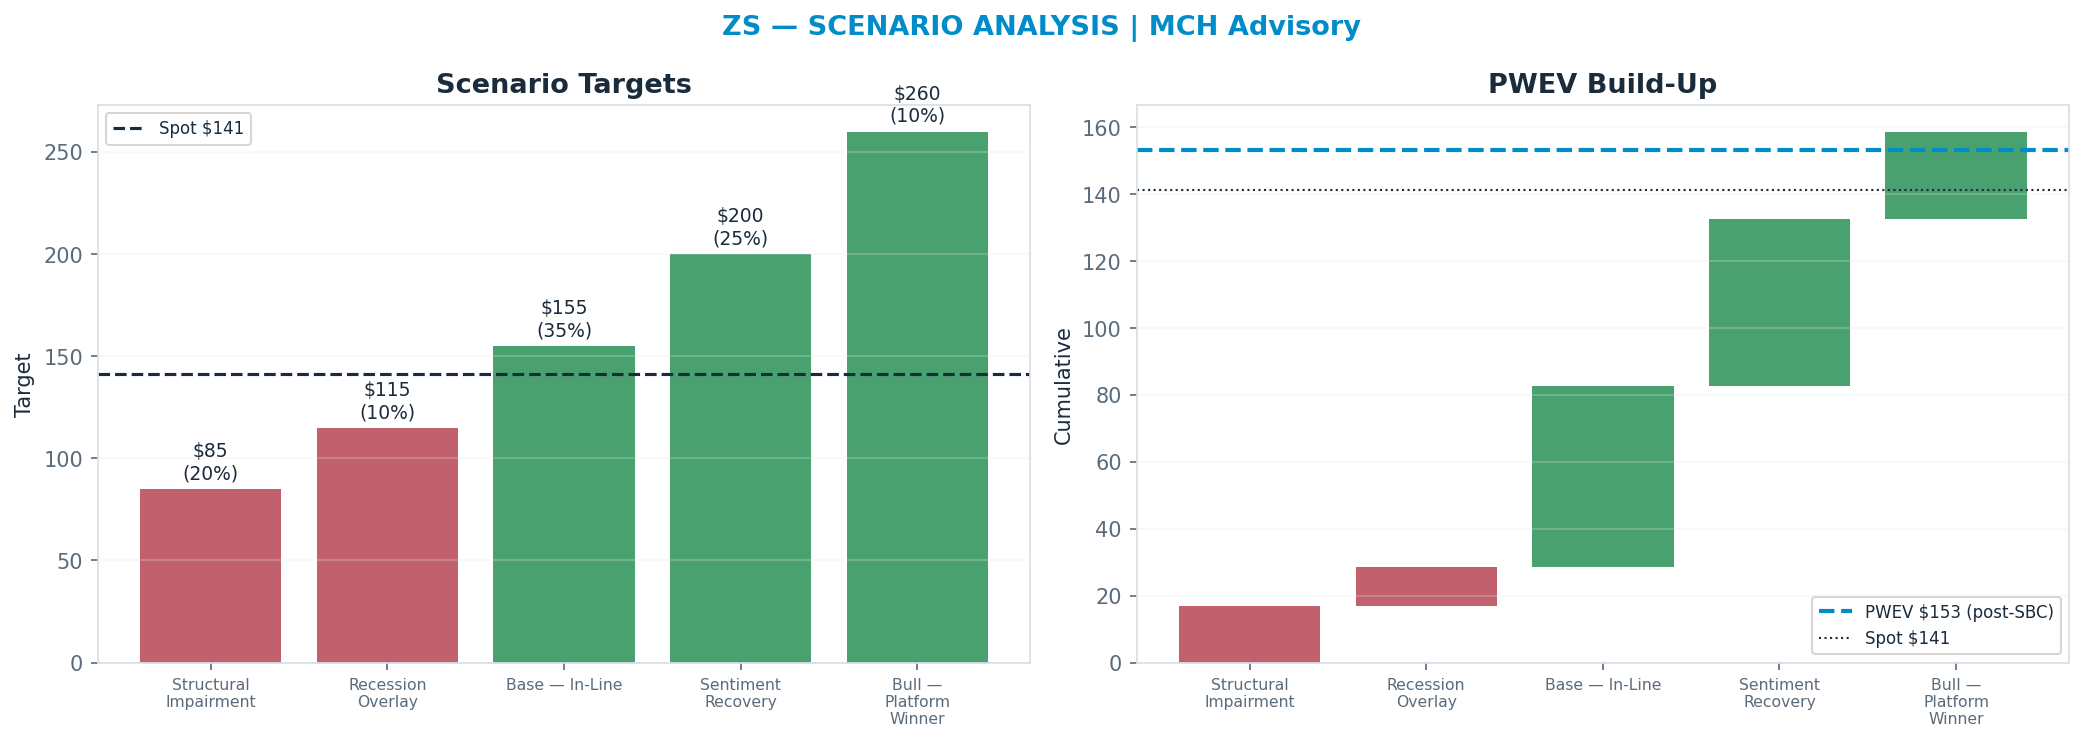
Scenario Analysis
The tree runs from a structural 'Structural Impairment' downside ($85) to a 'Bull — Platform Winner' bull case ($260); the probability-weighted blend (PWEV $153) is +9% versus spot.
| Scenario | Probability | Target | Return |
|---|---|---|---|
| Structural Impairment | 20% | $85 | -40% |
| Recession Overlay | 10% | $115 | -19% |
| Base — In-Line | 35% | $155 | +10% |
| Sentiment Recovery | 25% | $200 | +42% |
| Bull — Platform Winner | 10% | $260 | +84% |
| Probability-Weighted (PWEV, after SBC dilution) | — | $153 | +9% |
SBC charge: scenario targets are gross per-share prices; the PWEV is reduced by one year of stock-based-compensation dilution (3.5% of shares, on SBC ≈ 25% of revenue), trimming the gross PWEV of $159 to $153 (-3.4%). SBC is charged once, as dilution — never also deducted from FCF.
Valuation Triangulation
Five anchors — but read them with their basis in mind. The Monte Carlo, the DCF terminal, and the peer re-rate all key off a market multiple, so they are not fully independent; only the discounted cash flows themselves are genuinely multiple-free. The discipline is to read the spread and weight the cash-based view, not to treat five numbers as five independent votes.
| Method | Basis | Fair Value | vs Spot |
|---|---|---|---|
| Monte Carlo median (Student-t + regime) | multiple | $120 | -15% |
| Sum-of-Parts | multiple | $178 | +26% |
| Peer P/E re-rate | multiple | $262 | +86% |
| Peer EV/Revenue re-rate | multiple | $336 | +138% |
| Scenario PWEV | multiple | $153 | +9% |
| DCF (5-year + terminal) | cash flow + terminal × | $133 | -6% |
| Triangulated (weighted) | — | $144 | +2% |
peer P/E re-rate excluded from the weighted blend — diverges >55% from the Monte-Carlo / scenario core. For a high-leverage equity the per-share DCF (enterprise value less large net debt) is hypersensitive to the terminal multiple; a peer re-rate across heterogeneous margins is apples-to-oranges. Shown above for reference; the blend leans on the multiple-discipline and scenario anchors.
Monte Carlo — the distribution, not a point
10,000 paths, Student-t shocks (fat tails) with a regime-switching overlay. The median lands at $120 and 37% of paths finish above spot. The variance decomposition shows the p/e multiple is the dominant swing factor (95% of variance). Value is a multiple bet: fundamentals move the answer far less than the rating does.
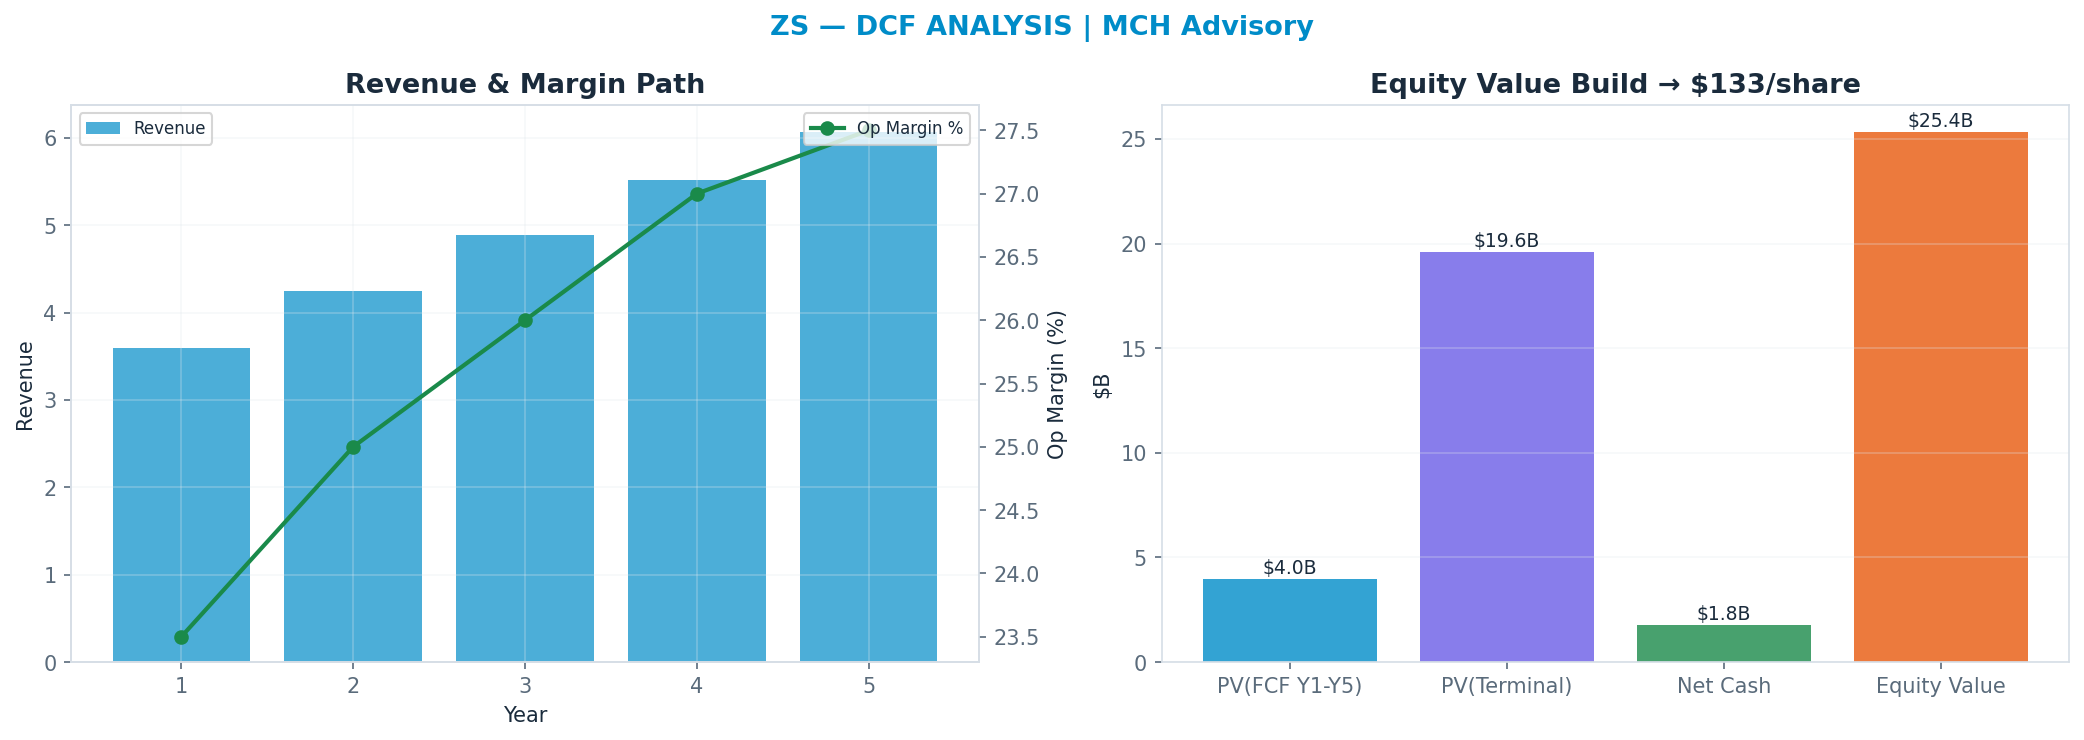
DCF — the cash-flow anchor
Independent of the market multiple: a 5-year path, WACC 9.5%, 22x terminal FCF multiple → $133. This anchor is deliberately the heaviest (35%): it is the valuation least hostage to the current multiple regime.
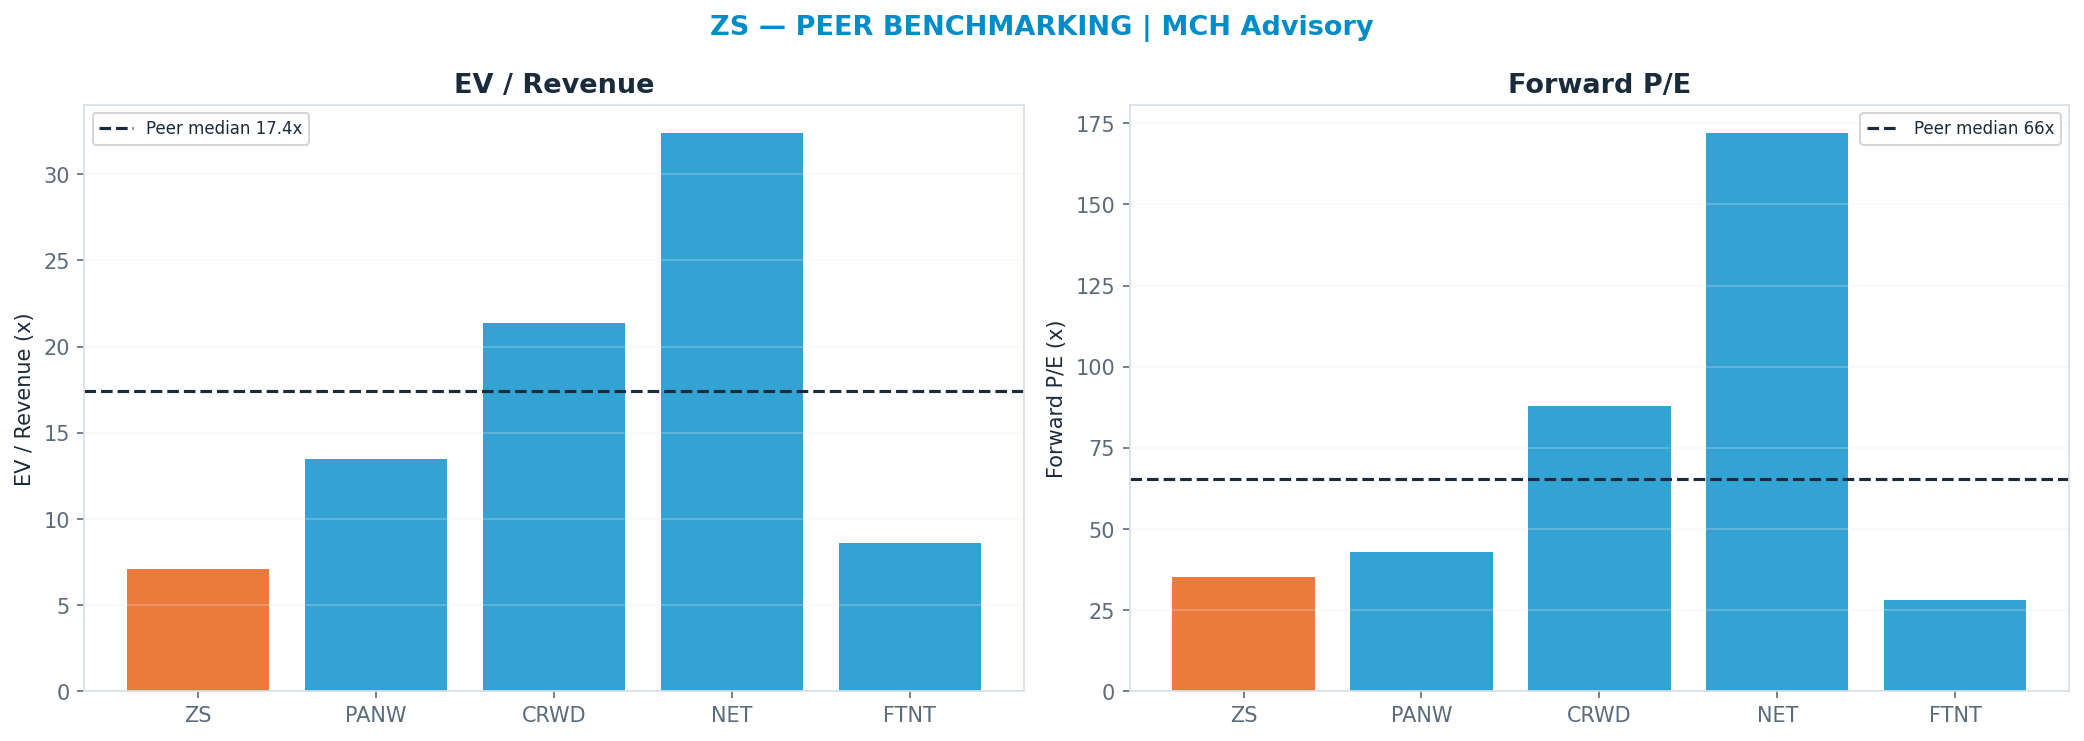
Peer benchmarking — relative value
Against the peer cohort, re-rating to the peer-median forward multiple (P/E 65.5x) implies $262. A premium is only justified by superior growth/margins; otherwise it is multiple risk. Weighted just 10% so the market's mood does not drive the fair value.
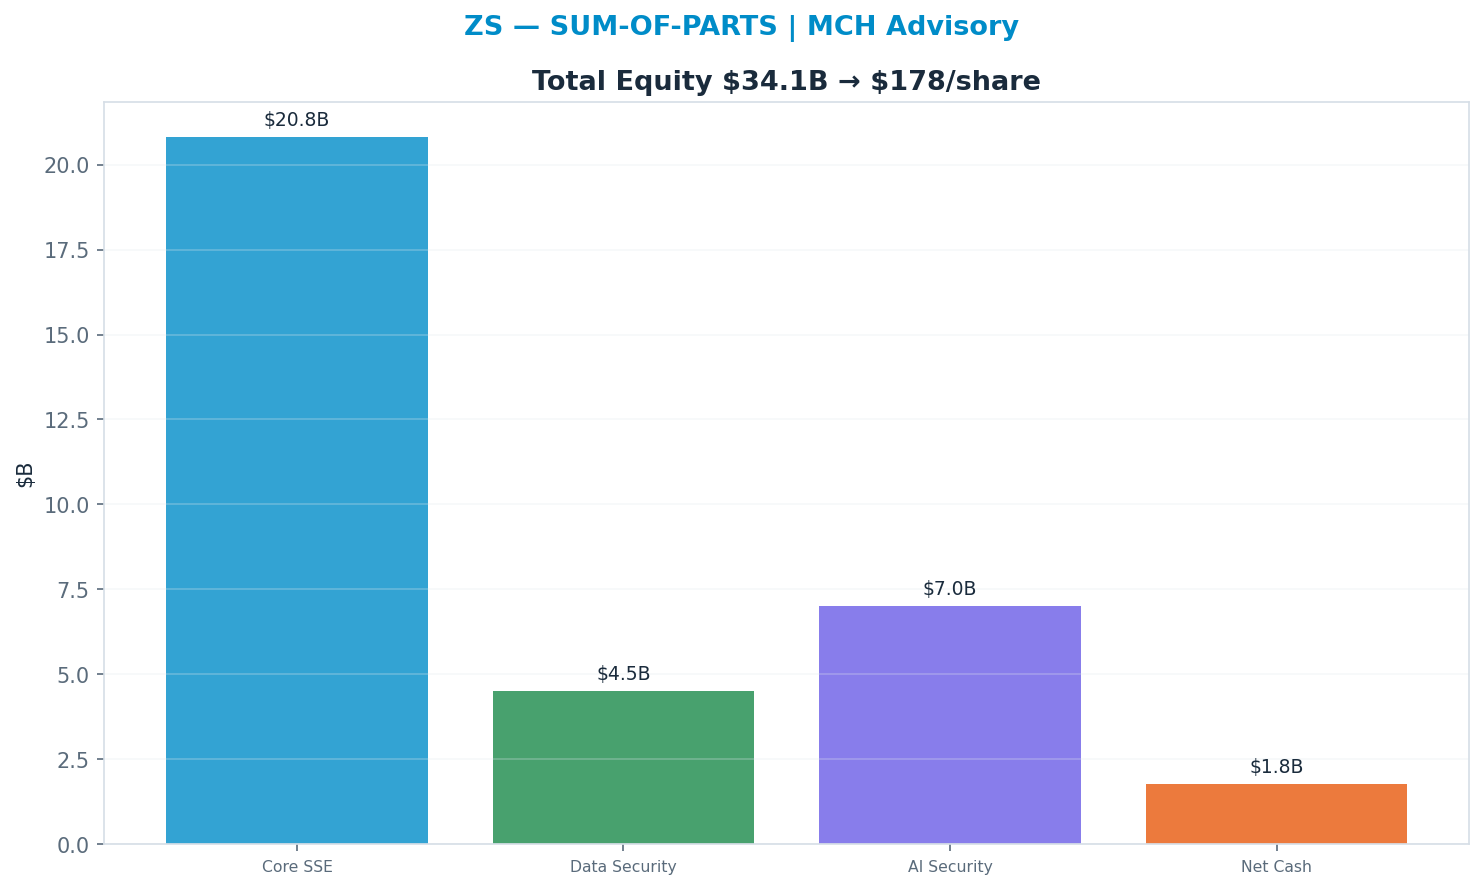
Sum-of-parts
Valuing each piece at the multiple it deserves (Core SSE 8x, Data Security 10x, AI Security 14x) → $178. 'Core SSE' dominates at 8.0× → $21B (64% of EV) — the segment whose multiple matters most.
Across all anchors the spread is wide (genuine disagreement — low valuation confidence).
Model Appendix
DCF — line items
| Year | Revenue | Op income | FCF | PV(FCF) |
|---|---|---|---|---|
| FY+1 | $4B | $1B | $1B | $1B |
| FY+2 | $4B | $1B | $1B | $1B |
| FY+3 | $5B | $1B | $1B | $1B |
| FY+4 | $6B | $1B | $1B | $1B |
| FY+5 | $6B | $2B | $1B | $1B |
| Terminal | — | — | $1B × 22x | $20B |
WACC 9.5% · Σ PV(FCF) $4B + PV(terminal) $20B = EV $24B; + net cash → equity $25B ÷ diluted shares 0.19B = $133/share (exit-multiple terminal).
- Gordon (perpetuity-growth) terminal at 2.5% → $98/share — a genuinely non-multiple, cash-based cross-check; the exit-multiple and Gordon values bracket the terminal-value risk.
Peer set
| Peer | EV/Rev | Fwd P/E | Growth | Op margin |
|---|---|---|---|---|
| PANW | 13.5x | 43x | 15% | 28% |
| CRWD | 21.4x | 88x | 23% | 22% |
| NET | 32.4x | 172x | 34% | 13% |
| FTNT | 8.6x | 28x | 15% | 33% |
| Median | 17.45x | 65.5x | — | — |
Peer-median fwd P/E → $262; EV/Rev → $336.
Weighted fair-value math
| Anchor | Value | Weight | Contribution |
|---|---|---|---|
| DCF | $133 | 39% | $52 |
| Scenario PWEV | $153 | 28% | $43 |
| Monte Carlo median | $120 | 17% | $20 |
| Sum-of-parts | $178 | 17% | $30 |
| Triangulated | — | 100% | $144 |
Sensitivity
DCF/share — WACC × terminal multiple
| WACC \ Term× | 15.4x | 18.7x | 22.0x | 25.3x | 28.6x |
|---|---|---|---|---|---|
| 8% | $110 | $127 | $144 | $161 | $177 |
| 8% | $106 | $122 | $138 | $154 | $170 |
| 10% | $102 | $117 | $133 | $148 | $163 |
| 10% | $98 | $113 | $127 | $142 | $157 |
| 12% | $94 | $109 | $123 | $137 | $151 |
DCF/share — revenue CAGR Δ × op-margin Δ
| CAGRΔ \ MgnΔ | -3.0pp | -1.5pp | +0.0pp | +1.5pp | +3.0pp |
|---|---|---|---|---|---|
| -3.0pp | $106 | $112 | $118 | $124 | $130 |
| -1.5pp | $112 | $119 | $125 | $132 | $138 |
| +0.0pp | $119 | $126 | $133 | $139 | $146 |
| +1.5pp | $126 | $133 | $140 | $148 | $155 |
| +3.0pp | $133 | $141 | $148 | $156 | $164 |
Tornado — DCF/share swing by driver (widest first)
| Driver | Low | High | Swing |
|---|---|---|---|
| Terminal × ±15% | $117 | $148 | $31 |
| Revenue CAGR ±3pp | $118 | $148 | $30 |
| Op margin ±3pp | $119 | $146 | $27 |
| FCF conversion ±10% | $120 | $145 | $25 |
| WACC ±1pp | $127 | $138 | $11 |
Load-Bearing Assumptions
DCF: WACC 10%, terminal multiple 22×, FY+5 revenue $6B. Triangulation leans 35% on DCF, 25% on PWEV.
Reasons the Thesis Could Fail (Falsifiable)
The valuation is multiple-dependent (95% of variance); a de-rating toward the DCF anchor ($133) implies -6%.
Fact / Inference / Speculation
- FACT: Spot $141; 52-week range $115–$337; engine rating HOLD; base-case target $155 (+10%).
- INFERENCE: Triangulated FV $144 (+2%). P/E Multiple explains 95% of Monte Carlo outcome variance — i.e. value is set by the multiple the market will pay, a rate/sentiment regime bet as much as an earnings bet.
- SPECULATION: At current prices the embedded bet is that the multiple holds or expands — P/E Multiple carries 95% of outcome variance.
Recommendation: HOLD
Balanced: triangulated fair value $156 (+10% vs spot); the outcome hinges on P/E Multiple. The debate is P/E Multiple (95% of variance) — fundamentally a multiple/regime call. SBC runs 661M TTM (disclosed in the appendix).