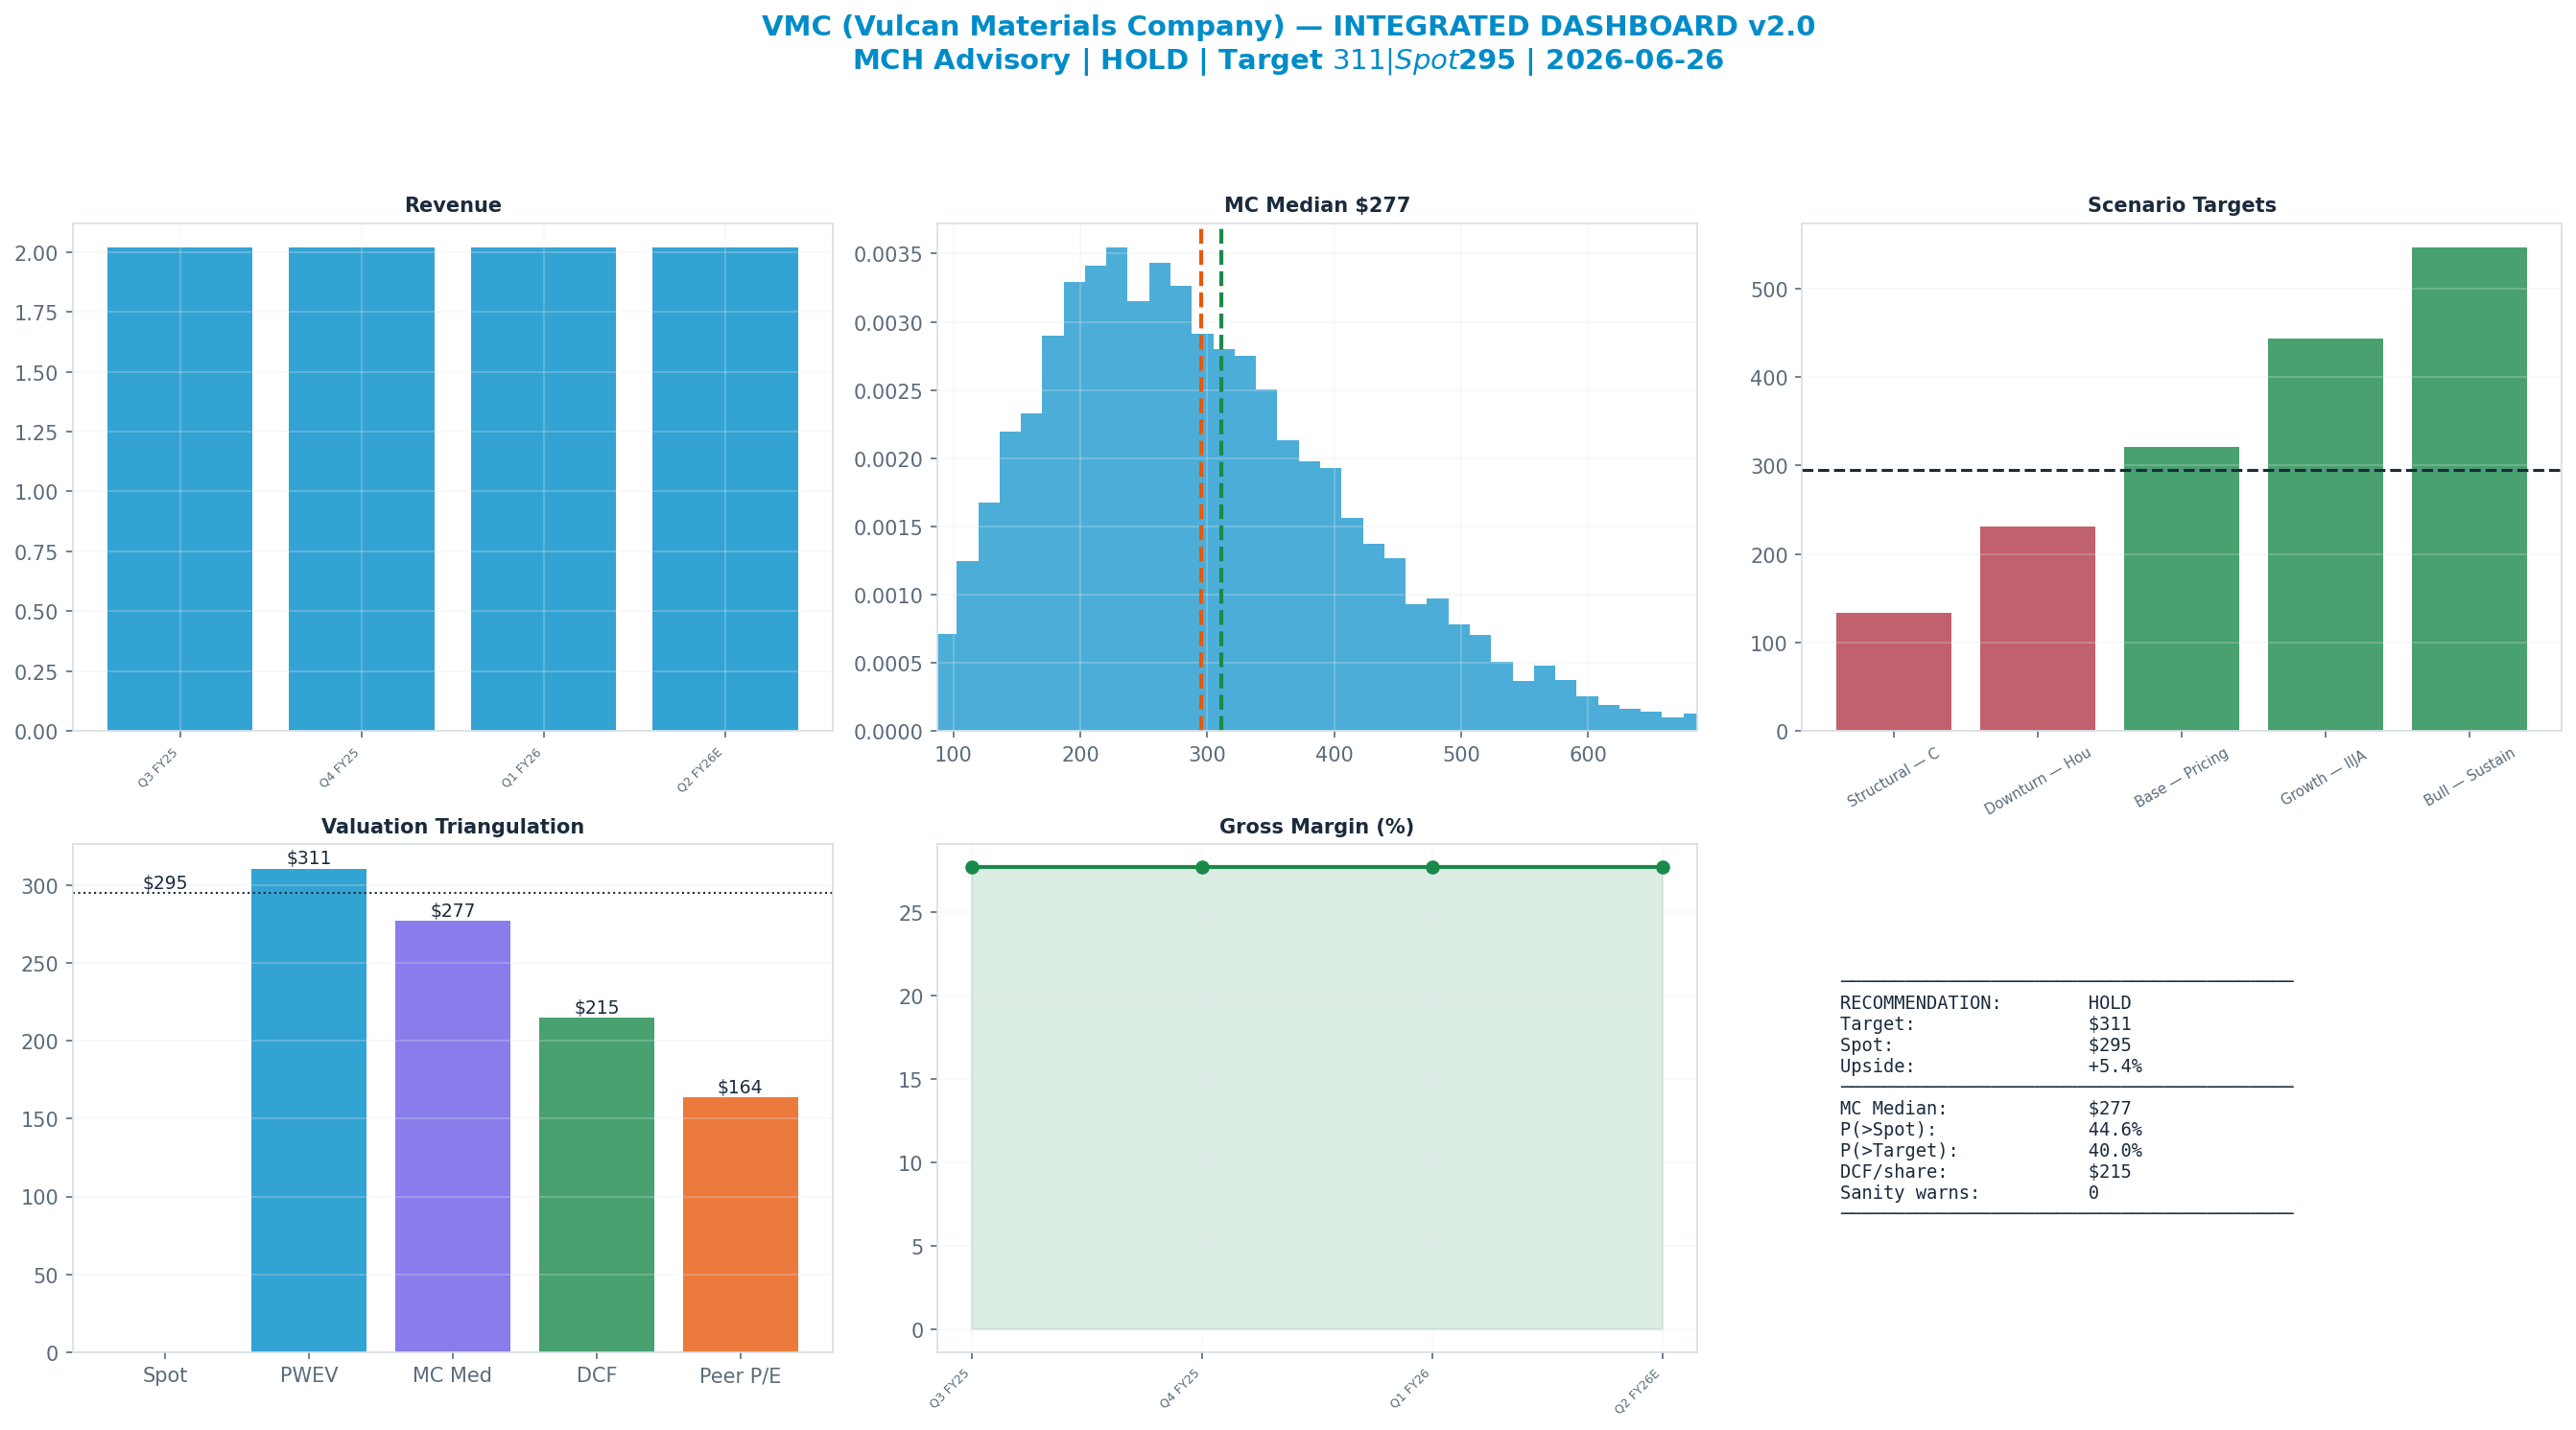
Rating: HOLD
| Metric | Value |
|---|---|
| Current Price | $295 |
| Triangulated Fair Value | $248 |
| 12-mo Scenario PWEV | $311 |
| Implied Return | -16% |
| Forward P/E | 31.3x |
| Market Cap | $38B |
| 52-Week Range | $252 – $330 |
Methodology: Valuation triangulated across five independent anchors — Monte Carlo (Student-t + regime switching), an independent DCF, peer re-rating, a sum-of-parts, and a scenario-weighted PWEV. Figures reconciled to Alpha Vantage 2026-06-26. Each chart below sits with the part of the thesis it evidences.
Investment Thesis
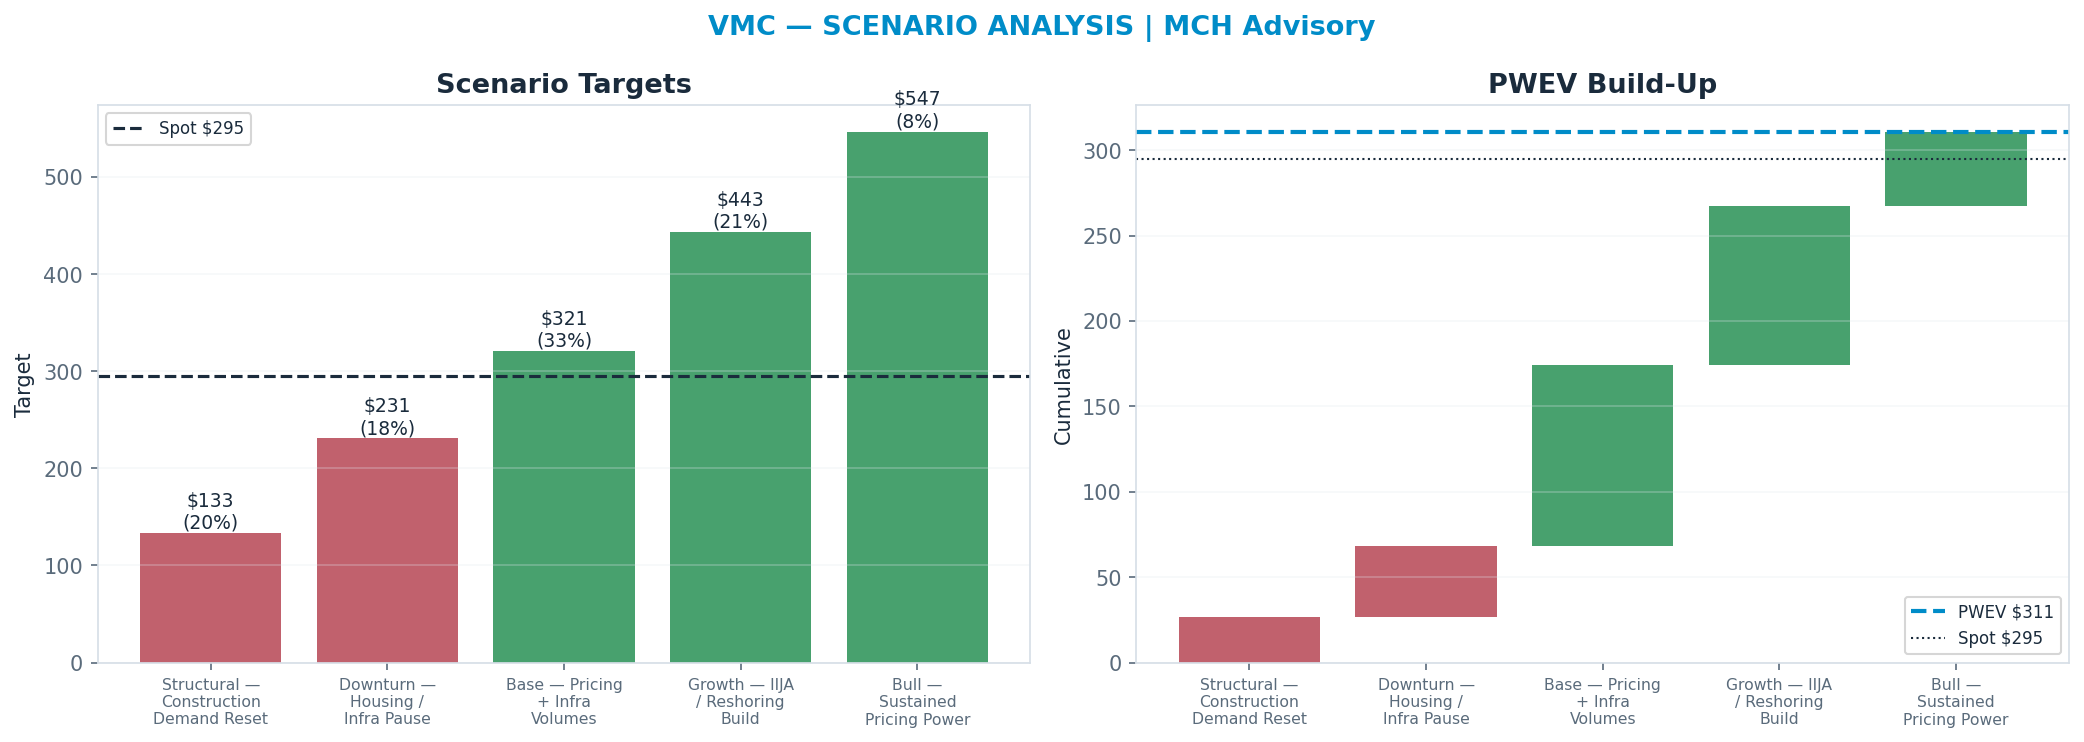
The bull case — 'Bull — Sustained Pricing Power' (8% weight) — targets $547, +85% vs spot. It needs the multiple to hold or expand.
The dashboard below is the whole argument on one page: spot ($295) against each valuation anchor, the scenario tree, technicals and the options-implied move.
Anti-Thesis (The Real Bear Case)
The structural case — 'Structural — Construction Demand Reset' (20%) — targets $133, -55% vs spot. This sits below the 52-week low — a genuine structural impairment, not a mild pullback.
Key Debate
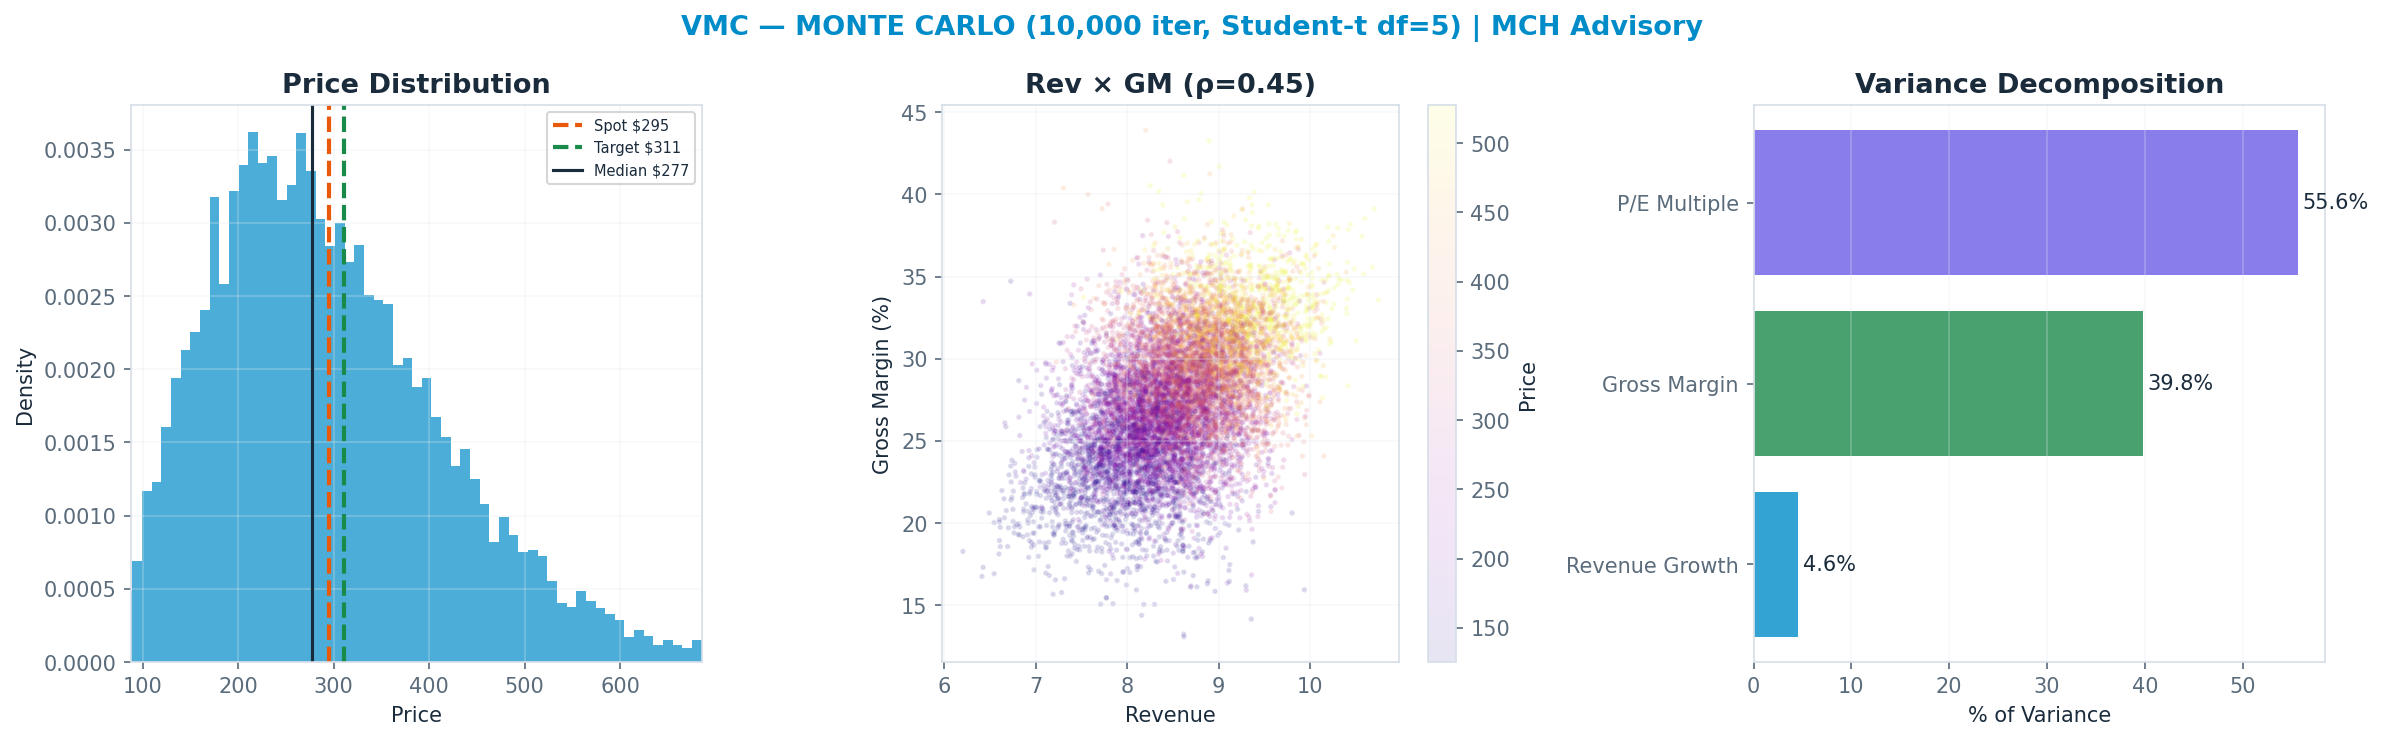
P/E Multiple explains 56% of Monte Carlo outcome variance — i.e. value is set by the multiple the market will pay, a rate/sentiment regime bet as much as an earnings bet.
Earnings-Call Disconfirmation & Sentiment
Derived signals from the MCH market-data store (Alpha Vantage transcripts + news). Quantitative tone only — a disconfirmation flag, not a substitute for reading the call.
Management vs analyst tone (2026Q1): management +0.45 vs analyst floor +0.00 → delta +0.45 (n=28 mgmt / 17 Q&A; 63th pctile across the S&P book, z +0.4).
Flag: TYPICAL — management-vs-analyst tone within the normal cross-sectional range.
| Quarter | Mgmt | Analyst | Delta |
|---|---|---|---|
| 2026Q1 | +0.45 | +0.00 | +0.45 |
| 2025Q4 | +0.48 | +0.11 | +0.37 |
| 2025Q3 | +0.64 | +0.23 | +0.41 |
| 2025Q2 | +0.55 | +0.11 | +0.43 |
News (last 365d, 1000 articles): avg ticker sentiment +0.17 (bullish 26% / bearish 7%)
Scenario Analysis
The tree runs from a structural 'Structural — Construction Demand Reset' downside ($133) to a 'Bull — Sustained Pricing Power' bull case ($547); the probability-weighted blend (PWEV $311) is +5% versus spot.
| Scenario | Probability | Target | Return |
|---|---|---|---|
| Structural — Construction Demand Reset | 20% | $133 | -55% |
| Downturn — Housing / Infra Pause | 18% | $231 | -22% |
| Base — Pricing + Infra Volumes | 33% | $321 | +9% |
| Growth — IIJA / Reshoring Build | 21% | $443 | +50% |
| Bull — Sustained Pricing Power | 8% | $547 | +85% |
| Probability-Weighted (PWEV) | — | $311 | +5% |
Scenario rationale — what each probability buys (the driver path behind every target):
- Structural — Construction Demand Reset (20%, $133). Structural impairment — construction recession: earnings AND the multiple compress together. Target sits below the 52-week low by construction. Drivers — implied_target: 133.36; probability: 0.2.
- Downturn — Housing / Infra Pause (18%, $231). Cyclical downturn — US construction & infrastructure activity + aggregates pricing weakens for 1–2 years before normalising. Drivers — implied_target: 230.86; probability: 0.18.
- Base — Pricing + Infra Volumes (33%, $321). Mid-cycle — normalised US construction & infrastructure activity + aggregates pricing; disciplined capital allocation; steady returns. Drivers — implied_target: 320.64; probability: 0.33.
- Growth — IIJA / Reshoring Build (21%, $443). Upside — federal infra + reshoring build lifts earnings above mid-cycle; the multiple expands modestly. Drivers — implied_target: 443.26; probability: 0.21.
- Bull — Sustained Pricing Power (8%, $547). Upside tail — sustained tight conditions or a structural re-rate on federal infra + reshoring build. Drivers — implied_target: 546.7; probability: 0.08.
Valuation Triangulation
Five anchors — but read them with their basis in mind. The Monte Carlo, the DCF terminal, and the peer re-rate all key off a market multiple, so they are not fully independent; only the discounted cash flows themselves are genuinely multiple-free. The discipline is to read the spread and weight the cash-based view, not to treat five numbers as five independent votes.
| Method | Basis | Fair Value | vs Spot |
|---|---|---|---|
| Monte Carlo median (Student-t + regime) | multiple | $277 | -6% |
| Peer P/E re-rate | multiple | $164 | -45% |
| Peer EV/Revenue re-rate | multiple | $102 | -66% |
| Scenario PWEV | multiple | $311 | +5% |
| DCF (5-year + terminal) | cash flow + terminal × | $215 | -27% |
| Triangulated (weighted) | — | $248 | -16% |
Rating vs blend — the key debate. The rating tracks the multiple-discipline fair value (Monte Carlo $277 + scenario PWEV $311, ≈ spot); the weighted blend $248 (-16%) sits below it because the cash-flow DCF ($215) is materially more conservative than the market multiple. Whether the current multiple is justified is the central question for this name — and the principal downside risk to the rating.
Monte Carlo — the distribution, not a point
10,000 paths, Student-t shocks (fat tails) with a regime-switching overlay. The median lands at $277 and 45% of paths finish above spot. The variance decomposition shows the p/e multiple is the dominant swing factor (56% of variance). Value is a multiple bet: fundamentals move the answer far less than the rating does.
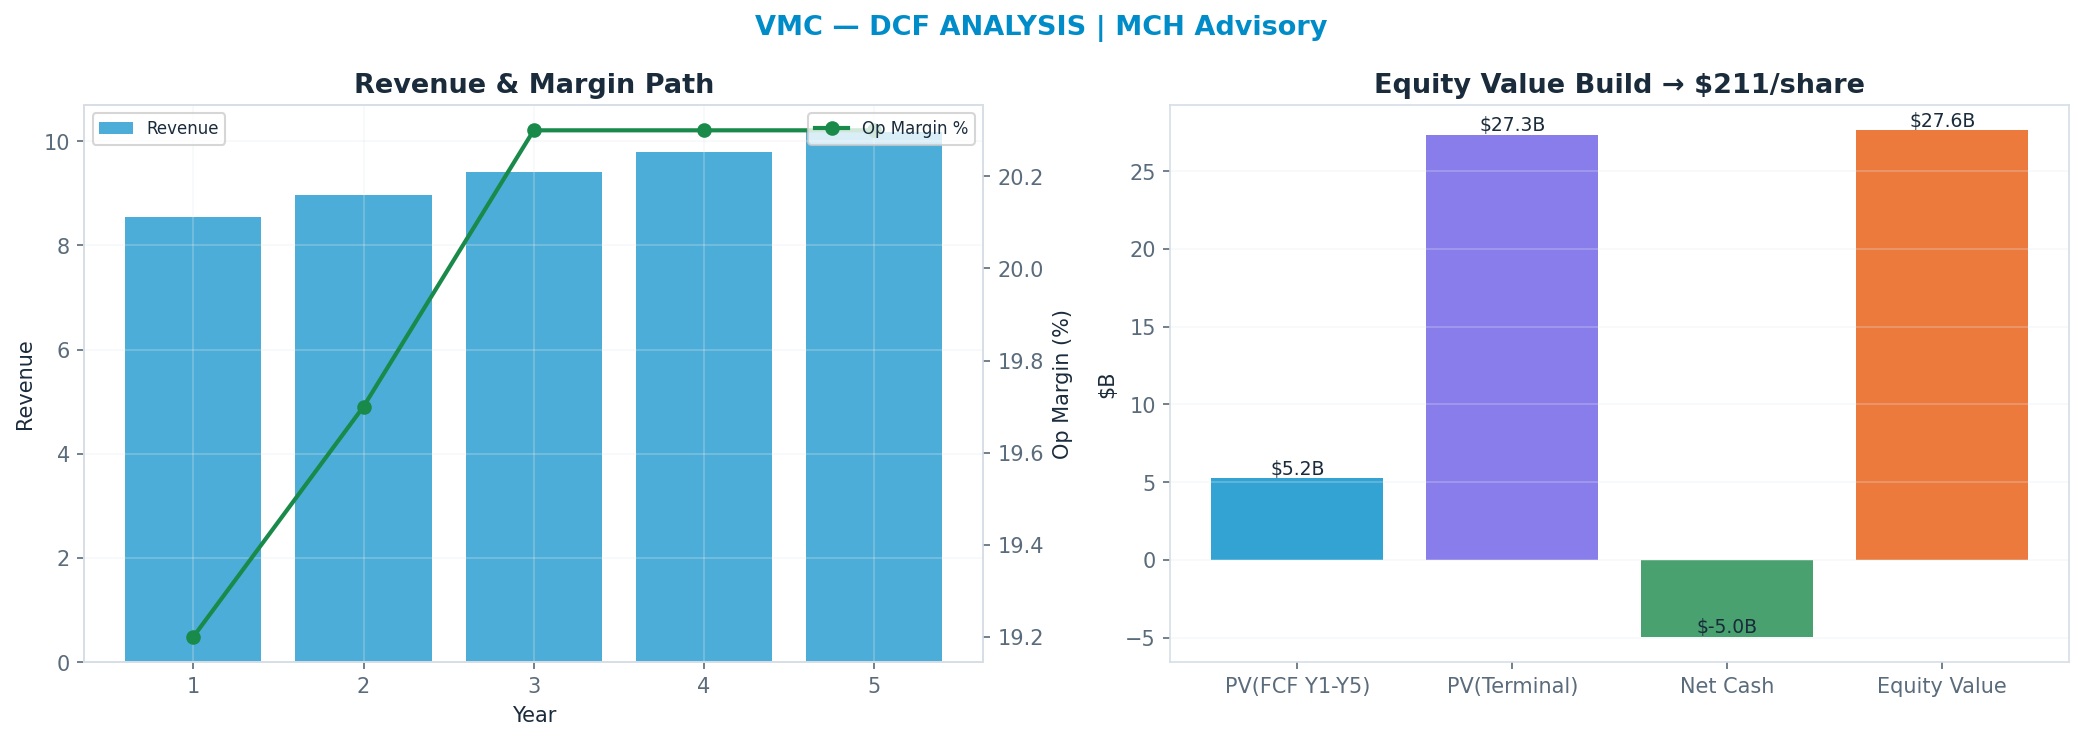
DCF — the cash-flow anchor
Independent of the market multiple: a 5-year path, WACC 8.5%, 28x terminal FCF multiple → $215. This anchor is deliberately the heaviest (41%): it is the valuation least hostage to the current multiple regime.
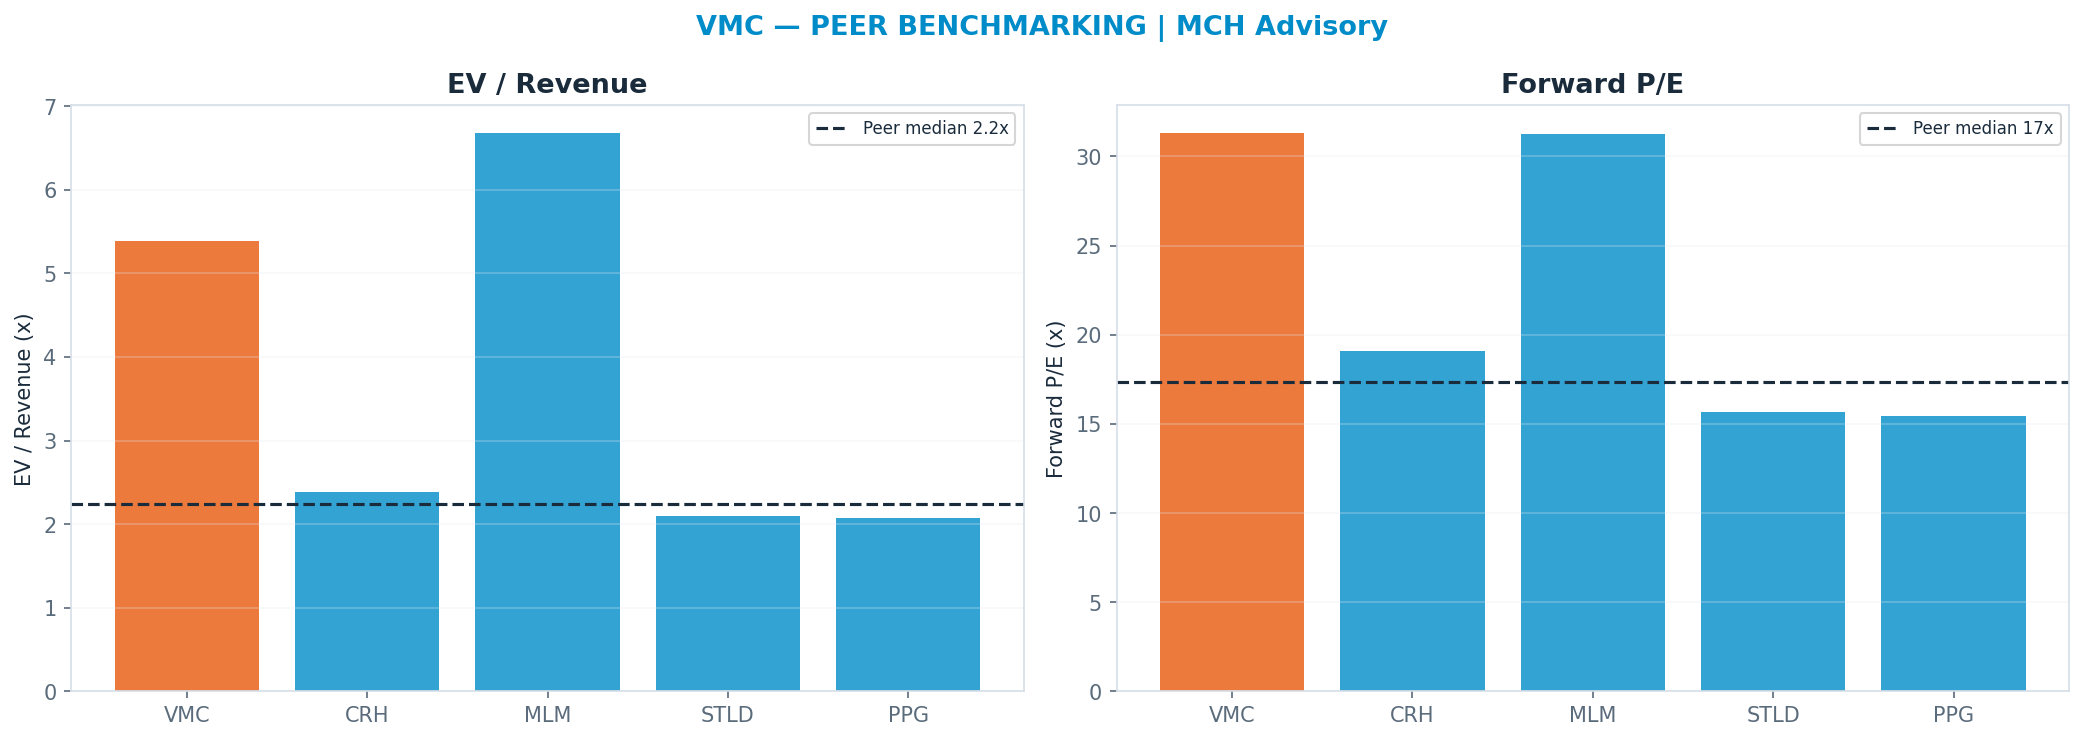
Peer benchmarking — relative value
Against the peer cohort, re-rating to the peer-median forward multiple (P/E 17.365x) implies $164. A premium is only justified by superior growth/margins; otherwise it is multiple risk. Weighted just 12% so the market's mood does not drive the fair value.
Across all anchors the spread is wide (genuine disagreement — low valuation confidence).
Revenue-Segment Breakdown
The company-specific drivers behind the valuation — each segment carries its own growth, margin, multiple and capex intensity. (Tags: FACT reported · ESTIMATE from disclosures · INFERENCE judgment.)
| Segment | Revenue | Mix | Growth | Op margin | Multiple | Capex % | Tag |
|---|---|---|---|---|---|---|---|
| Aggregates + Cement + Asphalt | $8.1B | 100% | 6% | 19% | 33x | 10% | ESTIMATE |
Named Exposures
Demand & pricing cycle (FACT/ESTIMATE)
| Dimension | Assessment |
|---|---|
| driver | US construction & infrastructure activity + aggregates pricing |
| net_debt_or_cash_b | -4.95 |
Capital intensity & shareholder returns (ESTIMATE)
| Dimension | Assessment |
|---|---|
| capex_pct_revenue | 0.1 |
| div_yield | 0.0065 |
Structural risk vs optionality (INFERENCE)
| Dimension | Assessment |
|---|---|
| downside | construction recession |
| upside | federal infra + reshoring build |
Industry Context — Materials — Construction
This name sits in the Materials — Construction as a aggregates. US construction & infrastructure activity + aggregates pricing Its scenarios are not guessed in isolation — they inherit a single, shared view of the cluster's driver cycle, so the names that depend on the same event are mutually consistent.
Value chain: CRH (aggregates) · VMC (aggregates) · MLM (aggregates)
| Shared state | Capex path | House view | This name implies |
|---|---|---|---|
| Construction Recession — Volume Reset | 38% | 38% | |
| Mid-Cycle — Steady Activity | 33% | 33% | |
| Infra / Reshoring Build-Out | 29% | 29% |
On the cluster's key downside — Construction Recession — Volume Reset () — this name implies 38% vs the cluster house view of 38% (in line with the house). The cluster's full cross-stock reconciliation governs that the names which ride the same capex cycle assign it comparable odds.
Structure: Shared State — The construction cycle is the shared macro driver. Driver — US construction & infrastructure activity + aggregates pricing Dispersion — Members differ by cyclicality (quality compounders vs deep cyclicals).
Model Appendix
DCF — line items
| Year | Revenue | Op income | − Capex | + D&A | FCF | PV(FCF) |
|---|---|---|---|---|---|---|
| FY+1 | $9B | $2B | $1B | $1B | $1B | $1B |
| FY+2 | $9B | $2B | $1B | $1B | $1B | $1B |
| FY+3 | $9B | $2B | $1B | $1B | $1B | $1B |
| FY+4 | $10B | $2B | $1B | $1B | $1B | $1B |
| FY+5 | $10B | $2B | $1B | $1B | $1B | $1B |
| Terminal | — | — | — | — | $1B × 28x | $28B |
FCF is bridged: NOPAT + D&A − Capex − ΔNWC (capex intensity 10% of revenue, weighted from the segments) — not a single conversion fudge.
WACC 8.5% · Σ PV(FCF) $5B + PV(terminal) $28B = EV $33B; + net cash → equity $28B ÷ diluted shares 0.13B = $215/share (exit-multiple terminal).
- Gordon (perpetuity-growth) terminal at 2.5% → $132/share — a genuinely non-multiple, cash-based cross-check; the exit-multiple and Gordon values bracket the terminal-value risk.
- Incremental ROIC on the forecast capex ≈ 7% vs WACC 8% → below WACC — the incremental build is value-dilutive.
Peer set
| Peer | EV/Rev | Fwd P/E | Growth | Op margin |
|---|---|---|---|---|
| CRH | 2.388x | 19.08x | 6% | -0% |
| MLM | 6.68x | 31.25x | 6% | 13% |
| STLD | 2.096x | 15.65x | 2% | 10% |
| PPG | 2.071x | 15.46x | 5% | 14% |
| Median | 2.242x | 17.365x | — | — |
Peer-median fwd P/E → $164; EV/Rev → $102.
Weighted fair-value math
| Anchor | Value | Weight | Contribution |
|---|---|---|---|
| DCF | $215 | 41% | $88 |
| Scenario PWEV | $311 | 29% | $91 |
| Monte Carlo median | $277 | 18% | $49 |
| Peer P/E | $164 | 12% | $19 |
| Triangulated | — | 100% | $248 |
Sensitivity
DCF/share — WACC × terminal multiple
| WACC \ Term× | 19.6x | 23.8x | 28.0x | 32.2x | 36.4x |
|---|---|---|---|---|---|
| 6% | $168 | $203 | $238 | $273 | $307 |
| 8% | $159 | $193 | $226 | $259 | $292 |
| 8% | $151 | $183 | $215 | $247 | $278 |
| 10% | $144 | $174 | $204 | $235 | $265 |
| 10% | $136 | $165 | $194 | $223 | $252 |
DCF/share — revenue CAGR Δ × op-margin Δ
| CAGRΔ \ MgnΔ | -3.0pp | -1.5pp | +0.0pp | +1.5pp | +3.0pp |
|---|---|---|---|---|---|
| -3.0pp | $157 | $174 | $192 | $209 | $226 |
| -1.5pp | $166 | $184 | $203 | $221 | $240 |
| +0.0pp | $175 | $195 | $215 | $235 | $254 |
| +1.5pp | $185 | $206 | $227 | $248 | $270 |
| +3.0pp | $195 | $218 | $240 | $263 | $286 |
Tornado — DCF/share swing by driver (widest first)
| Driver | Low | High | Swing |
|---|---|---|---|
| Op margin ±3pp | $175 | $254 | $79 |
| Terminal × ±15% | $183 | $247 | $63 |
| Revenue CAGR ±3pp | $192 | $240 | $49 |
| WACC ±1pp | $204 | $226 | $22 |
| FCF conversion ±10% | $215 | $215 | $0 |
Company lever — SoP/share vs Aggregates + Cement + Asphalt multiple (AI re-rating) (base 33x)
| Multiple | 23.1x | 28.1x | 33.0x | 37.9x | 42.9x |
|---|---|---|---|---|---|
| SoP/share | $1,401 | $1,713 | $2,018 | $2,323 | $2,635 |
Load-Bearing Assumptions
DCF: WACC 8%, terminal multiple 28×, FY+5 revenue $10B. Triangulation leans 41% on DCF, 29% on PWEV.
Reasons the Thesis Could Fail (Falsifiable)
The valuation is multiple-dependent (56% of variance); a de-rating toward the DCF anchor ($215) implies -27%.
Fact / Inference / Speculation
- FACT: Spot $295; 52-week range $252–$330; engine rating HOLD; base-case target $311 (+5%).
- INFERENCE: Triangulated FV $248 (-16%). P/E Multiple explains 56% of Monte Carlo outcome variance — i.e. value is set by the multiple the market will pay, a rate/sentiment regime bet as much as an earnings bet.
- SPECULATION: At current prices the embedded bet is that the multiple holds or expands — P/E Multiple carries 56% of outcome variance.
Recommendation: HOLD
Balanced: triangulated fair value $248 (-16% vs spot); the outcome hinges on P/E Multiple. The debate is P/E Multiple (56% of variance) — fundamentally a multiple/regime call. SBC runs —M TTM (disclosed in the appendix).