Rating: HOLD
| Metric | Value |
|---|---|
| Current Price | $50 |
| Triangulated Fair Value | $45 |
| 12-mo Scenario PWEV | $50 |
| Implied Return | -9% |
| Forward P/E | 10.9x |
| Market Cap | $61B |
| 52-Week Range | $39 – $55 |
Methodology: Valuation triangulated across five independent anchors — Monte Carlo (Student-t + regime switching), an independent DCF, peer re-rating, a sum-of-parts, and a scenario-weighted PWEV. Figures reconciled to Alpha Vantage 2026-06-27. Each chart below sits with the part of the thesis it evidences.
Investment Thesis
The bull case — 'Bull — Re-Rate / Buybacks' (8% weight) — targets $89, +79% vs spot. It needs the multiple to hold or expand.
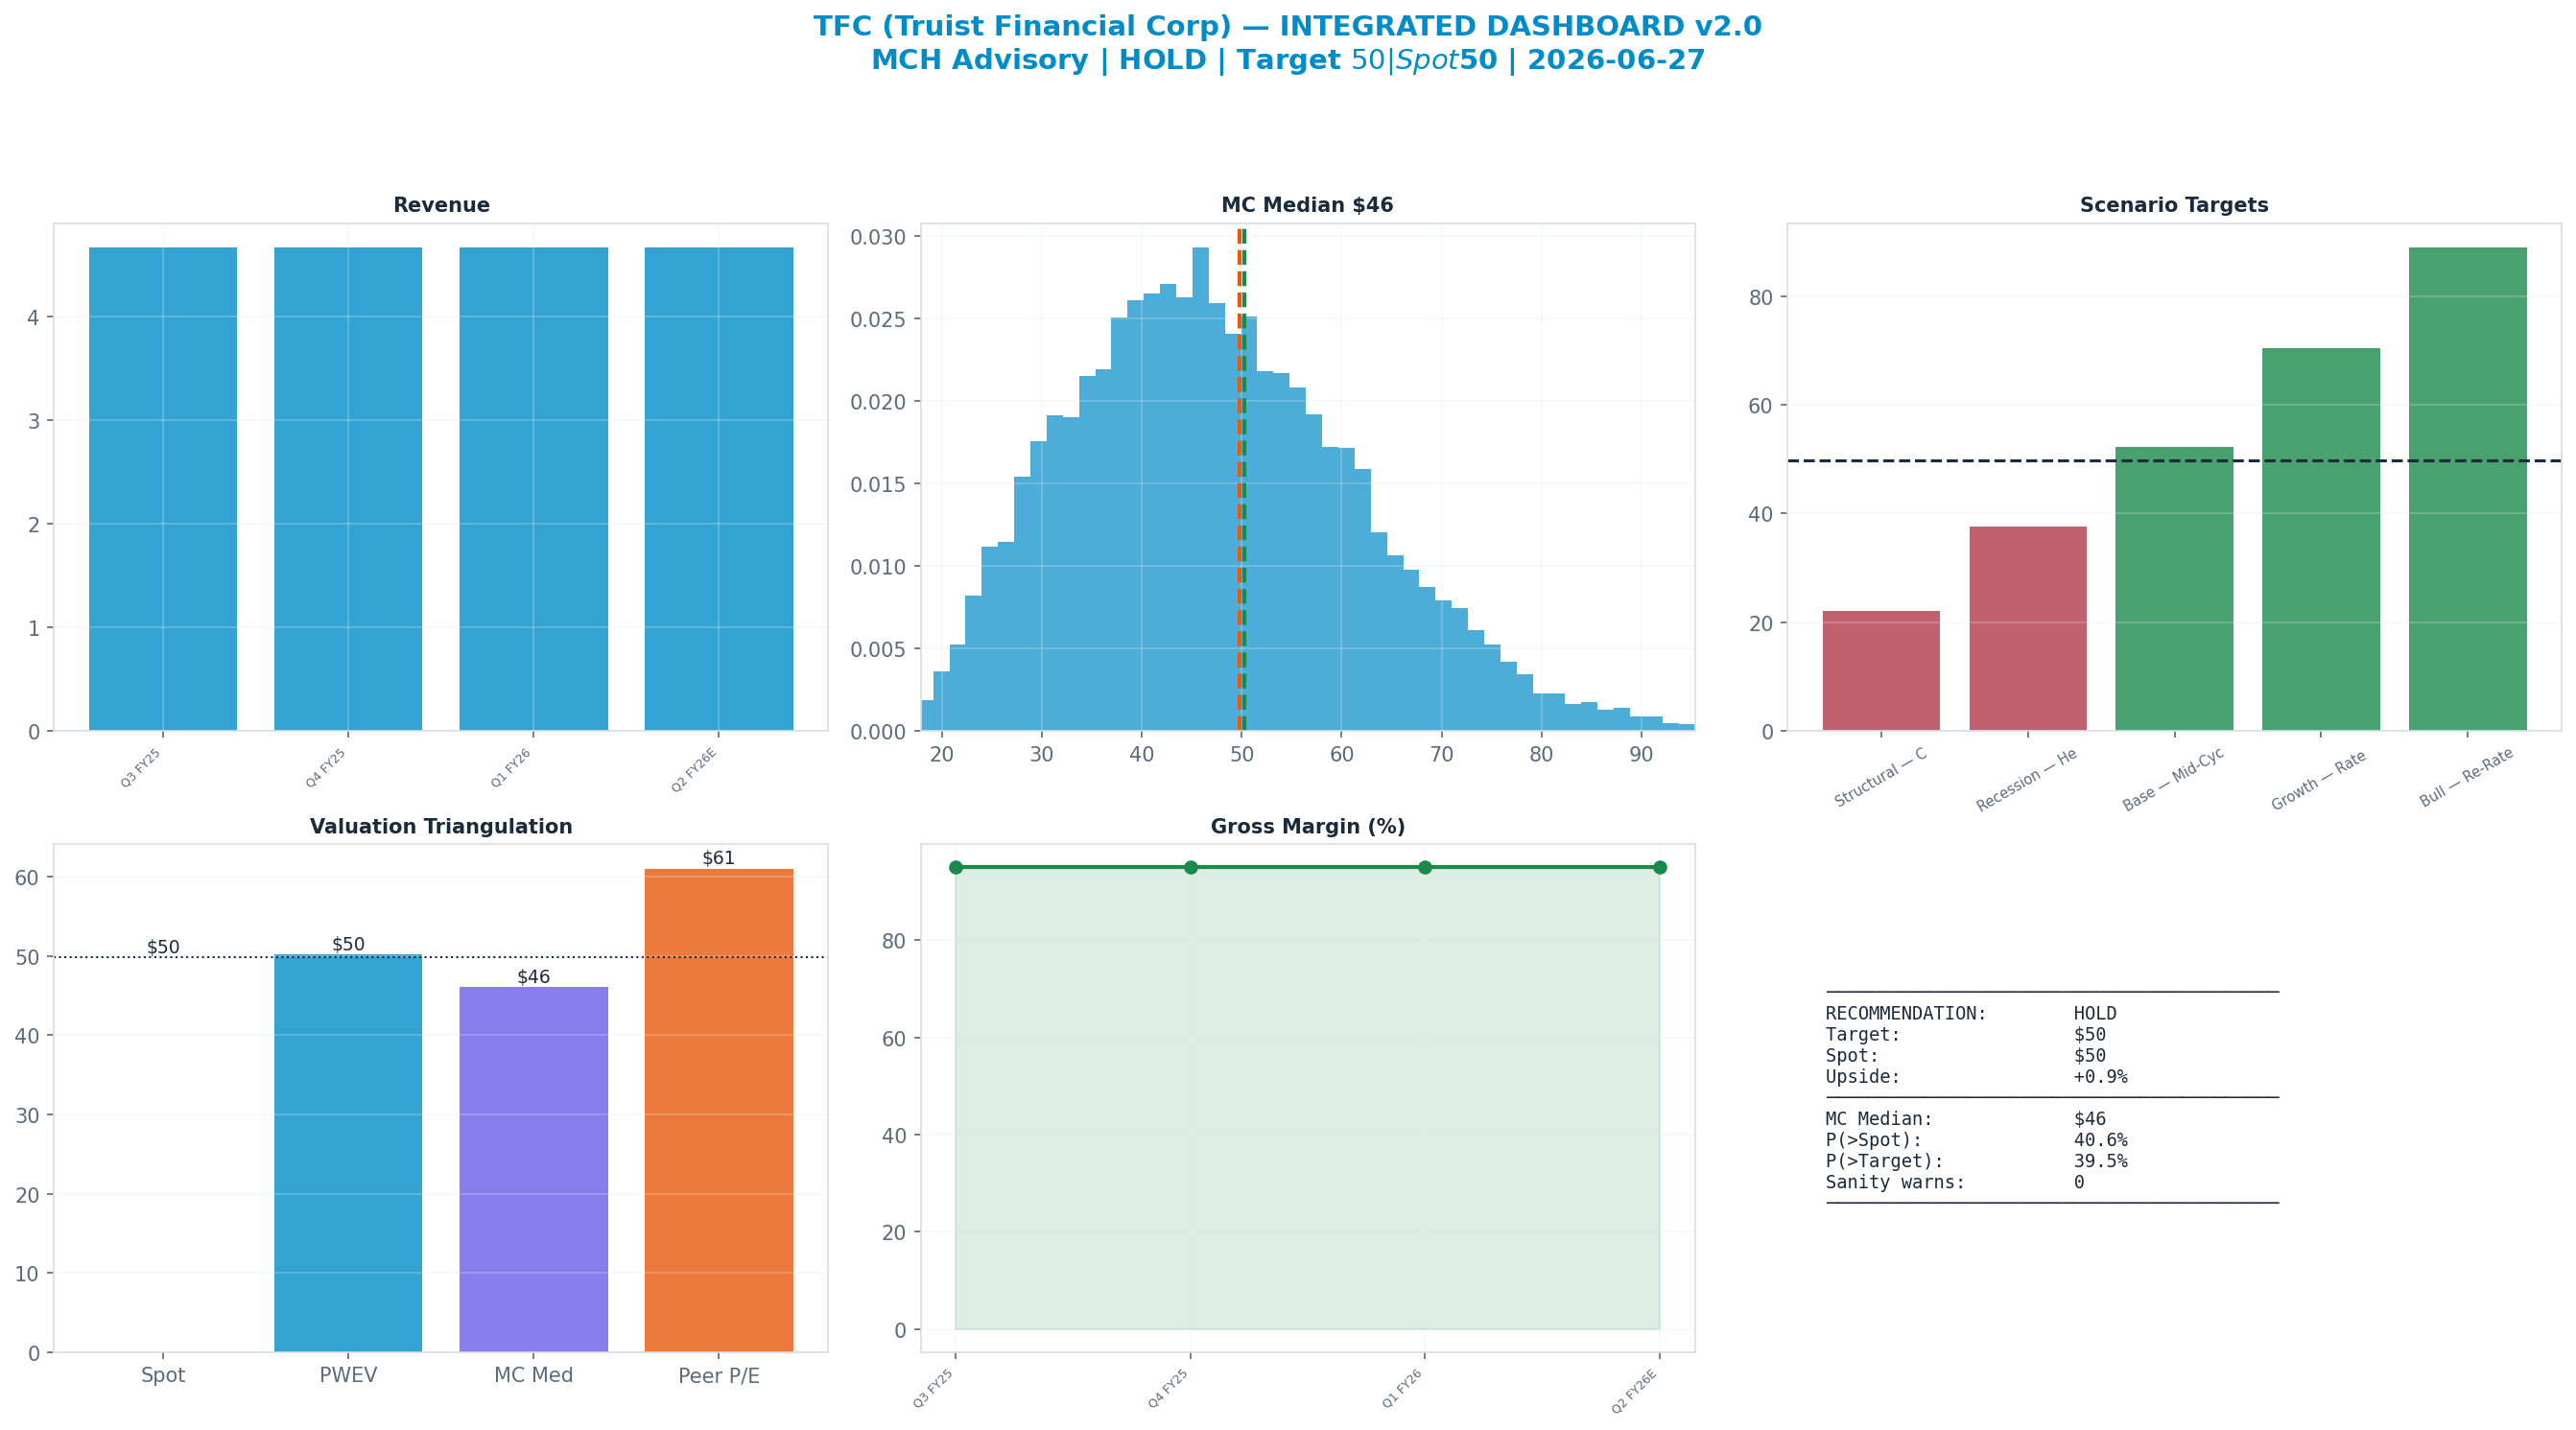
The dashboard below is the whole argument on one page: spot ($50) against each valuation anchor, the scenario tree, technicals and the options-implied move.
Anti-Thesis (The Real Bear Case)
The structural case — 'Structural — Credit Cycle / NIM Compression / Regulation' (20%) — targets $22, -56% vs spot. This sits below the 52-week low — a genuine structural impairment, not a mild pullback.
Key Debate
P/E Multiple explains 88% of Monte Carlo outcome variance — i.e. value is set by the multiple the market will pay, a rate/sentiment regime bet as much as an earnings bet.
Earnings-Call Disconfirmation & Sentiment
Derived signals from the MCH market-data store (Alpha Vantage transcripts + news). Quantitative tone only — a disconfirmation flag, not a substitute for reading the call.
Management vs analyst tone (2026Q1): management +0.53 vs analyst floor +0.02 → delta +0.52 (n=32 mgmt / 18 Q&A; 76th pctile across the S&P book, z +0.8).
Flag: TYPICAL — management-vs-analyst tone within the normal cross-sectional range.
| Quarter | Mgmt | Analyst | Delta |
|---|---|---|---|
| 2026Q1 | +0.53 | +0.02 | +0.52 |
| 2025Q4 | +0.39 | +0.20 | +0.19 |
| 2025Q3 | +0.31 | +0.02 | +0.29 |
| 2025Q2 | +0.44 | +0.33 | +0.11 |
News (last 365d, 1000 articles): avg ticker sentiment +0.14 (bullish 7% / bearish 1%)
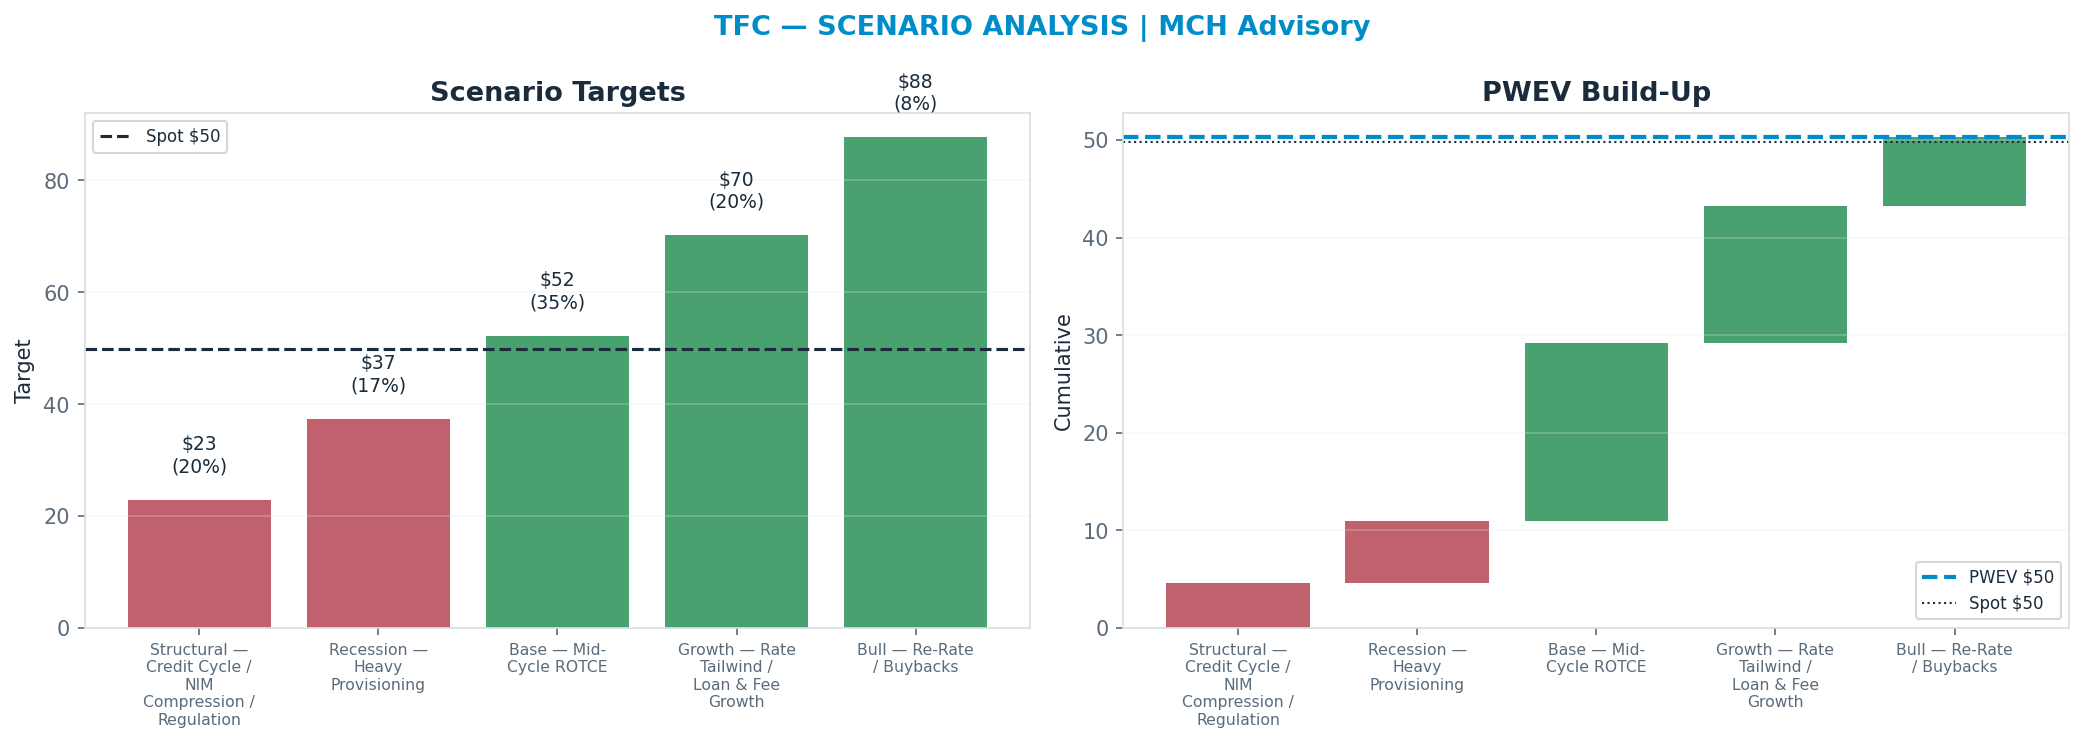
Scenario Analysis
The tree runs from a structural 'Structural — Credit Cycle / NIM Compression / Regulation' downside ($22) to a 'Bull — Re-Rate / Buybacks' bull case ($89); the probability-weighted blend (PWEV $50) is +1% versus spot.
| Scenario | Probability | Target | Return |
|---|---|---|---|
| Structural — Credit Cycle / NIM Compression / Regulation | 20% | $22 | -56% |
| Recession — Heavy Provisioning | 17% | $38 | -25% |
| Base — Mid-Cycle ROTCE | 35% | $52 | +5% |
| Growth — Rate Tailwind / Loan & Fee Growth | 20% | $70 | +41% |
| Bull — Re-Rate / Buybacks | 8% | $89 | +79% |
| Probability-Weighted (PWEV) | — | $50 | +1% |
Scenario rationale — what each probability buys (the driver path behind every target):
- Structural — Credit Cycle / NIM Compression / Regulation (20%, $22). Structural impairment — credit cycle / NIM compression / regulation: earnings AND the multiple compress together. Target sits below the 52-week low by construction. Drivers — implied_target: 22.12; probability: 0.2.
- Recession — Heavy Provisioning (17%, $38). Cyclical downturn — loan growth + net interest margin + credit costs + ROTCE + capital return weakens for 1–2 years before normalising. Drivers — implied_target: 37.56; probability: 0.17.
- Base — Mid-Cycle ROTCE (35%, $52). Mid-cycle — normalised loan growth + net interest margin + credit costs + ROTCE + capital return; disciplined capital allocation; steady returns. Drivers — implied_target: 52.17; probability: 0.35.
- Growth — Rate Tailwind / Loan & Fee Growth (20%, $70). Upside — rate tailwind + loan & fee growth lifts earnings above mid-cycle; the multiple expands modestly. Drivers — implied_target: 70.43; probability: 0.2.
- Bull — Re-Rate / Buybacks (8%, $89). Upside tail — sustained tight conditions or a structural re-rate on rate tailwind + loan & fee growth. Drivers — implied_target: 88.95; probability: 0.08.
Valuation Triangulation
Five anchors — but read them with their basis in mind. The Monte Carlo, the DCF terminal, and the peer re-rate all key off a market multiple, so they are not fully independent; only the discounted cash flows themselves are genuinely multiple-free. The discipline is to read the spread and weight the cash-based view, not to treat five numbers as five independent votes.
| Method | Basis | Fair Value | vs Spot |
|---|---|---|---|
| Monte Carlo median (Student-t + regime) | multiple | $46 | -7% |
| Peer P/E re-rate | multiple | $61 | +23% |
| Peer EV/Revenue re-rate | multiple | $48 | -3% |
| Scenario PWEV | multiple | $50 | +1% |
| Justified P/B (ROE-based) | book value × ROE | $37 | -25% |
| Triangulated (weighted) | — | $45 | -9% |
Book Value, ROE & Capital Returns
For a bank or insurer the cash-flow DCF is the wrong intrinsic anchor — capital is the product. Value is set by return on equity vs cost of equity against book value: the Gordon-justified multiple is P/B = (ROE − g) / (COE − g).
| Metric | Value |
|---|---|
| Book value / share | $48 |
| Return on equity (ROE) | 8.6% |
| Cost of equity (assumed) | 10.0% |
| Current P/B | 1.05x |
| Justified P/B (ROE-based) | 0.78x |
| Justified value / share | $37 (-25%) |
ROE of 8.6% falls short of the ~10% cost of equity — which is why a sub-1x justified P/B of 0.78x (vs 1.05x current) is warranted. The justified value sits -25% vs spot; that gap, plus the credit / underwriting cycle in the scenarios, is the debate. The Monte Carlo and scenario PWEV carry the earnings (P/E) view; this block carries the book-value view.
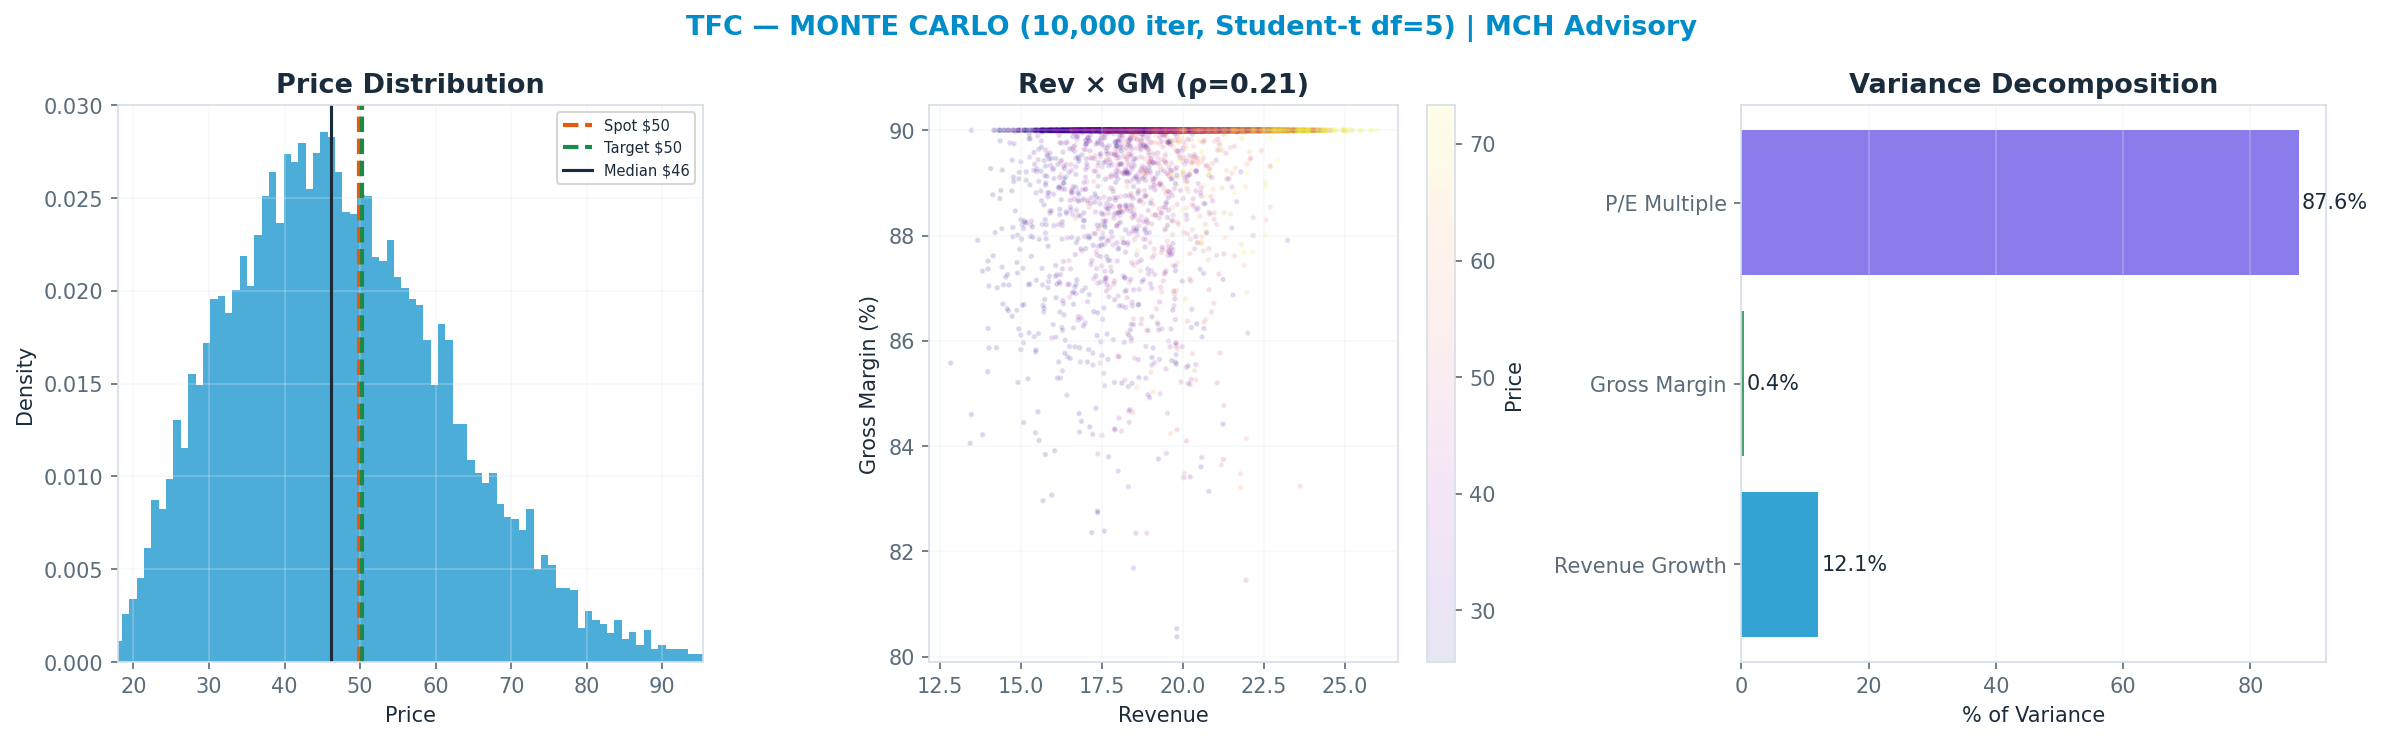
Monte Carlo — the distribution, not a point
10,000 paths, Student-t shocks (fat tails) with a regime-switching overlay. The median lands at $46 and 41% of paths finish above spot. The variance decomposition shows the p/e multiple is the dominant swing factor (88% of variance). Value is a multiple bet: fundamentals move the answer far less than the rating does.
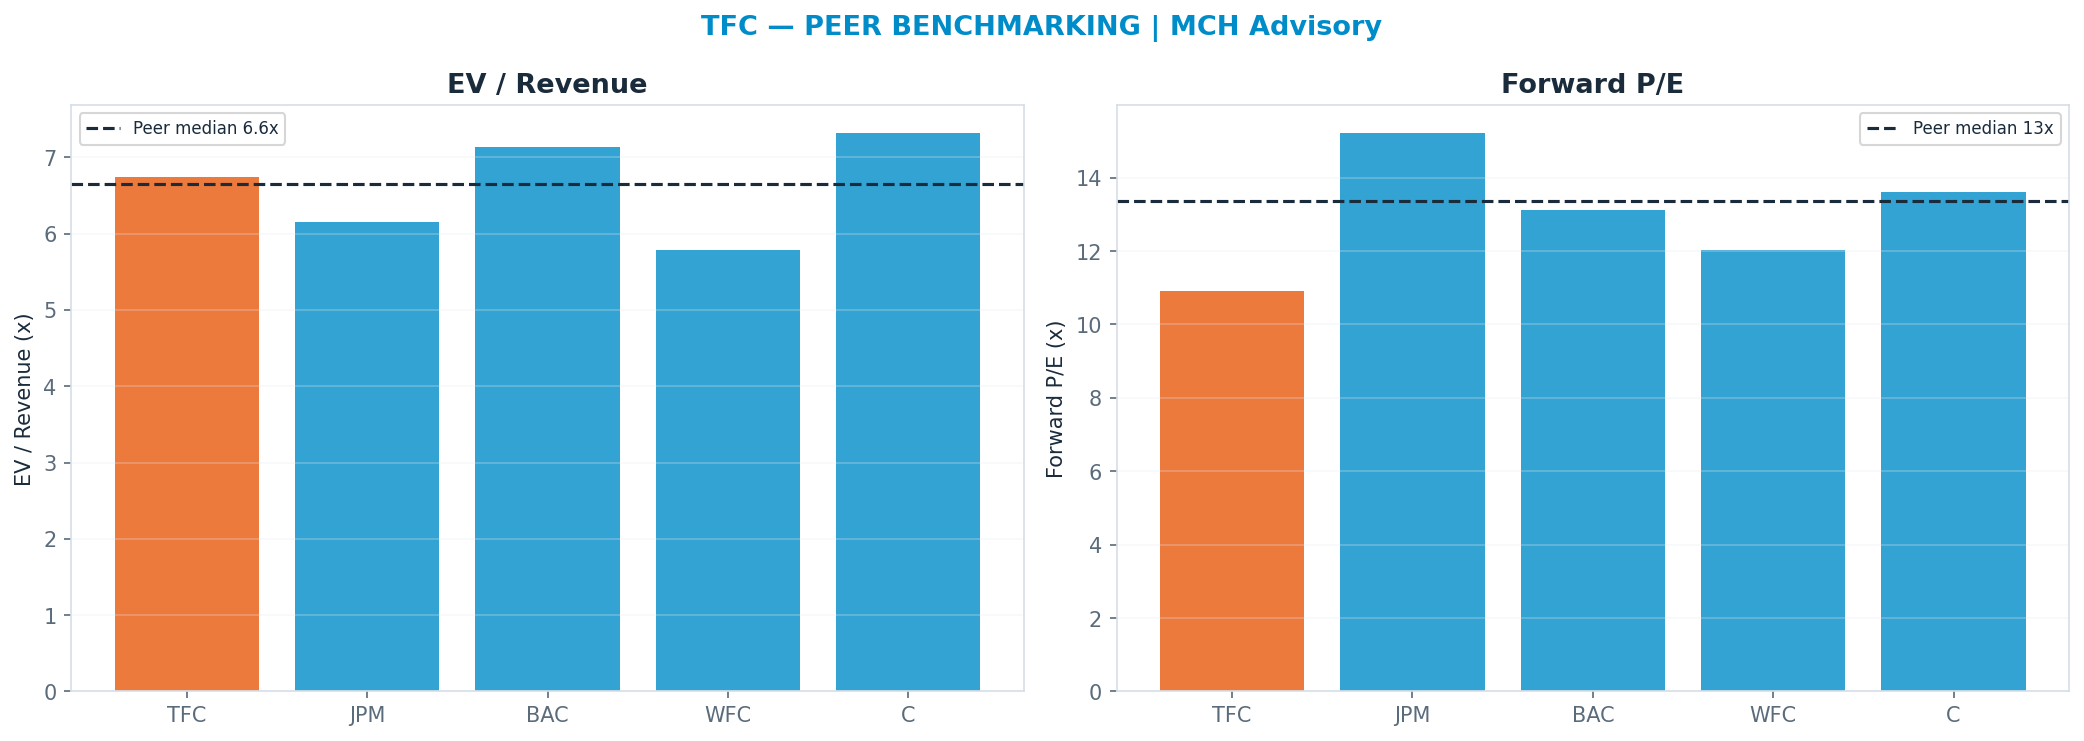
Peer benchmarking — relative value
Against the peer cohort, re-rating to the peer-median forward multiple (P/E 13.36x) implies $61. A premium is only justified by superior growth/margins; otherwise it is multiple risk. Weighted just 20% so the market's mood does not drive the fair value.
Across all anchors the spread is tight (the methods corroborate one another).
Revenue-Segment Breakdown
The company-specific drivers behind the valuation — each segment carries its own growth, margin, multiple and capex intensity. (Tags: FACT reported · ESTIMATE from disclosures · INFERENCE judgment.)
| Segment | Revenue | Mix | Growth | Op margin | Multiple | Capex % | Tag |
|---|---|---|---|---|---|---|---|
| Banking (NII + Fees) | $18.7B | 100% | 5% | 42% | 11x | 1% | ESTIMATE |
Named Exposures
Demand & pricing cycle (FACT/ESTIMATE)
| Dimension | Assessment |
|---|---|
| driver | loan growth + net interest margin + credit costs + ROTCE + capital return |
| net_debt_or_cash_b | -64.77 |
Capital intensity & shareholder returns (ESTIMATE)
| Dimension | Assessment |
|---|---|
| capex_pct_revenue | 0.01 |
| div_yield | 0.0419 |
Structural risk vs optionality (INFERENCE)
| Dimension | Assessment |
|---|---|
| downside | credit cycle / NIM compression / regulation |
| upside | rate tailwind + loan & fee growth |
Industry Context — Financials — Banks
This name sits in the Financials — Banks as a bank. loan growth + net interest margin + credit costs + ROTCE + capital return Its scenarios are not guessed in isolation — they inherit a single, shared view of the cluster's driver cycle, so the names that depend on the same event are mutually consistent.
Value chain: BAC (bank) · MS (bank) · GS (bank) · WFC (bank) · C (bank) · COF (bank) · BNY (bank) · PNC (bank) · USB (bank) · TFC (bank) · FITB (bank) · STT (bank) · HBAN (bank) · MTB (bank) · NTRS (bank) · CFG (bank) · SYF (bank) · RF (bank) · KEY (bank)
| Shared state | Capex path | House view | This name implies |
|---|---|---|---|
| Credit Cycle / NIM Compression / Regulation | 37% | 37% | |
| Mid-Cycle — ROTCE + Loan Growth | 35% | 35% | |
| Upside — Rate Tailwind / Capital Return | 28% | 28% |
On the cluster's key downside — Credit Cycle / NIM Compression / Regulation () — this name implies 37% vs the cluster house view of 37% (in line with the house). The cluster's full cross-stock reconciliation governs that the names which ride the same capex cycle assign it comparable odds.
Structure: Shared State — The fin_banks cycle is the shared macro driver. Driver — loan growth + net interest margin + credit costs + ROTCE + capital return Dispersion — Members differ by cyclicality (quality compounders vs deep cyclicals).
Load-Bearing Assumptions
No DCF anchor is meaningful for this asset; the blend leans 50% on probability-weighted scenarios and 30% on the Monte Carlo median — the scenario probabilities are the load-bearing inputs.
Reasons the Thesis Could Fail (Falsifiable)
The valuation is multiple-dependent (88% of variance); a de-rating toward the Monte-Carlo anchor ($46) implies -7%.
Fact / Inference / Speculation
- FACT: Spot $50; 52-week range $39–$55; engine rating HOLD; base-case target $50 (+1%).
- INFERENCE: Triangulated FV $45 (-9%). P/E Multiple explains 88% of Monte Carlo outcome variance — i.e. value is set by the multiple the market will pay, a rate/sentiment regime bet as much as an earnings bet.
- SPECULATION: At current prices the embedded bet is that the multiple holds or expands — P/E Multiple carries 88% of outcome variance.
Recommendation: HOLD
Balanced: triangulated fair value $51 (+3% vs spot); the outcome hinges on P/E Multiple. The debate is P/E Multiple (88% of variance) — fundamentally a multiple/regime call. SBC runs —M TTM (disclosed in the appendix).