Rating: BUY
| Metric | Value |
|---|---|
| Current Price | $93 |
| Triangulated Fair Value | $104 |
| 12-mo Scenario PWEV | $105 |
| Implied Return | +11% |
| Forward P/E | 9.7x |
| Market Cap | $100B |
| 52-Week Range | $55 – $134 |
Methodology: Valuation triangulated across five independent anchors — Monte Carlo (Student-t + regime switching), an independent DCF, peer re-rating, a sum-of-parts, and a scenario-weighted PWEV. Figures reconciled to mch_weekly_run live prices + AV OVERVIEW refresh 2026-04-23. Each chart below sits with the part of the thesis it evidences.
Investment Thesis
The bull case — 'Fiat Crisis + Synergy' (10% weight) — targets $180, +93% vs spot. It needs the multiple to hold or expand.
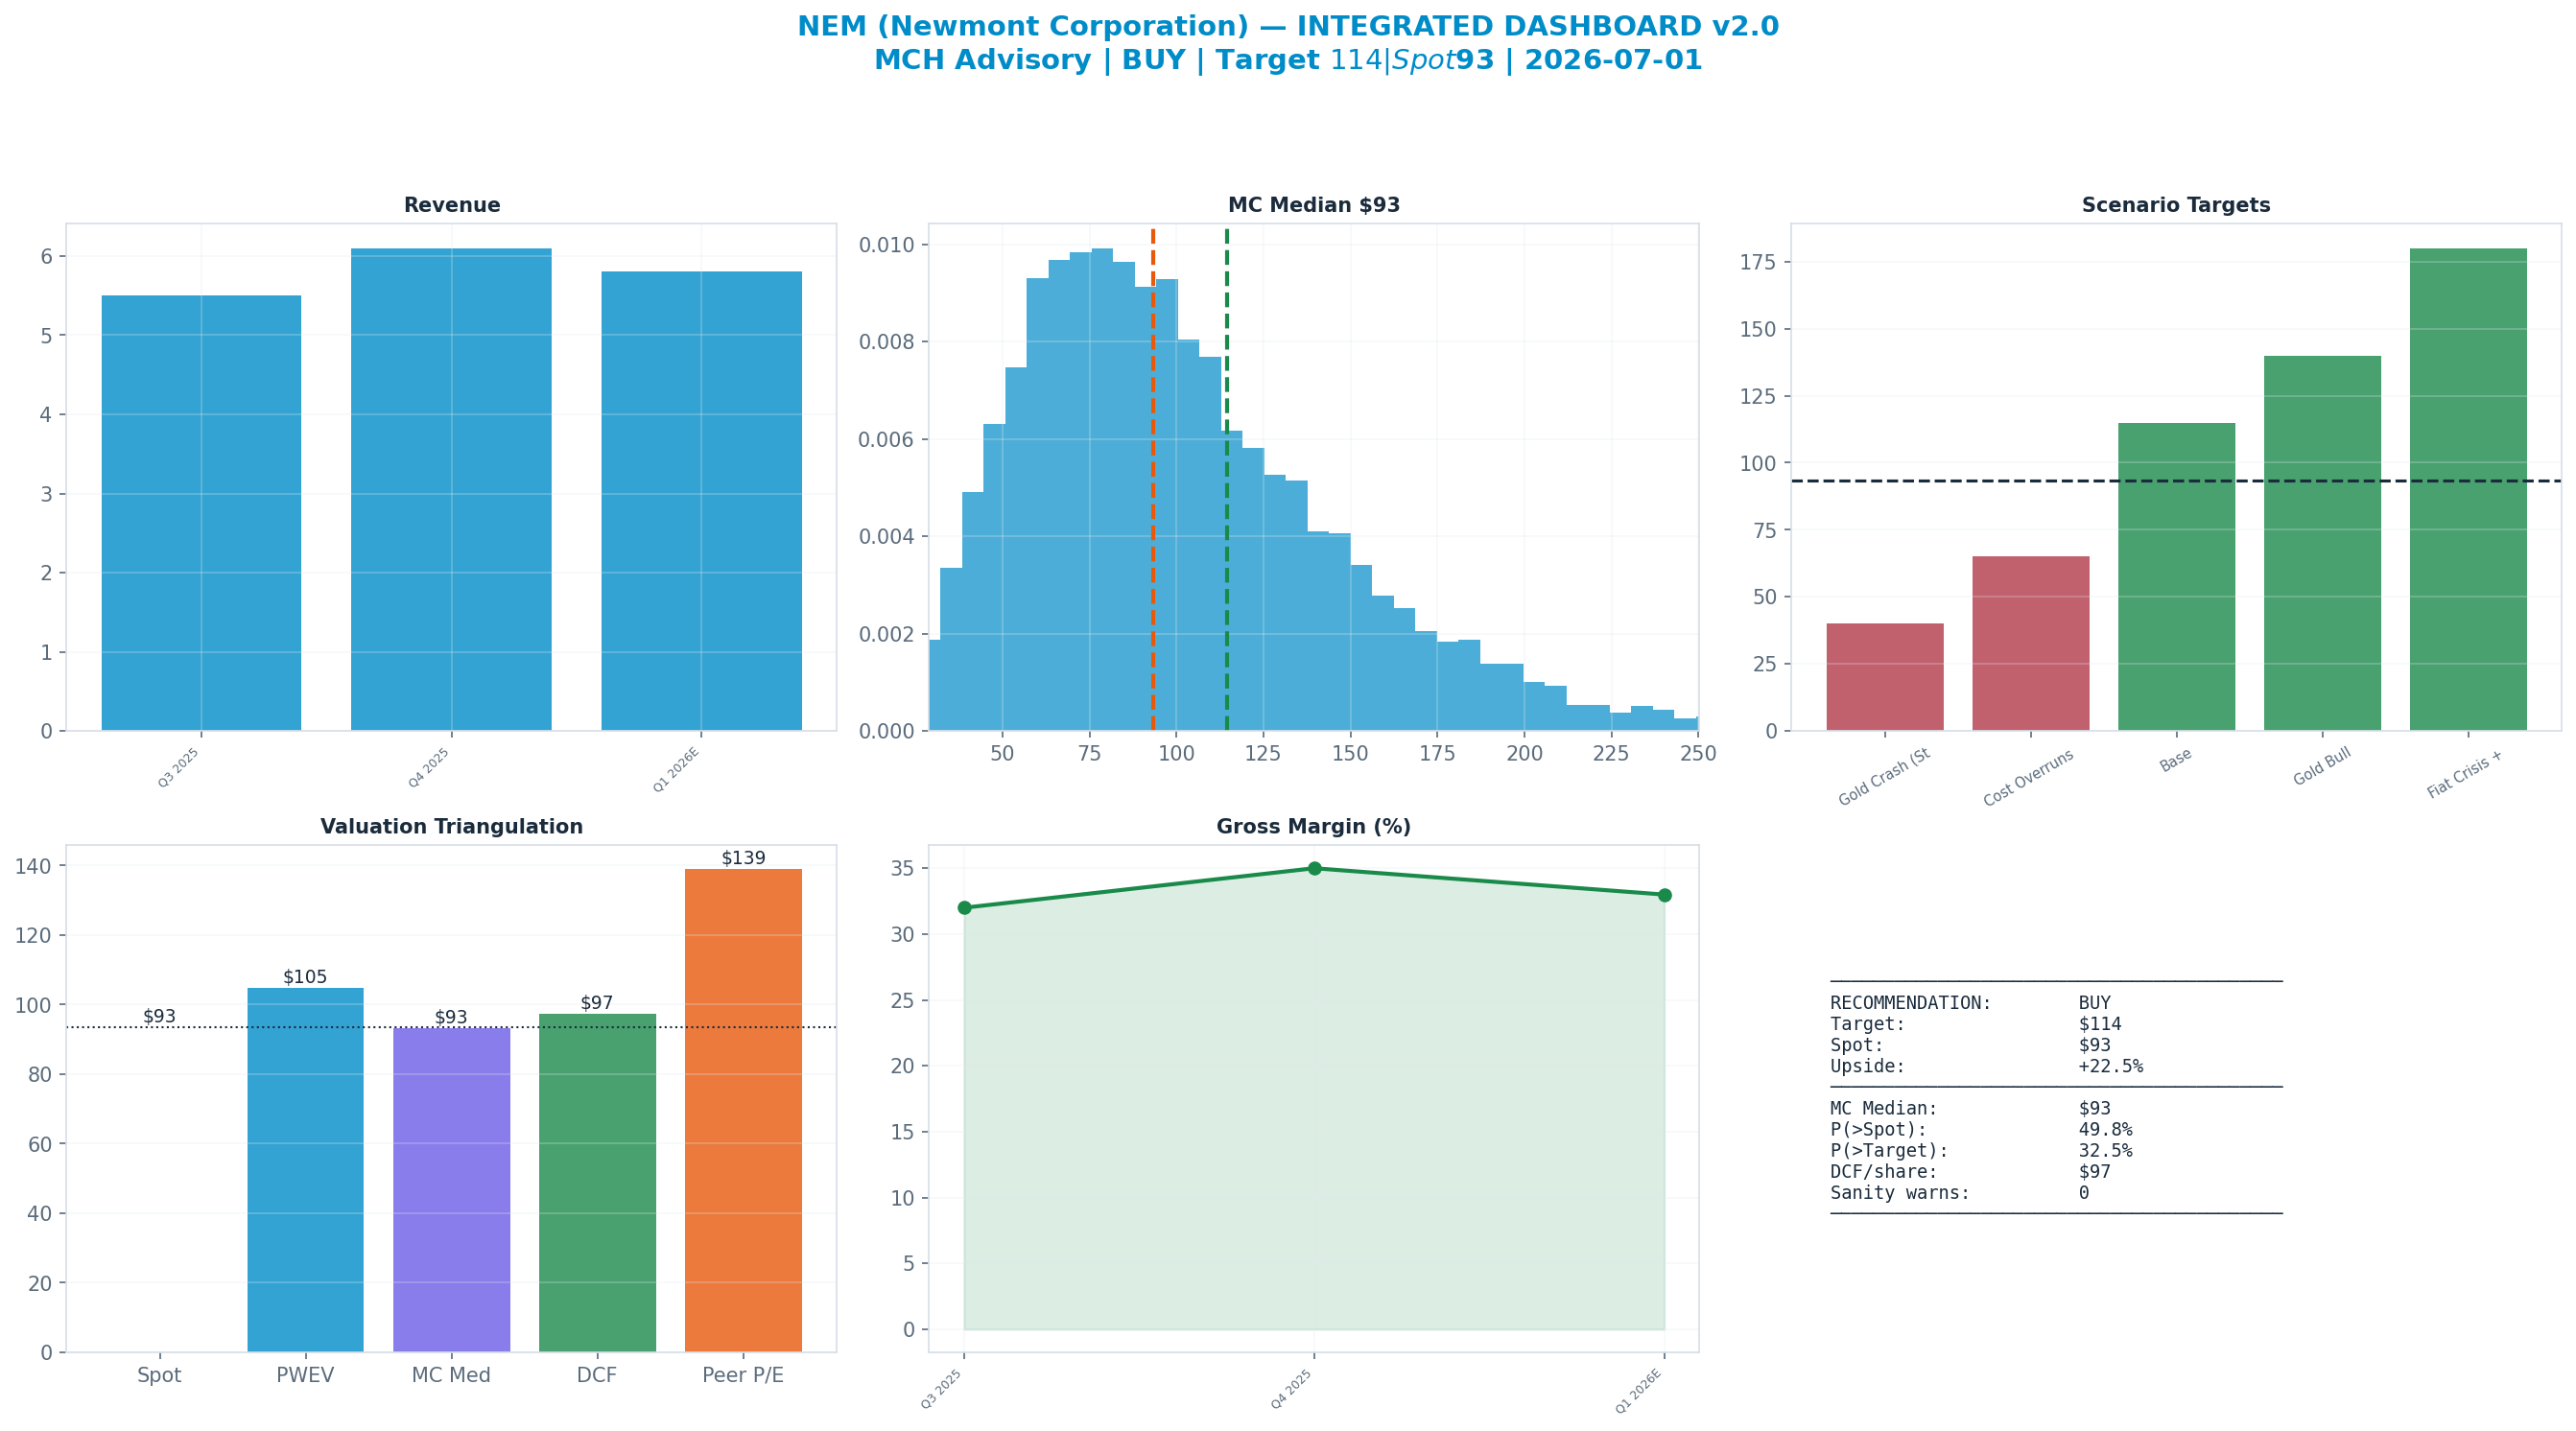
The dashboard below is the whole argument on one page: spot ($93) against each valuation anchor, the scenario tree, technicals and the options-implied move.
Anti-Thesis (The Real Bear Case)
The structural case — 'Gold Crash (Structural)' (20%) — targets $40, -57% vs spot. This sits below the 52-week low — a genuine structural impairment, not a mild pullback.
Key Debate
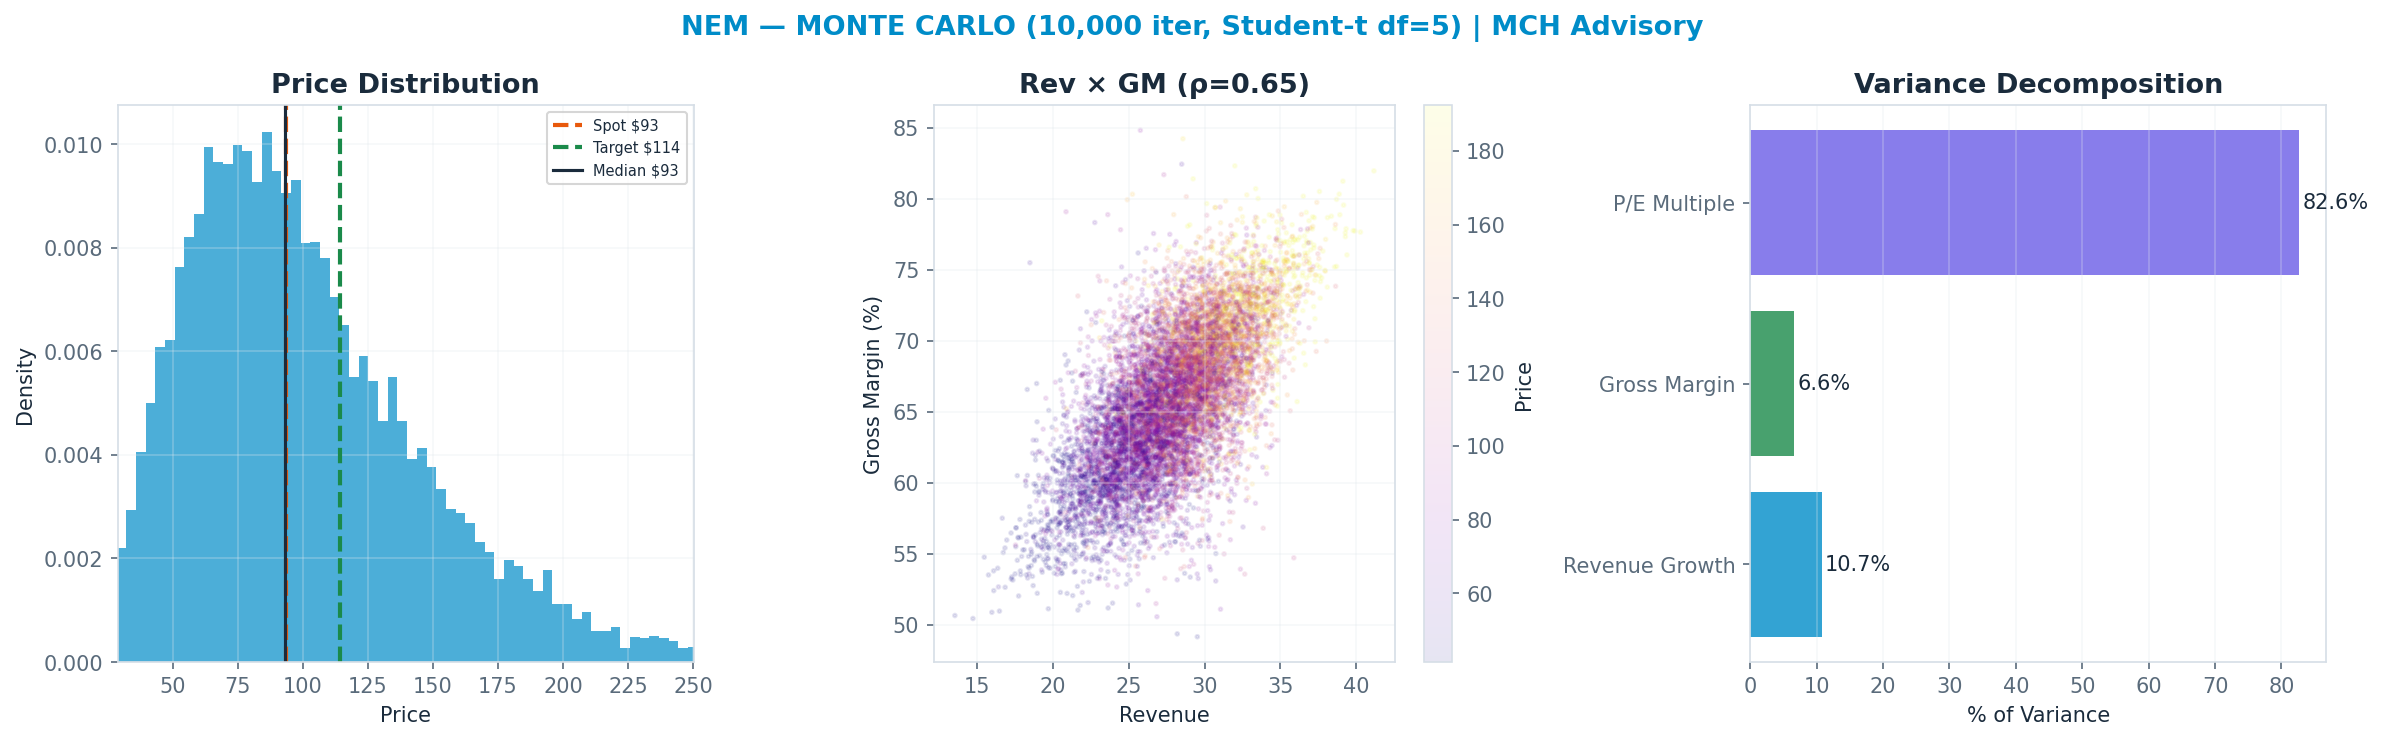
P/E Multiple explains 83% of Monte Carlo outcome variance — i.e. value is set by the multiple the market will pay, a rate/sentiment regime bet as much as an earnings bet.
Earnings-Call Disconfirmation & Sentiment
Derived signals from the MCH market-data store (Alpha Vantage transcripts + news). Quantitative tone only — a disconfirmation flag, not a substitute for reading the call.
Management vs analyst tone (2026Q1): management +0.19 vs analyst floor +0.00 → delta +0.19 (n=29 mgmt / 27 Q&A; 12th pctile across the S&P book, z -1.2).
Flag: CANDID — management unusually candid/cautious vs peers (relatively low spin).
| Quarter | Mgmt | Analyst | Delta |
|---|---|---|---|
| 2026Q1 | +0.19 | +0.00 | +0.19 |
| 2025Q4 | +0.47 | +0.35 | +0.11 |
| 2025Q3 | +0.49 | +0.33 | +0.16 |
| 2025Q2 | +0.50 | +0.33 | +0.17 |
News (last 365d, 1000 articles): avg ticker sentiment +0.17 (bullish 19% / bearish 4%)
Scenario Analysis
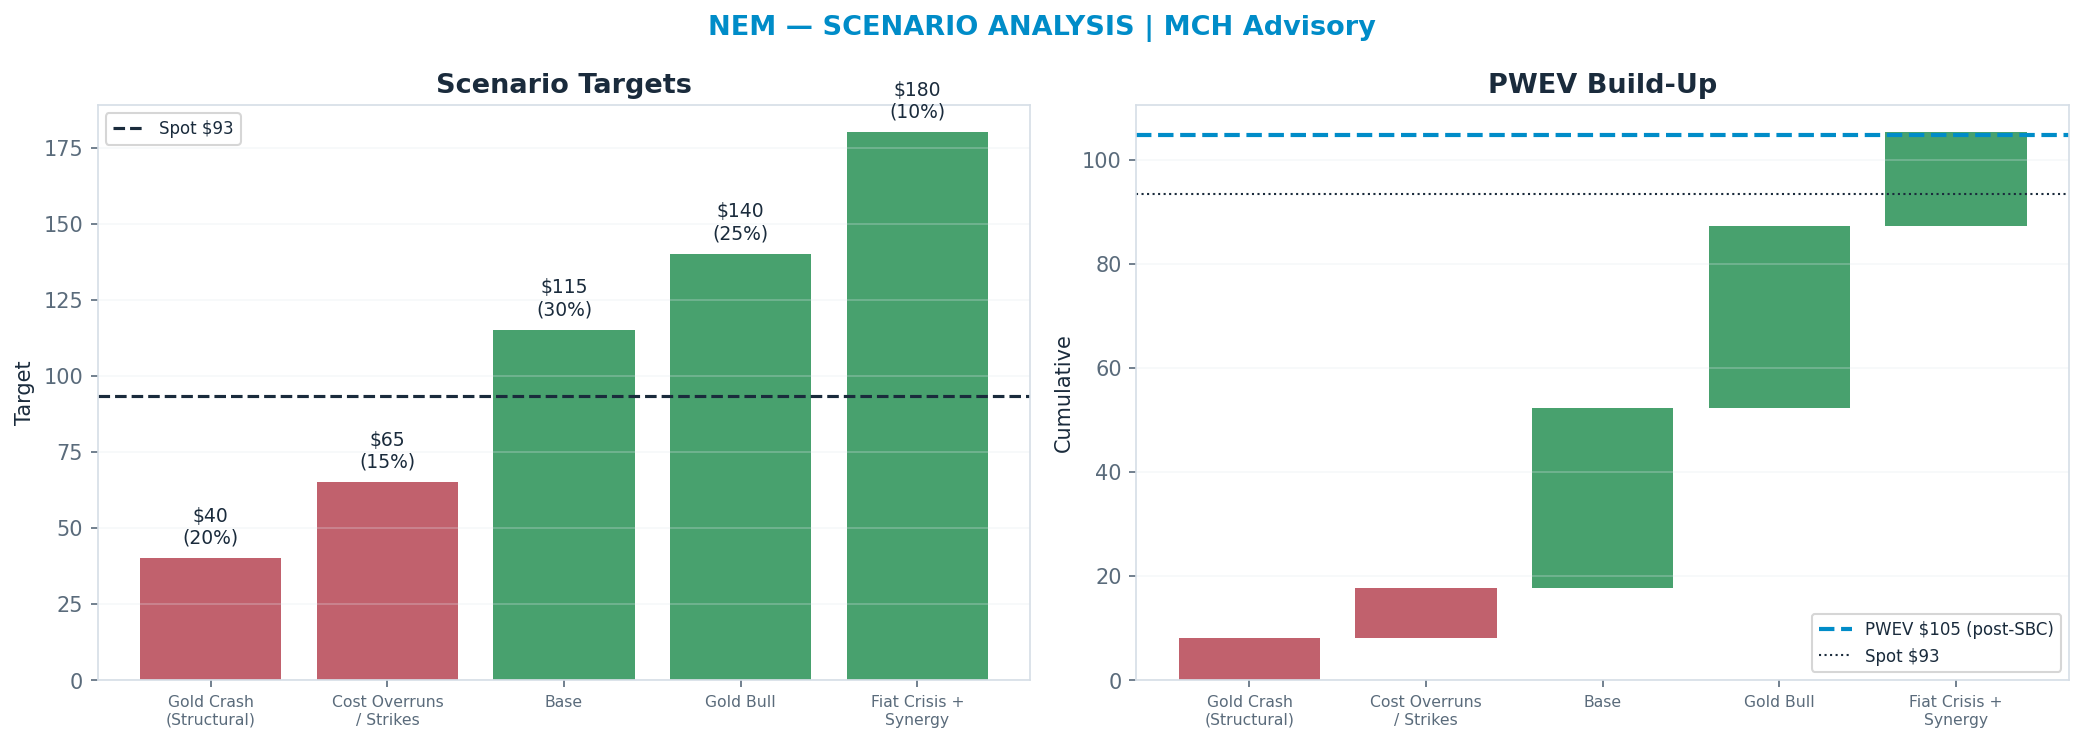
The tree runs from a structural 'Gold Crash (Structural)' downside ($40) to a 'Fiat Crisis + Synergy' bull case ($180); the probability-weighted blend (PWEV $105) is +12% versus spot.
| Scenario | Probability | Target | Return |
|---|---|---|---|
| Gold Crash (Structural) | 20% | $40 | -57% |
| Cost Overruns / Strikes | 15% | $65 | -30% |
| Base | 30% | $115 | +23% |
| Gold Bull | 25% | $140 | +50% |
| Fiat Crisis + Synergy | 10% | $180 | +93% |
| Probability-Weighted (PWEV, after SBC dilution) | — | $105 | +12% |
SBC charge: scenario targets are gross per-share prices; the PWEV is reduced by one year of stock-based-compensation dilution (0.5% of shares, on SBC ≈ 1% of revenue), trimming the gross PWEV of $105 to $105 (-0.5%). SBC is charged once, as dilution — never also deducted from FCF.
Scenario rationale — what each probability buys (the driver path behind every target):
- Gold Crash (Structural) (20%, $40). Real rates spike and the central-bank bid fades; gold de-rates toward ~$1,700-1,800/oz while AISC stays sticky near $1,400/oz, collapsing the AISC margin and FCF. High-cost assets turn cash-negative, the dividend is cut, and the EV/EBITDA multiple compresses as the sector de-rates. Target sits well below the 52-week low — a genuine structural impairment, not a pullback. Drivers — gold_price: ~$1,750/oz; aisc: ~$1,400/oz; production: ~5.5 Moz; op_margin: ~25%; multiple: ~4.5x EV/EBITDA.
- Cost Overruns / Strikes (15%, $65). Gold holds near spot but AISC inflates past $1,500/oz on labor/diesel and a strike or permitting stoppage at a Tier-1 asset clips production toward ~5.3 Moz. Newcrest synergies slip, FCF disappoints versus a benign gold tape, and the multiple stays capped as the market discounts execution credibility. Drivers — gold_price: ~$2,400/oz; aisc: ~$1,550/oz; production: ~5.3 Moz; op_margin: ~40%; multiple: ~6x EV/EBITDA.
- Base (30%, $115). Gold sustains around spot, production holds ~5.8-6.0 Moz, and AISC stabilizes ~$1,350-1,400/oz as Newcrest synergies partly land. FCF funds the dividend, buyback, and de-levering; the multiple normalizes to a mid-cycle ~6.5-7x EV/EBITDA on a credible Tier-1 portfolio. Drivers — gold_price: ~$2,450/oz; aisc: ~$1,375/oz; production: ~5.9 Moz; op_margin: ~52%; multiple: ~6.5x EV/EBITDA.
- Gold Bull (25%, $140). Gold runs to ~$2,800/oz on falling real rates and sustained central-bank buying while AISC holds — the operating-leverage flywheel drops outsized EBITDA and FCF. Synergies land, the balance sheet de-levers fast, and the multiple re-rates toward ~8x as FCF yield and capital returns expand. Drivers — gold_price: ~$2,800/oz; aisc: ~$1,375/oz; production: ~6.0 Moz; op_margin: ~60%; multiple: ~8x EV/EBITDA.
- Fiat Crisis + Synergy (10%, $180). A monetary-debasement / haven regime drives gold above
$3,200/oz, full Newcrest synergies ($500M/yr) land, and copper optionality is re-rated as a strategic by-product. AISC margin and FCF inflect to record levels; the market awards a scarcity premium to the only senior Tier-1 gold major, pushing the multiple toward ~9x. Drivers — gold_price: >$3,200/oz; aisc: ~$1,350/oz; production: ~6.0 Moz; op_margin: >65%; multiple: ~9x EV/EBITDA.
Valuation Triangulation
Five anchors — but read them with their basis in mind. The Monte Carlo, the DCF terminal, and the peer re-rate all key off a market multiple, so they are not fully independent; only the discounted cash flows themselves are genuinely multiple-free. The discipline is to read the spread and weight the cash-based view, not to treat five numbers as five independent votes.
| Method | Basis | Fair Value | vs Spot |
|---|---|---|---|
| Monte Carlo median (Student-t + regime) | multiple | $93 | -0% |
| Peer P/E re-rate | multiple | $139 | +49% |
| Peer EV/Revenue re-rate | multiple | $69 | -26% |
| Scenario PWEV | multiple | $105 | +12% |
| DCF (5-year + terminal) | cash flow + terminal × | $97 | +4% |
| Triangulated (weighted) | — | $104 | +11% |
Monte Carlo — the distribution, not a point
10,000 paths, Student-t shocks (fat tails) with a regime-switching overlay. The median lands at $93 and 50% of paths finish above spot. The variance decomposition shows the p/e multiple is the dominant swing factor (83% of variance). Value is a multiple bet: fundamentals move the answer far less than the rating does.
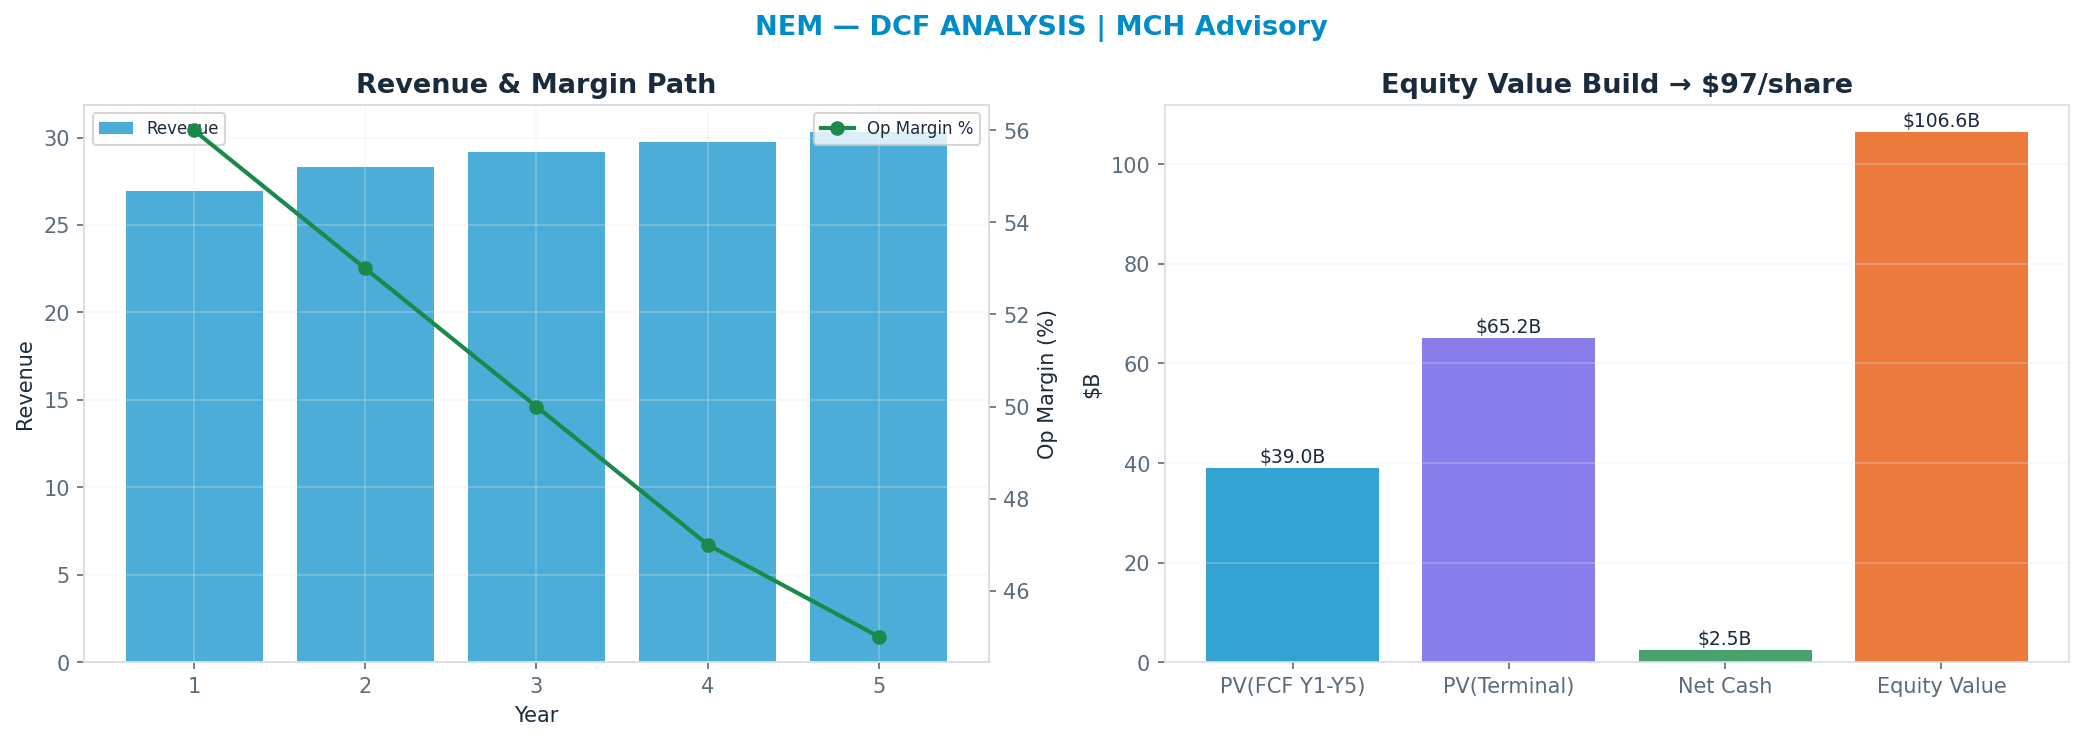
DCF — the cash-flow anchor
Independent of the market multiple: a 5-year path, WACC 10.0%, 11x terminal FCF multiple → $97. This anchor is deliberately the heaviest (41%): it is the valuation least hostage to the current multiple regime.
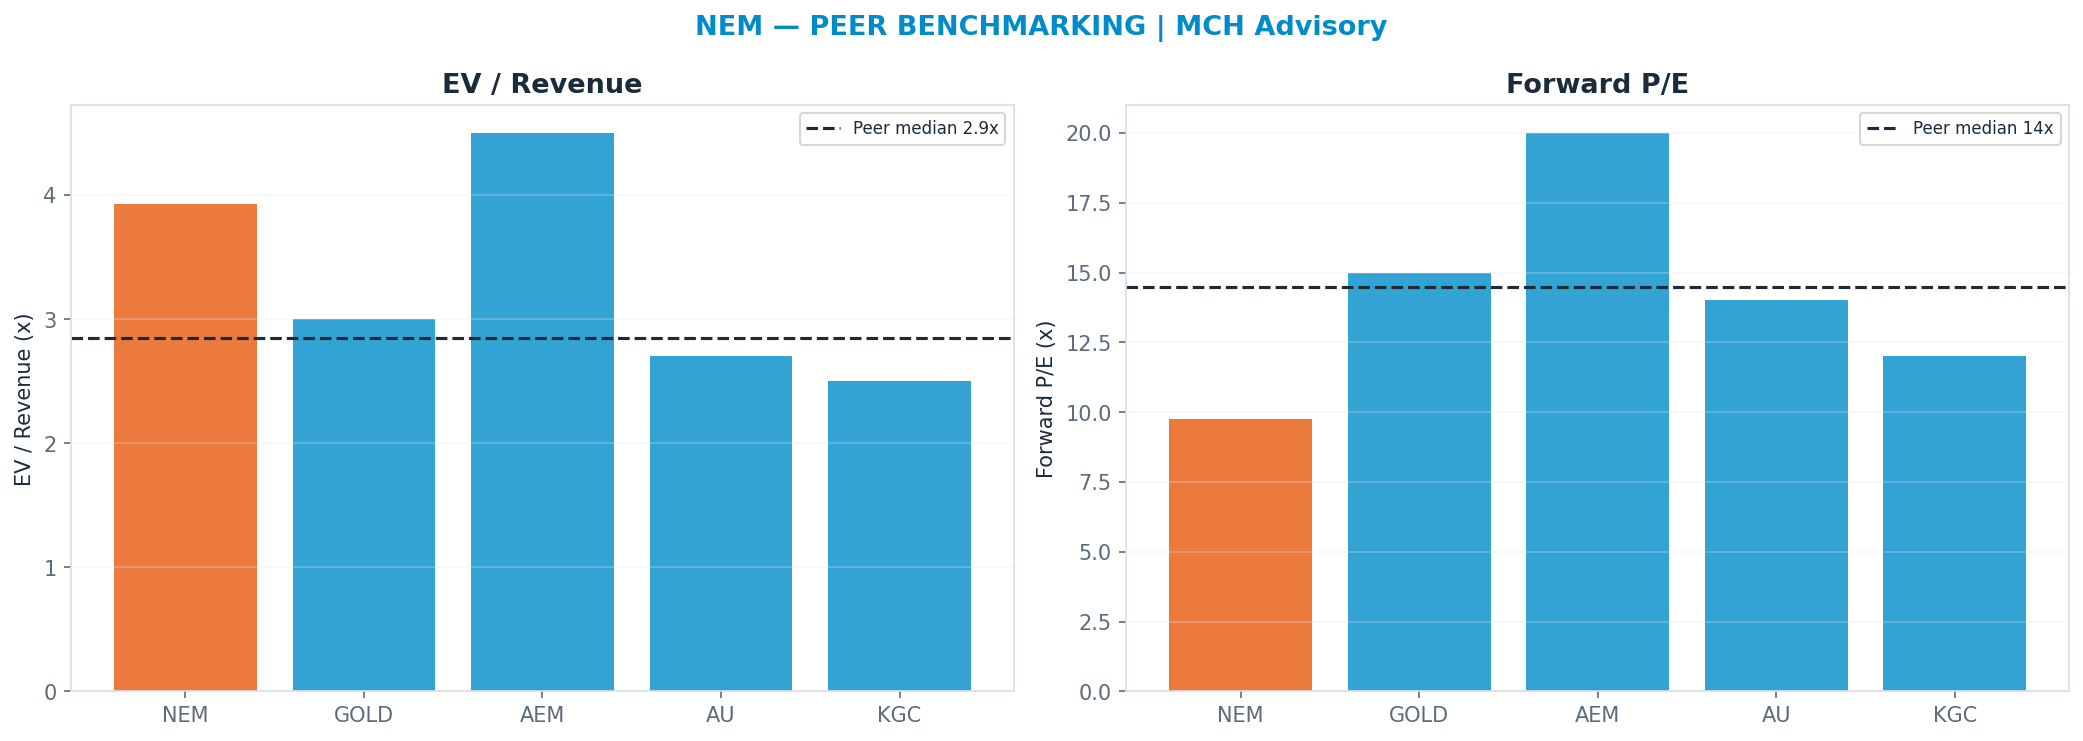
Peer benchmarking — relative value
Against the peer cohort, re-rating to the peer-median forward multiple (P/E 14.5x) implies $139. A premium is only justified by superior growth/margins; otherwise it is multiple risk. Weighted just 12% so the market's mood does not drive the fair value.
Across all anchors the spread is wide (genuine disagreement — low valuation confidence).
Revenue-Segment Breakdown
The company-specific drivers behind the valuation — each segment carries its own growth, margin, multiple and capex intensity. (Tags: FACT reported · ESTIMATE from disclosures · INFERENCE judgment.)
| Segment | Revenue | Mix | Growth | Op margin | Multiple | Capex % | Tag |
|---|---|---|---|---|---|---|---|
| Gold — Core (Tier-1 portfolio) | $21B | 84% | 5% | 55% | 7x | 16% | FACT/ESTIMATE |
| Nevada Gold Mines JV (38.5%) | $0B | 0% | 3% | 55% | 7x | 16% | FACT/INFERENCE |
| Copper & by-products (optionality) | $4B | 16% | 8% | 45% | 6x | 20% | FACT/ESTIMATE |
Named Exposures
Gold price sensitivity (FACT/ESTIMATE/INFERENCE)
| Dimension | Assessment |
|---|---|
| Spot reference | Gold ~$2,400-2,500/oz region underpins ~$94 share; analysis anchored to prevailing spot |
| Margin leverage | AISC ~$1,350/oz fixed near-term — every +$200/oz of gold drops ~$1.1-1.3B to attributable EBITDA on ~6 Moz (high operating leverage) |
| +$200/oz sensitivity | ~+$1.1-1.3B EBITDA / ~+$0.80-1.00 EPS (est., pre-tax leverage net of royalties/taxes) |
| -$200/oz sensitivity | ~-$1.1-1.3B EBITDA; AISC margin compresses fastest at high-cost assets — non-linear downside |
| Macro drivers | Real rates (inverse), DXY (inverse), central-bank buying (structural bid), ETF flows, geopolitical haven demand |
| FCF inflection | At spot, FCF leverage is the swing factor for the dividend + buyback framework and the de-levering path |
Cost & execution (ESTIMATE/INFERENCE)
| Dimension | Assessment |
|---|---|
| AISC inflation | Labor, diesel, cyanide, grinding media, royalties; AISC creep (~$1,300→$1,450/oz) erodes the gold-price tailwind |
| Newcrest integration | ~$500M/yr targeted synergies (supply chain, full-potential, G&A) — realization is the execution swing; integration risk if synergies slip |
| Divestitures | Non-core asset sale program (smaller mines, exploration stakes) to fund de-levering and focus on Tier-1 — proceeds and timing uncertain |
| Jurisdiction risk | Operations span US, Australia, Canada, Peru, Ghana, PNG, Argentina; permitting, royalty/tax changes, strikes, community/ESG stoppages |
| Reserve replacement | Grade decline / reserve depletion requires sustaining capex + exploration to hold ~6 Moz — failure to replace is structural |
Industry Context — Gold & Precious Metals
This name sits in the Gold & Precious Metals as a supplier / gold miner (Newmont; largest producer, diversified across tier-1 jurisdictions, copper/by-product optionality). Price-taker on gold but LOWER beta: scale, diversification across many mines/jurisdictions, and by-product credits smooth AISC and dampen single-asset shocks. Captures the gold-price swing with less amplification than AU — less downside protection erosion in a crash, but also less torque in a bull. (INFERENCE) Its scenarios are not guessed in isolation — they inherit a single, shared view of the cluster's driver cycle, so the names that depend on the same event are mutually consistent.
Value chain: AU (supplier / gold miner (AngloGold Ashanti; African + Americas/Australia portfolio, higher jurisdiction risk)) · NEM (supplier / gold miner (Newmont; largest producer, diversified across tier-1 jurisdictions, copper/by-product optionality))
| Shared state | Capex path | House view | This name implies |
|---|---|---|---|
| Gold Crash | gold falls sharply (e.g. real rates rise / hard landing avoided / risk-on rotation out of bullion) | 22% | 20% |
| Cost / Operational Pressure | gold flat-to-firm but AISC inflation / mine-specific issues erode margin | 18% | 15% |
| Base — Elevated Gold | gold holds near current elevated levels; CB buying steady, real rates range-bound | 35% | 30% |
| Gold Bull / Fiat Hedge | gold breaks higher (sustained CB accumulation, fiat-debasement / monetary-disorder bid, falling real rates) | 25% | 35% |
On the cluster's key downside — Gold Crash (gold falls sharply (e.g. real rates rise / hard landing avoided / risk-on rotation out of bullion)) — this name implies 20% vs the cluster house view of 22% (in line with the house). The cluster's full cross-stock reconciliation governs that the names which ride the same capex cycle assign it comparable odds.
Structure: Gold Price Drivers — Gold is driven by (1) real interest rates — the dominant inverse driver, since gold yields nothing so falling/negative real rates lower its opportunity cost; (2) central-bank buying — structural EM-CB accumulation and reserve diversification away from USD; (3) the US dollar — gold is USD-priced, so a weaker DXY is a tailwind; (4) geopolitics / safe-haven and fiat-debasement demand. (FACT/INFERENCE) Cost Curve Aisc — Margin = gold price − AISC. AISC has inflated structurally (labour, energy, diesel, reagents, declining ore grades, deeper/harder mining) so the industry cost curve has shifted up; the marginal ounce now costs materially more than a decade ago. AISC inflation is the silent killer of the 'leverage to gold' thesis — if costs rise with the gold price, the margin expansion investors expect does not fully materialise. (FACT/INFERENCE) Low Multiples — Gold miners trade at persistently LOW multiples (EV/EBITDA, P/NAV) versus broad equities because: capital intensity and long, uncertain mine-build cycles; depleting reserves that must be continuously and expensively replaced; jurisdiction / political / nationalisation / permitting risk (acute for AU's African assets); a poor industry track record of capital allocation (value-destructive M&A, cost overruns, dilution); and no terminal-value compounding — an ounce mined is an ounce gone. The equity is a wasting, operationally-levered claim on a commodity it cannot control. (INFERENCE)
Model Appendix
DCF — line items
| Year | Revenue | Op income | − Capex | + D&A | FCF | PV(FCF) |
|---|---|---|---|---|---|---|
| FY+1 | $27B | $15B | $4B | $4B | $11B | $10B |
| FY+2 | $28B | $15B | $5B | $5B | $11B | $9B |
| FY+3 | $29B | $15B | $5B | $5B | $10B | $8B |
| FY+4 | $30B | $14B | $5B | $5B | $10B | $7B |
| FY+5 | $30B | $14B | $5B | $5B | $10B | $6B |
| Terminal | — | — | — | — | $10B × 11x | $65B |
FCF is bridged: NOPAT + D&A − Capex − ΔNWC (capex intensity 17% of revenue, weighted from the segments) — not a single conversion fudge.
WACC 10.0% · Σ PV(FCF) $39B + PV(terminal) $65B = EV $104B; + net cash → equity $107B ÷ diluted shares 1.09B = $97/share (exit-multiple terminal).
- Gordon (perpetuity-growth) terminal at 2.5% → $112/share — a genuinely non-multiple, cash-based cross-check; the exit-multiple and Gordon values bracket the terminal-value risk.
- Incremental ROIC on the forecast capex ≈ -4% vs WACC 10% → below WACC — the incremental build is value-dilutive.
Peer set
| Peer | EV/Rev | Fwd P/E | Growth | Op margin |
|---|---|---|---|---|
| GOLD | 3.0x | 15x | 5% | 25% |
| AEM | 4.5x | 20x | 8% | 28% |
| AU | 2.7x | 14x | 15% | 20% |
| KGC | 2.5x | 12x | 8% | 22% |
| Median | 2.85x | 14.5x | — | — |
Peer-median fwd P/E → $139; EV/Rev → $69.
Weighted fair-value math
| Anchor | Value | Weight | Contribution |
|---|---|---|---|
| DCF | $97 | 41% | $40 |
| Scenario PWEV | $105 | 29% | $31 |
| Monte Carlo median | $93 | 18% | $16 |
| Peer P/E | $139 | 12% | $16 |
| Triangulated | — | 100% | $104 |
Sensitivity
DCF/share — WACC × terminal multiple
| WACC \ Term× | 7.7x | 9.3x | 11.0x | 12.6x | 14.3x |
|---|---|---|---|---|---|
| 8% | $85 | $95 | $105 | $114 | $124 |
| 9% | $82 | $91 | $101 | $110 | $120 |
| 10% | $80 | $88 | $97 | $106 | $115 |
| 11% | $77 | $85 | $94 | $102 | $111 |
| 12% | $74 | $82 | $91 | $98 | $107 |
DCF/share — revenue CAGR Δ × op-margin Δ
| CAGRΔ \ MgnΔ | -3.0pp | -1.5pp | +0.0pp | +1.5pp | +3.0pp |
|---|---|---|---|---|---|
| -3.0pp | $83 | $86 | $89 | $92 | $94 |
| -1.5pp | $87 | $90 | $93 | $96 | $99 |
| +0.0pp | $91 | $94 | $97 | $100 | $104 |
| +1.5pp | $95 | $99 | $102 | $105 | $109 |
| +3.0pp | $100 | $103 | $107 | $110 | $114 |
Tornado — DCF/share swing by driver (widest first)
| Driver | Low | High | Swing |
|---|---|---|---|
| Terminal × ±15% | $88 | $106 | $18 |
| Revenue CAGR ±3pp | $89 | $107 | $18 |
| Op margin ±3pp | $91 | $104 | $12 |
| WACC ±1pp | $94 | $101 | $7 |
| FCF conversion ±10% | $97 | $97 | $0 |
Company lever — SoP/share vs Copper & by-products (optionality) multiple (AI re-rating) (base 6x)
| Multiple | 4.2x | 5.1x | 6.0x | 6.9x | 7.8x |
|---|---|---|---|---|---|
| SoP/share | $156 | $159 | $162 | $166 | $169 |
Load-Bearing Assumptions
DCF: WACC 10%, terminal multiple 11×, FY+5 revenue $30B. Triangulation leans 41% on DCF, 29% on PWEV.
Reasons the Thesis Could Fail (Falsifiable)
The valuation is multiple-dependent (83% of variance); a de-rating toward the DCF anchor ($97) implies +4%.
Fact / Inference / Speculation
- FACT: Spot $93; 52-week range $55–$134; engine rating BUY; base-case target $114 (+23%).
- INFERENCE: Triangulated FV $104 (+11%). P/E Multiple explains 83% of Monte Carlo outcome variance — i.e. value is set by the multiple the market will pay, a rate/sentiment regime bet as much as an earnings bet.
- SPECULATION: At current prices the embedded bet is that the multiple holds or expands — P/E Multiple carries 83% of outcome variance.
Recommendation: BUY
Constructive: rating BUY and the triangulated fair value ($104, +11%) agree on upside; the debate is P/E Multiple. The debate is P/E Multiple (83% of variance) — fundamentally a multiple/regime call. SBC runs —M TTM (disclosed in the appendix).