Rating: HOLD
| Metric | Value |
|---|---|
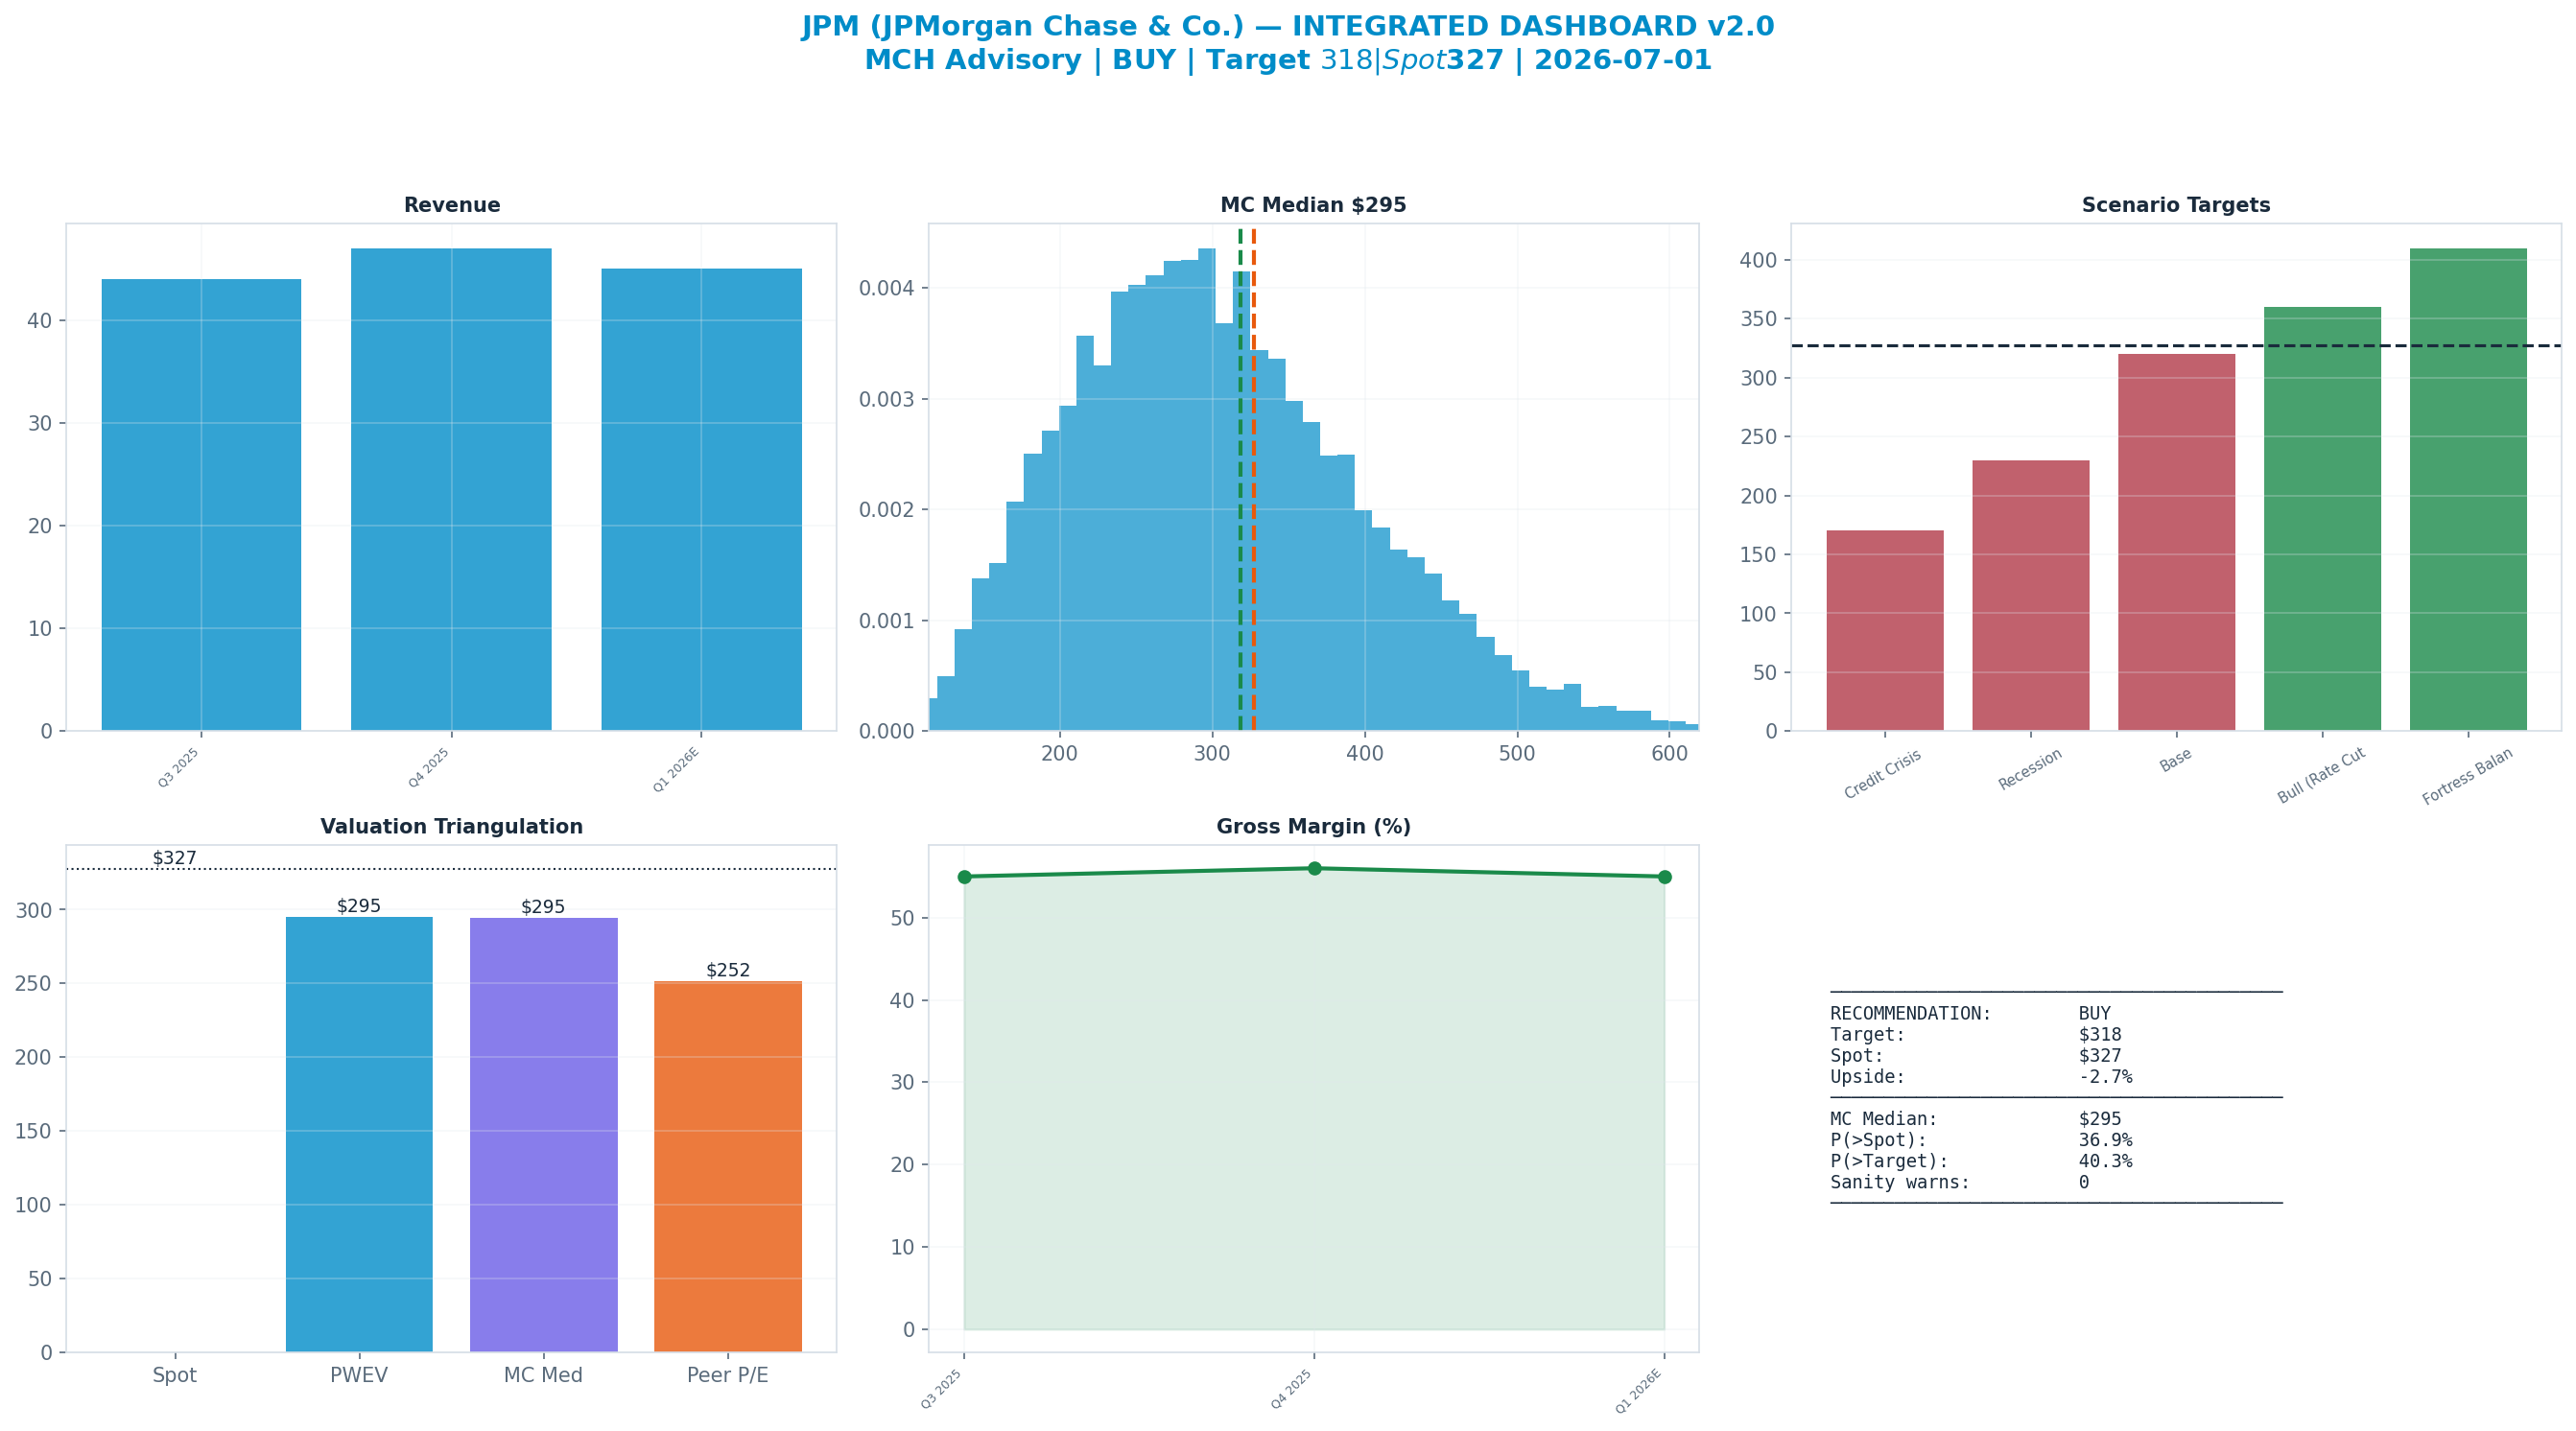
| Current Price | $327 |
| Triangulated Fair Value | $286 |
| 12-mo Scenario PWEV | $295 |
| Implied Return | -13% |
| Forward P/E | 15.0x |
| Market Cap | $877B |
| 52-Week Range | $276 – $338 |
Methodology: Valuation triangulated across five independent anchors — Monte Carlo (Student-t + regime switching), an independent DCF, peer re-rating, a sum-of-parts, and a scenario-weighted PWEV. Figures reconciled to mch_weekly_run live prices. Each chart below sits with the part of the thesis it evidences.
Investment Thesis
The bull case — 'Fortress Balance Premium' (10% weight) — targets $410, +25% vs spot. It needs the multiple to hold or expand.
The dashboard below is the whole argument on one page: spot ($327) against each valuation anchor, the scenario tree, technicals and the options-implied move.
Anti-Thesis (The Real Bear Case)
The structural case — 'Credit Crisis (Structural)' (15%) — targets $170, -48% vs spot. This sits below the 52-week low — a genuine structural impairment, not a mild pullback.
Key Debate
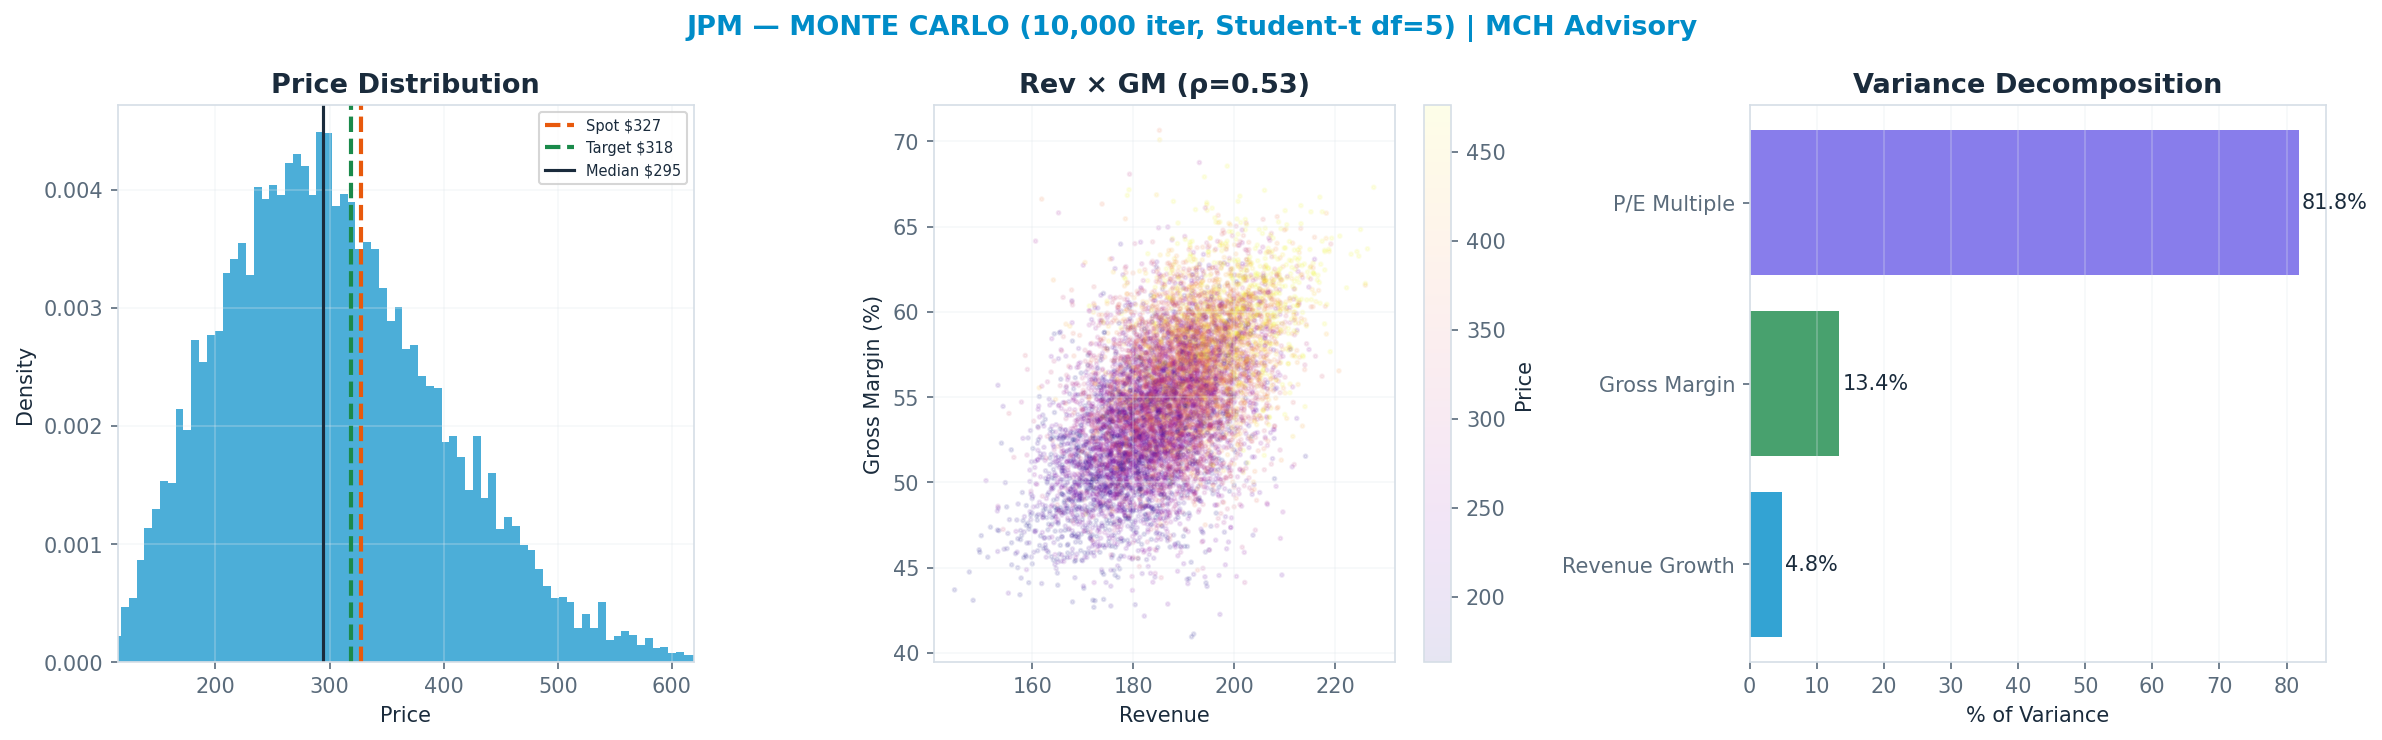
P/E Multiple explains 82% of Monte Carlo outcome variance — i.e. value is set by the multiple the market will pay, a rate/sentiment regime bet as much as an earnings bet.
Earnings-Call Disconfirmation & Sentiment
Derived signals from the MCH market-data store (Alpha Vantage transcripts + news). Quantitative tone only — a disconfirmation flag, not a substitute for reading the call.
Management vs analyst tone (2026Q1): management +0.20 vs analyst floor +0.19 → delta +0.02 (n=45 mgmt / 22 Q&A; 1th pctile across the S&P book, z -2.3).
Flag: CANDID — management unusually candid/cautious vs peers (relatively low spin).
| Quarter | Mgmt | Analyst | Delta |
|---|---|---|---|
| 2026Q1 | +0.20 | +0.19 | +0.02 |
| 2025Q4 | +0.18 | +0.03 | +0.15 |
| 2025Q3 | +0.47 | +0.29 | +0.18 |
| 2025Q2 | +0.31 | +0.28 | +0.03 |
News (last 365d, 1000 articles): avg ticker sentiment +0.13 (bullish 3% / bearish 0%)
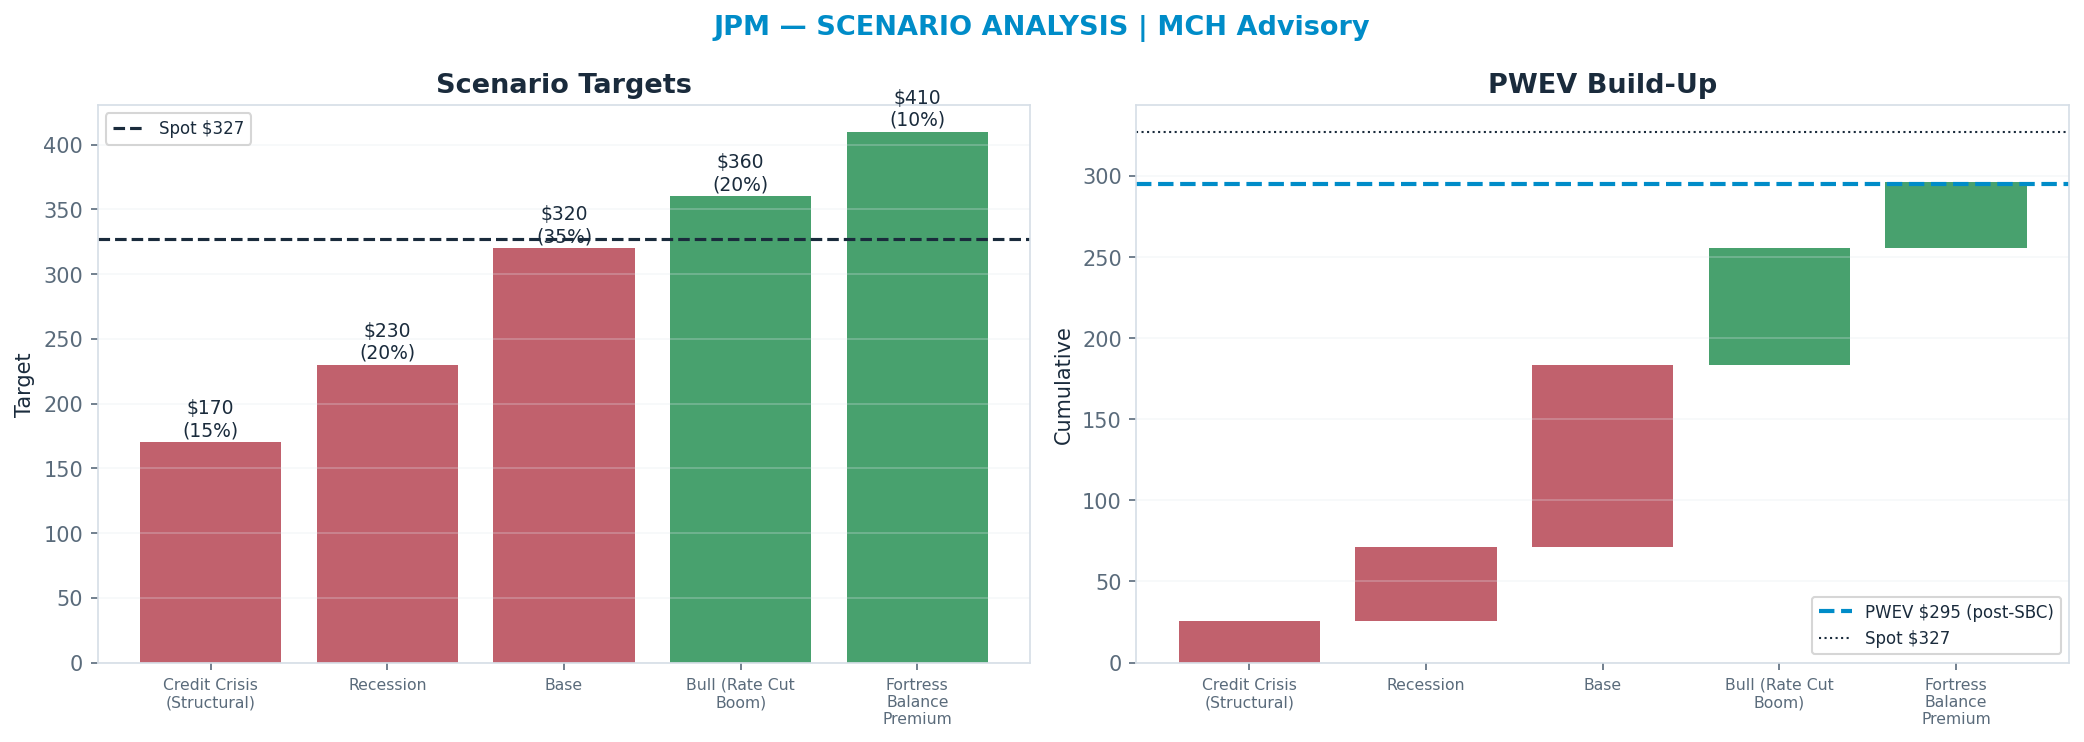
Scenario Analysis
The tree runs from a structural 'Credit Crisis (Structural)' downside ($170) to a 'Fortress Balance Premium' bull case ($410); the probability-weighted blend (PWEV $295) is -10% versus spot.
| Scenario | Probability | Target | Return |
|---|---|---|---|
| Credit Crisis (Structural) | 15% | $170 | -48% |
| Recession | 20% | $230 | -30% |
| Base | 35% | $320 | -2% |
| Bull (Rate Cut Boom) | 20% | $360 | +10% |
| Fortress Balance Premium | 10% | $410 | +25% |
| Probability-Weighted (PWEV, after SBC dilution) | — | $295 | -10% |
SBC charge: scenario targets are gross per-share prices; the PWEV is reduced by one year of stock-based-compensation dilution (0.5% of shares, on SBC ≈ 2% of revenue), trimming the gross PWEV of $296 to $295 (-0.5%). SBC is charged once, as dilution — never also deducted from FCF.
Scenario rationale — what each probability buys (the driver path behind every target):
- Credit Crisis (Structural) (15%, $170). A genuine credit cycle: card and wholesale NCOs spike, forcing a multi-quarter reserve build that drives a large GAAP earnings drawdown and possibly a quarter of net loss. ROTCE collapses toward high-single-digits and the stock de-rates to ~1.0-1.2x TBV as the fortress premium evaporates. The implied target sits below the 52-week low — a true structural impairment, not a pullback. Drivers — nco_ratio: spikes to ~5-6% on card; reserve_action: large build; rotce: ~8-10%; p_tbv: ~1.0-1.2x.
- Recession (20%, $230). A standard recession: NII softens as the Fed cuts and loan growth stalls, credit costs rise to a normalized-plus level with a moderate reserve build, and Markets/IB fees soften. ROTCE steps down to mid-teens and the multiple compresses to ~1.8-2.0x TBV / ~10x earnings. Drivers — nco_ratio: ~3.5-4%; nii: down mid-single-digits; rotce: ~14-15%; p_tbv: ~1.8-2.0x.
- Base (35%, $320). NII stabilizes near ~$90-95B as deposit costs reprice down roughly in line with asset yields, credit costs normalize gradually (card NCOs ~3.5%), and capital return continues via buyback + dividend. ROTCE holds in the high-teens and the stock sustains its premium ~2.5x TBV / ~12-13x earnings. Drivers — nco_ratio: ~3.5%; nii: ~flat to +low-single-digits; rotce: ~17-18%; p_tbv: ~2.5x.
- Bull (Rate Cut Boom) (20%, $360). A soft-landing 'good cuts' regime: the Fed eases without a recession, the curve steepens, deposit betas fall faster than asset yields so NII re-accelerates, and lower rates reignite M&A/ECM/DCM so IB and Markets fees inflect. Benign credit lets reserves release. ROTCE pushes ~20%+ and the multiple expands to ~3.0x TBV / ~14-15x. Drivers — nco_ratio: ~3%; nii: re-accelerates; ib_fees: rebound; rotce: ~20%+; p_tbv: ~3.0x.
- Fortress Balance Premium (10%, $410). JPM is rewarded for relative quality: in a stressed tape it takes share, deposits flow in (flight to safety), and its excess capital + reserve coverage let it keep returning capital while weaker peers retrench. Even on flat-to-soft NII, the market pays up for the durability — sustaining or expanding the premium to ~2.8-3.0x TBV despite a softer macro. Drivers — nco_ratio: ~3.5%; nii: ~flat; deposit_flows: share gains; rotce: ~17-19%; p_tbv: ~2.8-3.0x.
Valuation Triangulation
Five anchors — but read them with their basis in mind. The Monte Carlo, the DCF terminal, and the peer re-rate all key off a market multiple, so they are not fully independent; only the discounted cash flows themselves are genuinely multiple-free. The discipline is to read the spread and weight the cash-based view, not to treat five numbers as five independent votes.
| Method | Basis | Fair Value | vs Spot |
|---|---|---|---|
| Monte Carlo median (Student-t + regime) | multiple | $295 | -10% |
| Peer P/E re-rate | multiple | $252 | -23% |
| Peer EV/Revenue re-rate | multiple | $155 | -53% |
| Scenario PWEV | multiple | $295 | -10% |
| Triangulated (weighted) | — | $286 | -13% |
Monte Carlo — the distribution, not a point
10,000 paths, Student-t shocks (fat tails) with a regime-switching overlay. The median lands at $295 and 37% of paths finish above spot. The variance decomposition shows the p/e multiple is the dominant swing factor (82% of variance). Value is a multiple bet: fundamentals move the answer far less than the rating does.
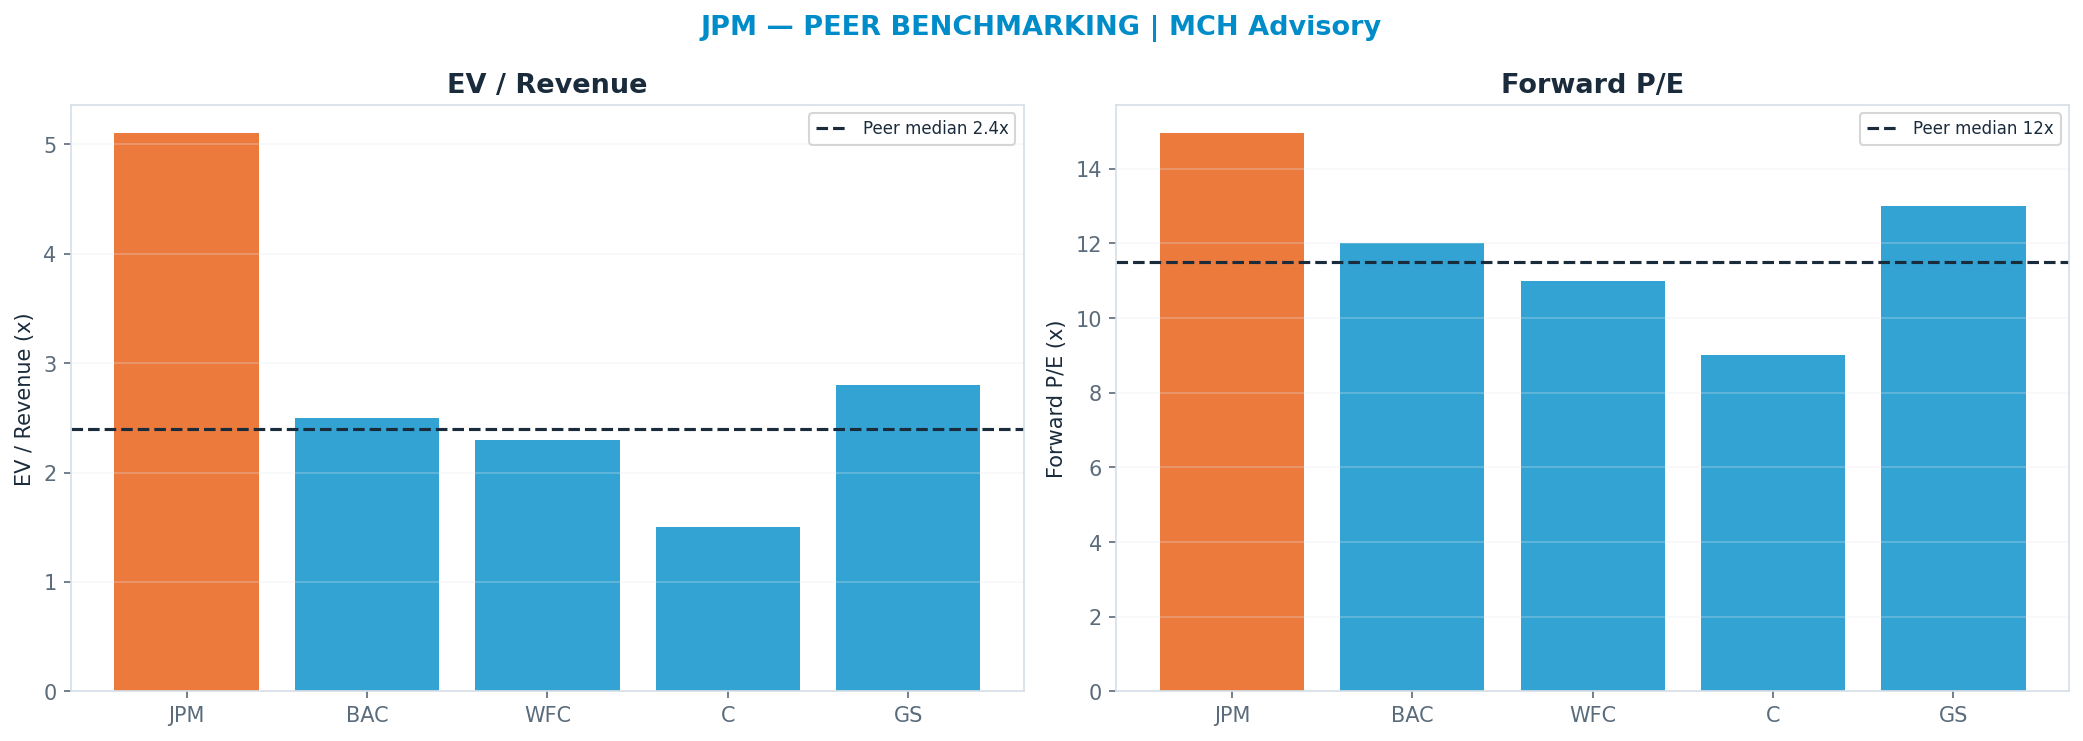
Peer benchmarking — relative value
Against the peer cohort, re-rating to the peer-median forward multiple (P/E 11.5x) implies $252. A premium is only justified by superior growth/margins; otherwise it is multiple risk. Weighted just 20% so the market's mood does not drive the fair value.
Across all anchors the spread is tight (the methods corroborate one another).
Revenue-Segment Breakdown
The company-specific drivers behind the valuation — each segment carries its own growth, margin, multiple and capex intensity. (Tags: FACT reported · ESTIMATE from disclosures · INFERENCE judgment.)
| Segment | Revenue | Mix | Growth | Op margin | Multiple | Capex % | Tag |
|---|---|---|---|---|---|---|---|
| Consumer & Community Banking (CCB) | $73B | 42% | 3% | 40% | 12x | 3% | FACT/ESTIMATE |
| Commercial & Investment Bank (CIB) | $70B | 40% | 5% | 42% | 12x | 2% | FACT/ESTIMATE |
| Asset & Wealth Management (AWM) | $23B | 13% | 8% | 35% | 16x | 2% | FACT/ESTIMATE |
| Corporate | $8B | 5% | 0% | 20% | 8x | 1% | FACT/INFERENCE |
Named Exposures
Net interest income & rates (ESTIMATE/INFERENCE)
| Dimension | Assessment |
|---|---|
| NII run-rate | ~$90-95B/yr (ex-Markets) — the single largest profit driver; rate-path and curve-shape dependent (est.) |
| Rate sensitivity | Asset-sensitive on the short end; a parallel decline in front-end rates compresses NII, but a steeper curve and reinvestment at higher yields can offset (INFERENCE) |
| Deposit beta | Cumulative deposit beta ~50-60% through the hiking cycle; the key swing factor is how fast deposit costs fall vs asset yields on the way down (est.) |
| Deposit mix | Migration from non-interest-bearing to interest-bearing deposits raises funding cost and pressures NIM (INFERENCE) |
| AI / efficiency offset | AI/automation is an EFFICIENCY and cost story, not a revenue line — targeted at the ~$100B+ expense base (fraud, ops, coding, servicing); supports the overhead ratio but is not separately monetized (INFERENCE) |
Credit & capital (ESTIMATE/INFERENCE)
| Dimension | Assessment |
|---|---|
| Allowance / reserves | ACL ~$25-27B; reserve build/release swings GAAP earnings sharply through the cycle independent of underlying revenue (est.) |
| Net charge-offs | Card NCOs the primary driver; normalizing toward ~3.5%+ on card; through-cycle NCO ratio the key credit variable (est.) |
| CET1 ratio | ~15% CET1 — well above the regulatory minimum + buffers; the cushion funds buybacks and absorbs stress (FACT/ESTIMATE) |
| Basel III endgame | Final capital rules less onerous than the 2023 proposal, but higher RWA/capital requirements still a structural headwind to ROE if reproposed harder (INFERENCE) |
| Fortress balance sheet premium | Excess capital + reserve coverage + funding diversity underpin a P/TBV premium (~2.5-3.0x TBV) vs peers; this premium compresses in a credit-stress regime (INFERENCE) |
Industry Context — US Banks
This name sits in the US Banks as a universal bank (CCB, CIB, AWM, Corporate). Earnings driven by NII (rates/curve), credit costs (cycle), and capital/regulation (Basel III endgame, CET1, buyback capacity); valued on P/TBV x ROE — a ~17-20% through-cycle ROE supports a premium ~2x+ TBV vs a sub-1.5x sector. Rate cuts compress NII near-term but can boost loan demand and lower credit costs; a recession lifts charge-offs and reserve builds, hitting EPS and TBV growth. Its scenarios are not guessed in isolation — they inherit a single, shared view of the cluster's driver cycle, so the names that depend on the same event are mutually consistent.
Value chain: JPM (universal bank (CCB, CIB, AWM, Corporate))
| Shared state | Capex path | House view | This name implies |
|---|---|---|---|
| Credit Crisis | deep recession + credit event; sharp reserve builds, surging NCOs, rate cuts to the zero-ish bound | 15% | 15% |
| Recession / NIM Compression | garden-variety recession; falling rates compress NIM, NCOs normalize higher, loan demand soft | 22% | 20% |
| Base | soft-ish growth, curve modestly upward, gradual cuts, NCOs near through-cycle normal | 38% | 35% |
| Soft Landing / Rate-Cut Boom | soft landing; curve re-steepens, loan growth and capital-markets/IB activity reaccelerate, benign credit | 25% | 30% |
On the cluster's key downside — Credit Crisis (deep recession + credit event; sharp reserve builds, surging NCOs, rate cuts to the zero-ish bound) — this name implies 15% vs the cluster house view of 15% (in line with the house). The cluster's full cross-stock reconciliation governs that the names which ride the same capex cycle assign it comparable odds.
Structure: Rate Nii Cycle — Net interest income is the largest earnings line for a money-center bank; it depends on the level of short rates (asset yields), the slope of the curve (funding/reinvestment), and deposit beta/mix. Higher-for-longer supports NII but raises deposit competition; aggressive cuts compress NII but can revive loan growth and capital-markets activity. (INFERENCE) Credit Cycle — Provisions are counter-cyclical and pro-volatile: reserve builds (CECL) front-load expected losses, and net charge-offs (cards, CRE, C&I) rise into a downturn. Through-cycle the swing in provisions is the single largest source of EPS variance for a bank. (FACT) Capital Regime — Basel III endgame and the SCB/CCAR stress-test regime set required CET1, which governs buyback and dividend capacity. A lighter-than-feared endgame frees capital for return and is a re-rating catalyst; a punitive calibration traps capital and caps ROE/EPS growth. (INFERENCE) Valuation Basis — Banks trade on P/TBV x normalized ROE rather than a forward-growth multiple. The earnings multiple typically sits ~10-14x trough-to-mid and the P/E compresses as estimates peak (a low P/E on peak NII is not cheap). A franchise earning a durable high-teens ROE warrants a premium to TBV; the broad sector clusters near book. The book-value anchor and the cyclicality of provisions are why ~12-16x is the normal range rather than a SaaS-style multiple. (FACT)
Load-Bearing Assumptions
No DCF anchor is meaningful for this asset; the blend leans 50% on probability-weighted scenarios and 30% on the Monte Carlo median — the scenario probabilities are the load-bearing inputs.
Reasons the Thesis Could Fail (Falsifiable)
The valuation is multiple-dependent (82% of variance); a de-rating toward the Monte-Carlo anchor ($295) implies -10%.
Fact / Inference / Speculation
- FACT: Spot $327; 52-week range $276–$338; engine rating HOLD; base-case target $318 (-3%).
- INFERENCE: Triangulated FV $286 (-13%). P/E Multiple explains 82% of Monte Carlo outcome variance — i.e. value is set by the multiple the market will pay, a rate/sentiment regime bet as much as an earnings bet.
- SPECULATION: At current prices the embedded bet is that the multiple holds or expands — P/E Multiple carries 82% of outcome variance.
Recommendation: HOLD
Balanced: triangulated fair value $286 (-13% vs spot); the outcome hinges on P/E Multiple. The debate is P/E Multiple (82% of variance) — fundamentally a multiple/regime call. SBC runs —M TTM (disclosed in the appendix).