Rating: HOLD
| Metric | Value |
|---|---|
| Current Price | $236 |
| Triangulated Fair Value | $200 |
| 12-mo Scenario PWEV | $233 |
| Implied Return | -15% |
| Forward P/E | 14.5x |
| Market Cap | $25B |
| 52-Week Range | $150 – $321 |
Methodology: Valuation triangulated across five independent anchors — Monte Carlo (Student-t + regime switching), an independent DCF, peer re-rating, a sum-of-parts, and a scenario-weighted PWEV. Figures reconciled to mch_weekly_run live prices. Each chart below sits with the part of the thesis it evidences.
Investment Thesis
The bull case — 'IRA Extended + AI Power' (10% weight) — targets $400, +70% vs spot. It needs the multiple to hold or expand.
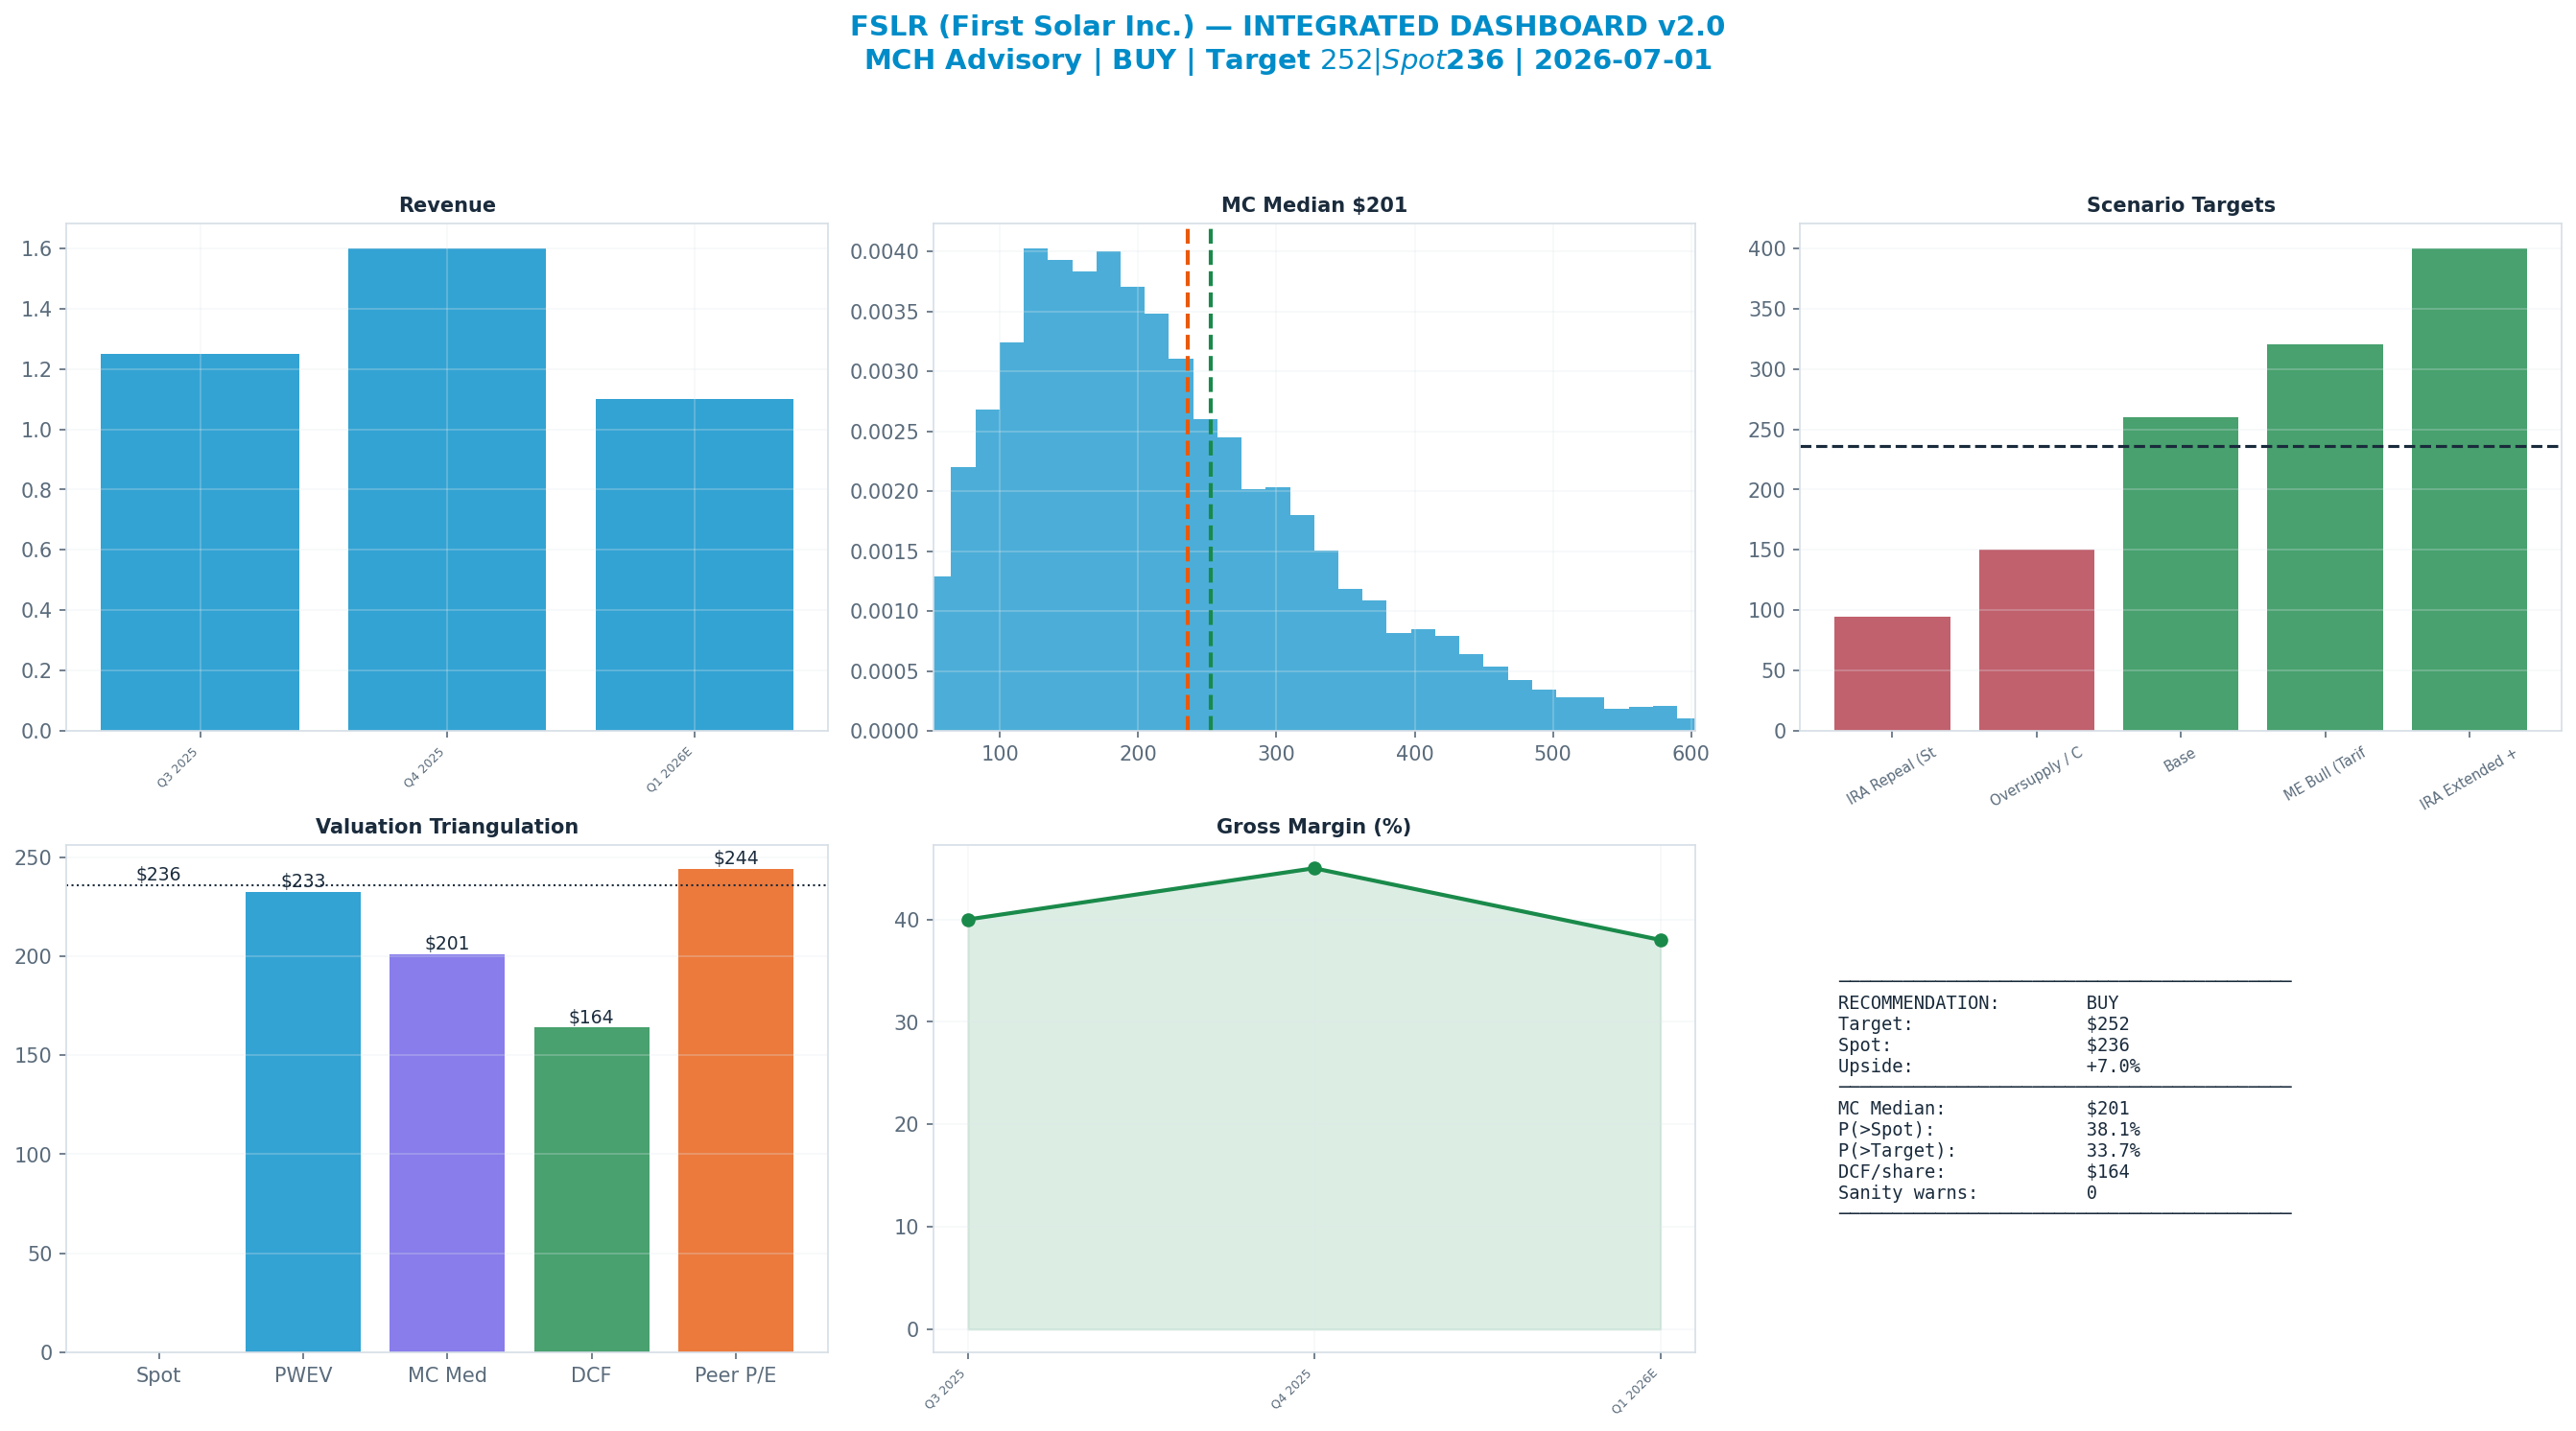
The dashboard below is the whole argument on one page: spot ($236) against each valuation anchor, the scenario tree, technicals and the options-implied move.
Anti-Thesis (The Real Bear Case)
The structural case — 'IRA Repeal (Structural)' (20%) — targets $95, -60% vs spot. This sits below the 52-week low — a genuine structural impairment, not a mild pullback.
Key Debate
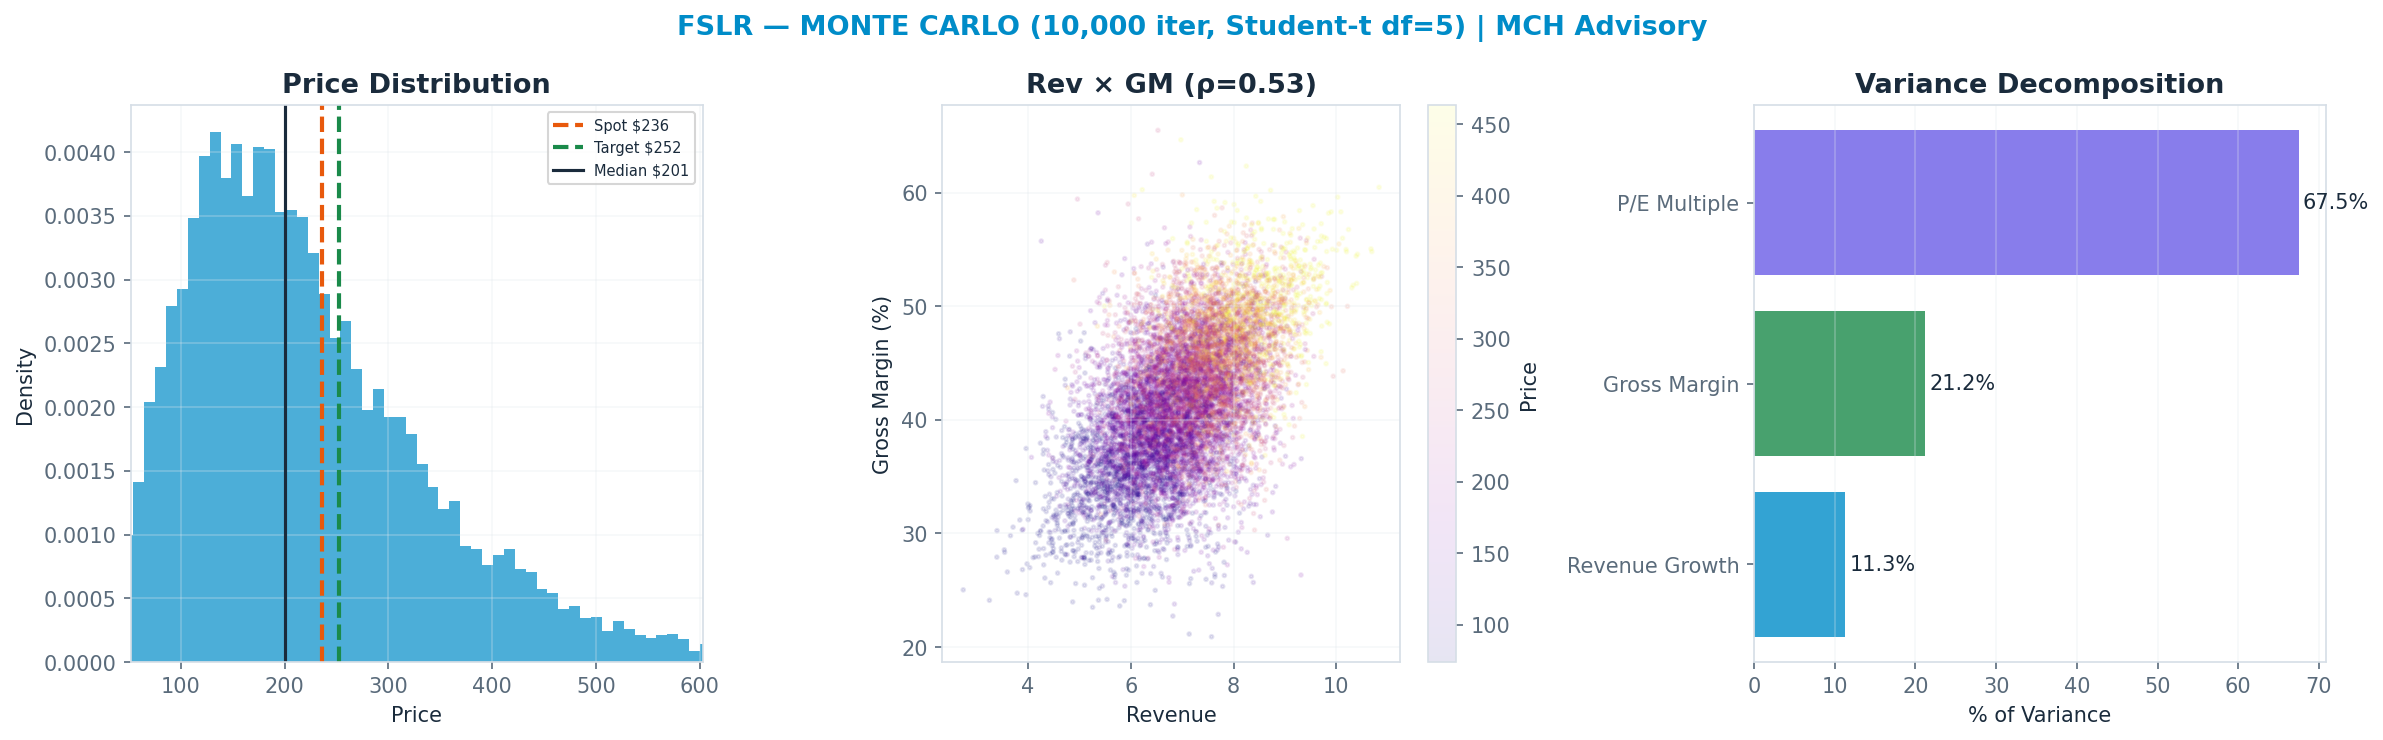
P/E Multiple explains 67% of Monte Carlo outcome variance — i.e. value is set by the multiple the market will pay, a rate/sentiment regime bet as much as an earnings bet.
Earnings-Call Disconfirmation & Sentiment
Derived signals from the MCH market-data store (Alpha Vantage transcripts + news). Quantitative tone only — a disconfirmation flag, not a substitute for reading the call.
Management vs analyst tone (2026Q1): management +0.28 vs analyst floor +0.00 → delta +0.28 (n=22 mgmt / 13 Q&A; 29th pctile across the S&P book, z -0.7).
Flag: TYPICAL — management-vs-analyst tone within the normal cross-sectional range.
| Quarter | Mgmt | Analyst | Delta |
|---|---|---|---|
| 2026Q1 | +0.28 | +0.00 | +0.28 |
| 2025Q4 | +0.41 | +0.20 | +0.21 |
| 2025Q3 | +0.36 | +0.00 | +0.36 |
| 2025Q2 | +0.49 | +0.25 | +0.24 |
News (last 365d, 1000 articles): avg ticker sentiment +0.10 (bullish 17% / bearish 9%)
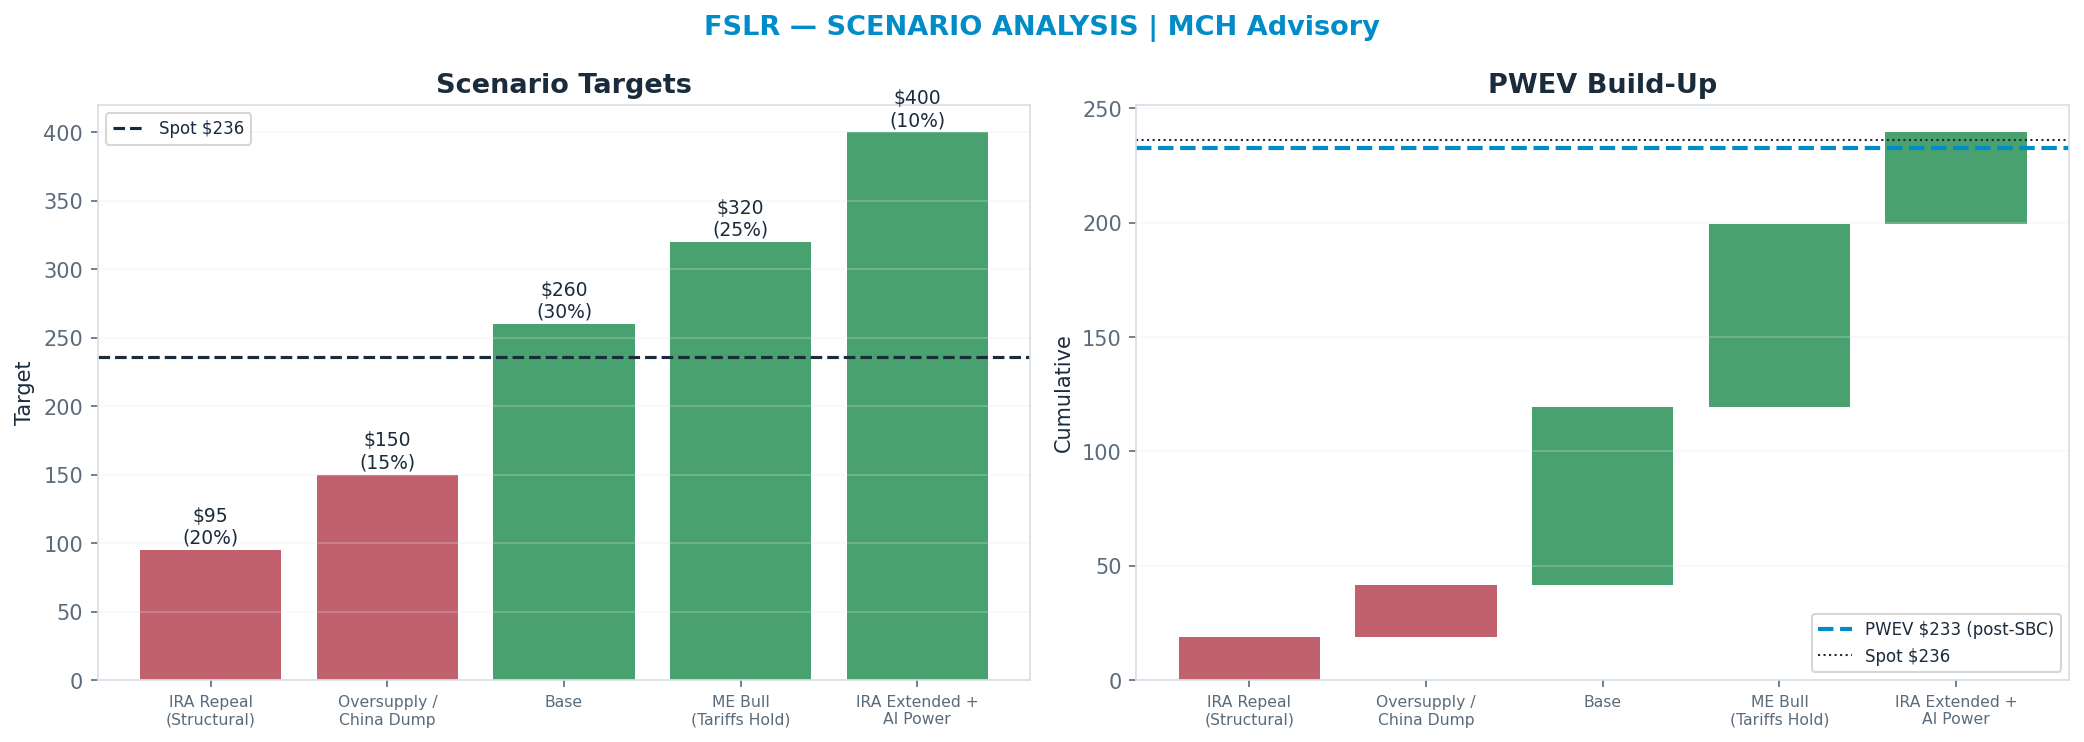
Scenario Analysis
The tree runs from a structural 'IRA Repeal (Structural)' downside ($95) to a 'IRA Extended + AI Power' bull case ($400); the probability-weighted blend (PWEV $233) is -1% versus spot.
| Scenario | Probability | Target | Return |
|---|---|---|---|
| IRA Repeal (Structural) | 20% | $95 | -60% |
| Oversupply / China Dump | 15% | $150 | -36% |
| Base | 30% | $260 | +10% |
| ME Bull (Tariffs Hold) | 25% | $320 | +36% |
| IRA Extended + AI Power | 10% | $400 | +70% |
| Probability-Weighted (PWEV, after SBC dilution) | — | $233 | -1% |
SBC charge: scenario targets are gross per-share prices; the PWEV is reduced by one year of stock-based-compensation dilution (3.0% of shares, on SBC ≈ 2% of revenue), trimming the gross PWEV of $240 to $233 (-2.9%). SBC is charged once, as dilution — never also deducted from FCF.
Scenario rationale — what each probability buys (the driver path behind every target):
- IRA Repeal (Structural) (20%, $95). Congress repeals or sharply accelerates the 45X phase-out, stripping
$0.17/W ($1.5B+/yr) from earnings; module gross margin ex-credit proves thin and volume cannot offset the lost subsidy. ASP also weakens as the domestic-content demand pull fades, and the multiple de-rates to a commodity-manufacturer ~4-5x. Target sits well below the 52-week low — a genuine structural impairment of the earnings base, not a cyclical dip. Drivers — 45x_credit: repealed / fast sunset; asp: ~$0.25/W (-); gw_shipped: flat; op_margin: ~8%; multiple: ~4x. - Oversupply / China Dump (15%, $150). Tariff walls weaken or circumvention floods the US with cheap crystalline-silicon modules; contracted ASP holds but new bookings reprice down and some backlog cancels. 45X survives but volume/ASP pressure caps margins, and the multiple stays depressed
6x pending pricing stabilization. *Drivers — 45x_credit: intact ($0.17/W); asp: ~$0.27/W (-); gw_shipped: ~14 GW; op_margin: ~15%; multiple: ~6x.* - Base (30%, $260). 45X stays intact at ~$0.17/W, US factories ramp to ~14-15 GW shipped, and contracted ASP holds ~$0.30+/W as backlog converts on schedule. Margins stay healthy on the credit-plus-volume mix and the multiple normalizes to ~9-10x as policy and pricing concerns ease. Drivers — 45x_credit: ~$0.17/W; asp: ~$0.30/W; gw_shipped: ~14-15 GW; op_margin: ~30%; multiple: ~9x.
- ME Bull (Tariffs Hold) (25%, $320). US tariffs and AD/CVD hold firm, insulating domestic ASP while global prices stay weak; FSLR sells out its US fleet at premium ASP with 45X fully captured. Volume reaches the upper end of guidance and margins expand on scale, supporting a ~12x multiple. Drivers — 45x_credit: ~$0.17/W; asp: ~$0.32/W (+); gw_shipped: ~16 GW; op_margin: ~34%; multiple: ~12x.
- IRA Extended + AI Power (10%, $400). 45X is extended/expanded beyond its scheduled sunset and AI-datacenter electricity demand pulls forward a wave of utility-scale solar PPAs, tightening US module supply and lifting ASP. FSLR books multi-year capacity at premium pricing with the credit secured, and the multiple re-rates to
15x on durable, policy-backed growth. *Drivers — 45x_credit: extended ($0.17/W+); asp: ~$0.34/W (+); gw_shipped: ~18 GW; op_margin: ~36%; multiple: ~15x.*
Valuation Triangulation
Five anchors — but read them with their basis in mind. The Monte Carlo, the DCF terminal, and the peer re-rate all key off a market multiple, so they are not fully independent; only the discounted cash flows themselves are genuinely multiple-free. The discipline is to read the spread and weight the cash-based view, not to treat five numbers as five independent votes.
| Method | Basis | Fair Value | vs Spot |
|---|---|---|---|
| Monte Carlo median (Student-t + regime) | multiple | $201 | -15% |
| Peer P/E re-rate | multiple | $244 | +3% |
| Peer EV/Revenue re-rate | multiple | $112 | -53% |
| Scenario PWEV | multiple | $233 | -1% |
| DCF (5-year + terminal) | cash flow + terminal × | $164 | -31% |
| Triangulated (weighted) | — | $200 | -15% |
Rating vs blend — the key debate. The rating tracks the multiple-discipline fair value (Monte Carlo $201 + scenario PWEV $233, ≈ spot); the weighted blend $200 (-15%) sits below it because the cash-flow DCF ($164) is materially more conservative than the market multiple. Whether the current multiple is justified is the central question for this name — and the principal downside risk to the rating.
Monte Carlo — the distribution, not a point
10,000 paths, Student-t shocks (fat tails) with a regime-switching overlay. The median lands at $201 and 38% of paths finish above spot. The variance decomposition shows the p/e multiple is the dominant swing factor (67% of variance). Value is a multiple bet: fundamentals move the answer far less than the rating does.
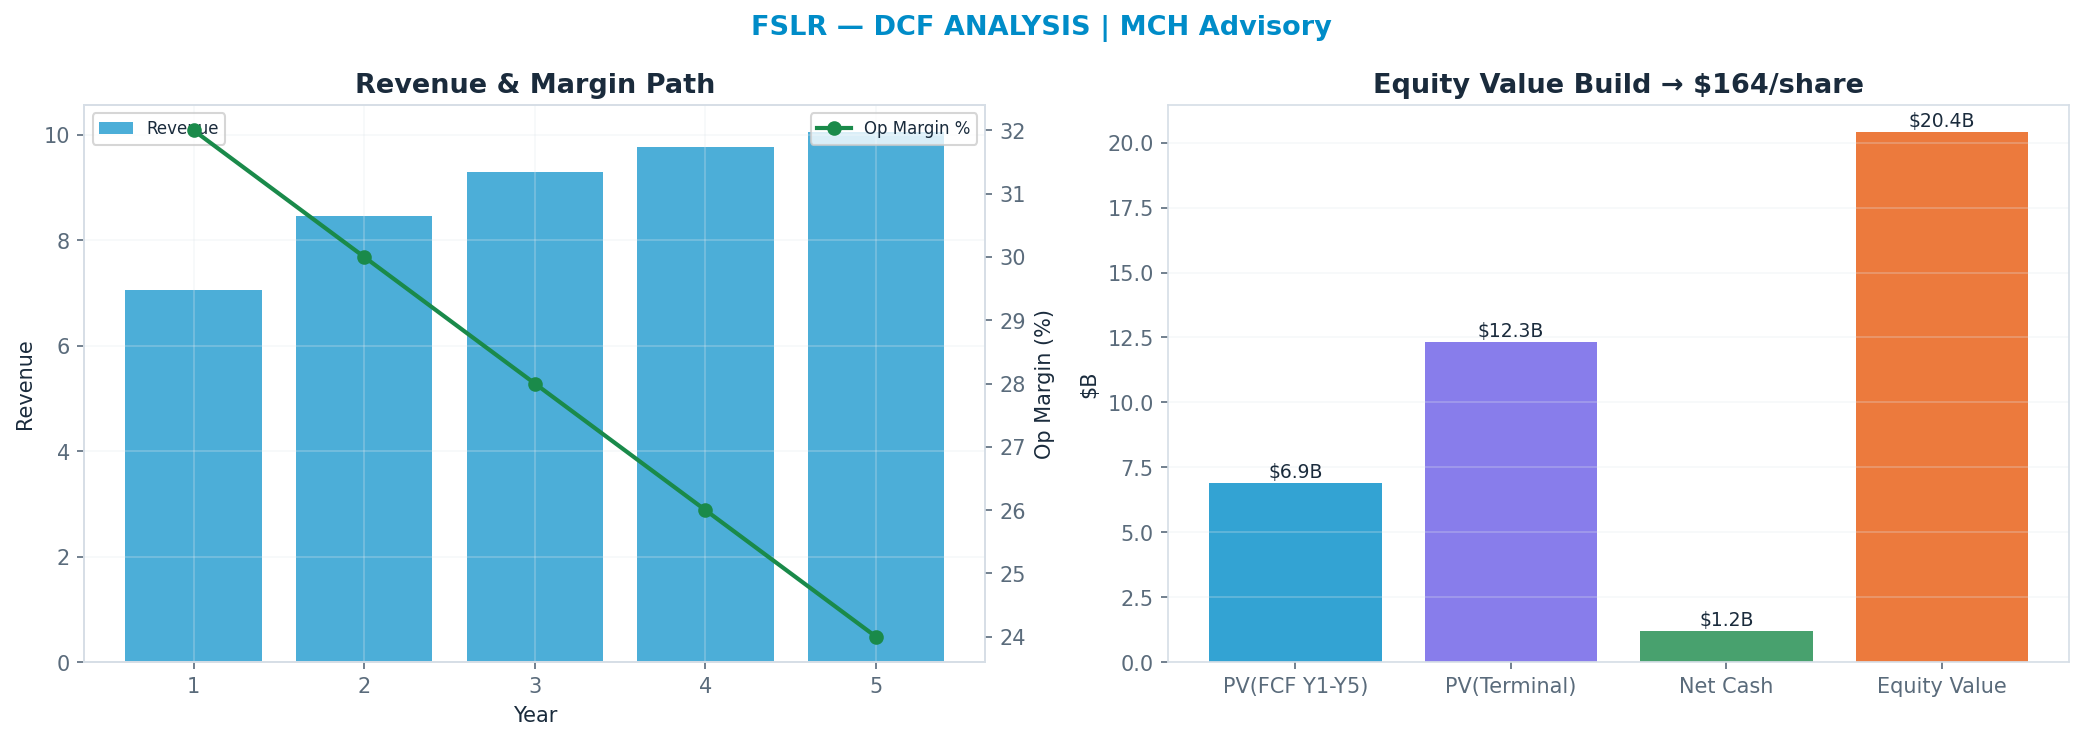
DCF — the cash-flow anchor
Independent of the market multiple: a 5-year path, WACC 12.0%, 12x terminal FCF multiple → $164. This anchor is deliberately the heaviest (41%): it is the valuation least hostage to the current multiple regime.
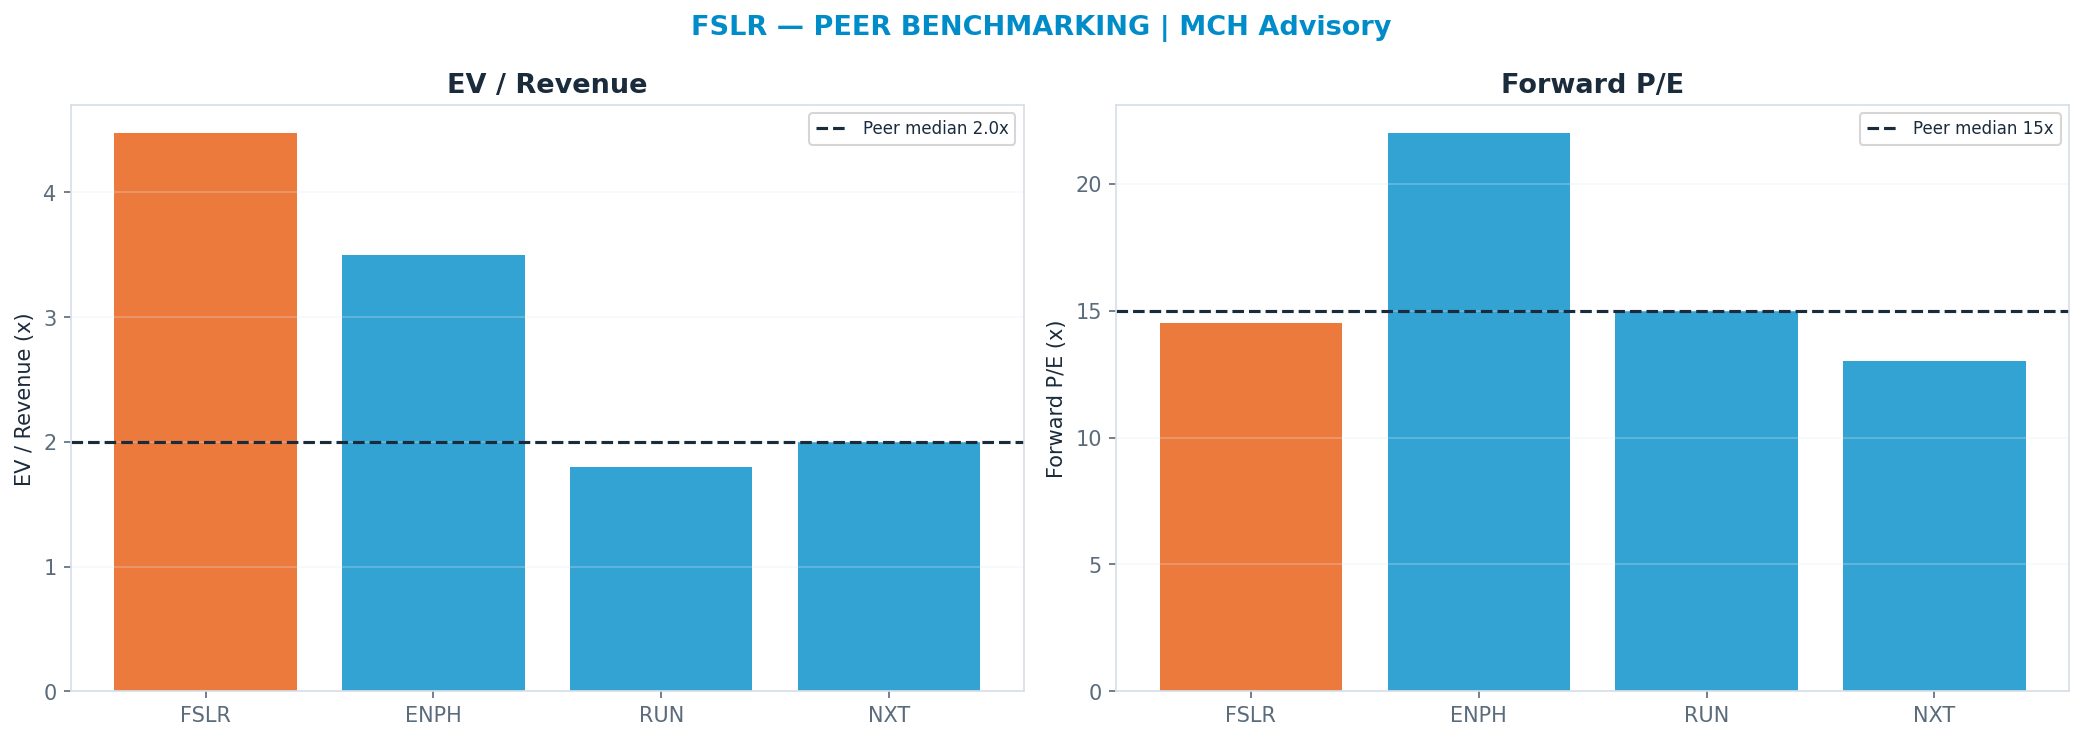
Peer benchmarking — relative value
Against the peer cohort, re-rating to the peer-median forward multiple (P/E 15.0x) implies $244. A premium is only justified by superior growth/margins; otherwise it is multiple risk. Weighted just 12% so the market's mood does not drive the fair value.
Across all anchors the spread is tight (the methods corroborate one another).
Revenue-Segment Breakdown
The company-specific drivers behind the valuation — each segment carries its own growth, margin, multiple and capex intensity. (Tags: FACT reported · ESTIMATE from disclosures · INFERENCE judgment.)
| Segment | Revenue | Mix | Growth | Op margin | Multiple | Capex % | Tag |
|---|---|---|---|---|---|---|---|
| Module Sales (Core) | $4.4B | 73% | 14% | 18% | 8x | 25% | FACT/ESTIMATE |
| 45X IRA Production Tax Credit | $1.6B | 27% | 20% | 90% | 4x | 0% | FACT/ESTIMATE |
| Contracted Backlog (Visibility) | $0.0B | 0% | 0% | 0% | 0x | 0% | FACT/INFERENCE |
Named Exposures
Policy / IRA 45X (FACT/ESTIMATE/INFERENCE)
| Dimension | Assessment |
|---|---|
| 45X credit rate | ~$0.17/W on a fully-integrated US-made module (wafer/cell/module stack); a structural earnings subsidy |
| Earnings dependence | 45X credits ~$1.5-1.7B/yr (est.) — a majority of operating profit; module gross margin ex-credit is materially thinner |
| Repeal / phase-out risk | 45X scheduled to phase down later in the decade; legislative repeal or accelerated sunset is the dominant tail risk to the earnings base |
| Domestic-content | US manufacturing footprint qualifies projects for the ITC domestic-content adder — a demand pull that supports ASP and bookings |
| Foreign-entity-of-concern | FEOC / sourcing rules can advantage FSLR's US-made, China-free supply chain vs. crystalline-silicon imports |
Backlog & AI-Power Demand (FACT/ESTIMATE/INFERENCE)
| Dimension | Assessment |
|---|---|
| Contracted backlog | ~60-65 GW contracted (multi-year), ~4-5 years of production visibility at current run-rate |
| ASP trend | Contracted ASP ~$0.30+/W ex-credit; recent bookings softer as global module prices fall — watch new-booking ASP, not just backlog ASP |
| AI / datacenter power pull | US AI-datacenter electricity demand is a structural tailwind for utility-scale solar PPAs and behind-the-meter generation — supports US demand and ASP durability (INFERENCE; not direct FSLR revenue) |
| China oversupply risk | Global crystalline-silicon oversupply has crushed ex-US module pricing; FSLR is insulated by US tariffs/AD-CVD and 45X but not immune to import-driven ASP pressure |
| Tariff dependence | Bull case leans on US tariffs (AD/CVD, Section 201/301) holding; tariff relief or circumvention would compress US ASP toward global levels |
Industry Context — Solar / Clean Energy
This name sits in the Solar / Clean Energy as a US thin-film (CdTe) module maker. Earnings = IRA 45X production credit ($/W, booked as it ships US-made modules) + module ASP and shipped volume (GW) against a multi-year contracted backlog; bull if 45X holds, China oversupply stays out of the US via tariffs/FEOC, and AI-datacenter power demand lifts PPA pricing and bookings; bear if 45X is repealed/clawed back or global oversupply compresses ASPs into the US market. Its scenarios are not guessed in isolation — they inherit a single, shared view of the cluster's driver cycle, so the names that depend on the same event are mutually consistent.
Value chain: FSLR (US thin-film (CdTe) module maker)
| Shared state | Capex path | House view | This name implies |
|---|---|---|---|
| Policy Repeal / Oversupply | 45X repealed or clawed back; tariff/FEOC wall breached; Chinese oversupply floods US | 25% | 20% |
| Margin Pressure | 45X holds but global oversupply leaks in; ASPs and bookings soften | 18% | 15% |
| Base — IRA Holds | 45X intact; tariffs/FEOC enforced; demand steady | 35% | 30% |
| AI-Power Demand Boom | 45X intact AND AI-datacenter load drives a US solar PPA bull market | 22% | 35% |
On the cluster's key downside — Policy Repeal / Oversupply (45X repealed or clawed back; tariff/FEOC wall breached; Chinese oversupply floods US) — this name implies 20% vs the cluster house view of 25% (in line with the house). The cluster's full cross-stock reconciliation governs that the names which ride the same capex cycle assign it comparable odds.
Structure: Policy Regime — US policy is the load-bearing variable: the IRA 45X advanced-manufacturing production credit underwrites a large share of FSLR's per-watt economics; AD-CVD and Section 201 tariffs plus FEOC/domestic-content rules wall off the US market from Chinese supply. Durability of all three is a political/legal question, not a fundamental one. (INFERENCE) Supply Demand — Global PV is structurally oversupplied — Chinese nameplate capacity runs well ahead of demand, so ex-US module ASPs have collapsed toward cash cost. FSLR's CdTe + US-made + tariff-protected position partially insulates it, but the oversupply is the gravitational pull on pricing. (FACT) Asp Trend — Module ASPs globally are in secular decline on Chinese oversupply; FSLR's realized ASP is propped up by long-dated US contracts and the domestic-content premium, but contract repricing, defaults, and termination risk grow if the spot/US gap widens. (ESTIMATE) Ai Power Demand — AI-datacenter electricity demand is the new structural demand pull — hyperscaler load growth is lifting US utility-scale solar PPA volumes and pricing because solar+storage is the fastest incremental capacity to interconnect. This is the bull's non-policy leg. (INFERENCE)
Model Appendix
DCF — line items
| Year | Revenue | Op income | − Capex | + D&A | FCF | PV(FCF) |
|---|---|---|---|---|---|---|
| FY+1 | $7B | $2B | $1B | $1B | $2B | $2B |
| FY+2 | $8B | $3B | $2B | $1B | $2B | $2B |
| FY+3 | $9B | $3B | $2B | $1B | $2B | $1B |
| FY+4 | $10B | $3B | $2B | $1B | $2B | $1B |
| FY+5 | $10B | $2B | $2B | $2B | $2B | $1B |
| Terminal | — | — | — | — | $2B × 12x | $12B |
FCF is bridged: NOPAT + D&A − Capex − ΔNWC (capex intensity 18% of revenue, weighted from the segments) — not a single conversion fudge.
WACC 12.0% · Σ PV(FCF) $7B + PV(terminal) $12B = EV $19B; + net cash → equity $20B ÷ diluted shares 0.12B = $164/share (exit-multiple terminal).
- Gordon (perpetuity-growth) terminal at 2.5% → $154/share — a genuinely non-multiple, cash-based cross-check; the exit-multiple and Gordon values bracket the terminal-value risk.
- Incremental ROIC on the forecast capex ≈ 2% vs WACC 12% → below WACC — the incremental build is value-dilutive.
Peer set
| Peer | EV/Rev | Fwd P/E | Growth | Op margin |
|---|---|---|---|---|
| ENPH | 3.5x | 22x | 12% | 22% |
| RUN | 1.8x | 15x | 8% | 8% |
| NXT | 2.0x | 13x | 18% | 14% |
| Median | 2.0x | 15.0x | — | — |
Peer-median fwd P/E → $244; EV/Rev → $112.
Weighted fair-value math
| Anchor | Value | Weight | Contribution |
|---|---|---|---|
| DCF | $164 | 41% | $68 |
| Scenario PWEV | $233 | 29% | $68 |
| Monte Carlo median | $201 | 18% | $35 |
| Peer P/E | $244 | 12% | $29 |
| Triangulated | — | 100% | $200 |
Sensitivity
DCF/share — WACC × terminal multiple
| WACC \ Term× | 8.4x | 10.2x | 12.0x | 13.8x | 15.6x |
|---|---|---|---|---|---|
| 10% | $144 | $160 | $176 | $192 | $209 |
| 11% | $139 | $154 | $170 | $185 | $201 |
| 12% | $134 | $149 | $164 | $179 | $194 |
| 13% | $130 | $144 | $158 | $173 | $187 |
| 14% | $126 | $139 | $153 | $167 | $180 |
DCF/share — revenue CAGR Δ × op-margin Δ
| CAGRΔ \ MgnΔ | -3.0pp | -1.5pp | +0.0pp | +1.5pp | +3.0pp |
|---|---|---|---|---|---|
| -3.0pp | $135 | $145 | $154 | $163 | $172 |
| -1.5pp | $139 | $149 | $159 | $169 | $178 |
| +0.0pp | $143 | $154 | $164 | $174 | $185 |
| +1.5pp | $147 | $158 | $169 | $180 | $191 |
| +3.0pp | $152 | $163 | $175 | $187 | $198 |
Tornado — DCF/share swing by driver (widest first)
| Driver | Low | High | Swing |
|---|---|---|---|
| Op margin ±3pp | $143 | $185 | $41 |
| Terminal × ±15% | $149 | $179 | $30 |
| Revenue CAGR ±3pp | $154 | $175 | $21 |
| WACC ±1pp | $158 | $170 | $12 |
| FCF conversion ±10% | $164 | $164 | $0 |
Company lever — SoP/share vs Module Sales (Core) multiple (AI re-rating) (base 8x)
| Multiple | 5.6x | 6.8x | 8.0x | 9.2x | 10.4x |
|---|---|---|---|---|---|
| SoP/share | $300 | $349 | $398 | $447 | $496 |
Load-Bearing Assumptions
DCF: WACC 12%, terminal multiple 12×, FY+5 revenue $10B. Triangulation leans 41% on DCF, 29% on PWEV.
Reasons the Thesis Could Fail (Falsifiable)
The valuation is multiple-dependent (67% of variance); a de-rating toward the DCF anchor ($164) implies -31%.
Fact / Inference / Speculation
- FACT: Spot $236; 52-week range $150–$321; engine rating HOLD; base-case target $252 (+7%).
- INFERENCE: Triangulated FV $200 (-15%). P/E Multiple explains 67% of Monte Carlo outcome variance — i.e. value is set by the multiple the market will pay, a rate/sentiment regime bet as much as an earnings bet.
- SPECULATION: At current prices the embedded bet is that the multiple holds or expands — P/E Multiple carries 67% of outcome variance.
Recommendation: HOLD
Balanced: triangulated fair value $200 (-15% vs spot); the outcome hinges on P/E Multiple. The debate is P/E Multiple (67% of variance) — fundamentally a multiple/regime call. SBC runs 65M TTM (disclosed in the appendix).