Rating: HOLD
| Metric | Value |
|---|---|
| Current Price | $188 |
| Triangulated Fair Value | $144 |
| 12-mo Scenario PWEV | $180 |
| Implied Return | -24% |
| Forward P/E | 30.3x |
| Market Cap | $22B |
| 52-Week Range | $94 – $202 |
Methodology: Valuation triangulated across five independent anchors — Monte Carlo (Student-t + regime switching), an independent DCF, peer re-rating, a sum-of-parts, and a scenario-weighted PWEV. Figures reconciled to Alpha Vantage 2026-06-27. Each chart below sits with the part of the thesis it evidences.
Investment Thesis
The bull case — 'Bull — Re-Rate' (8% weight) — targets $319, +69% vs spot. It needs Gross Margin to surprise to the upside.
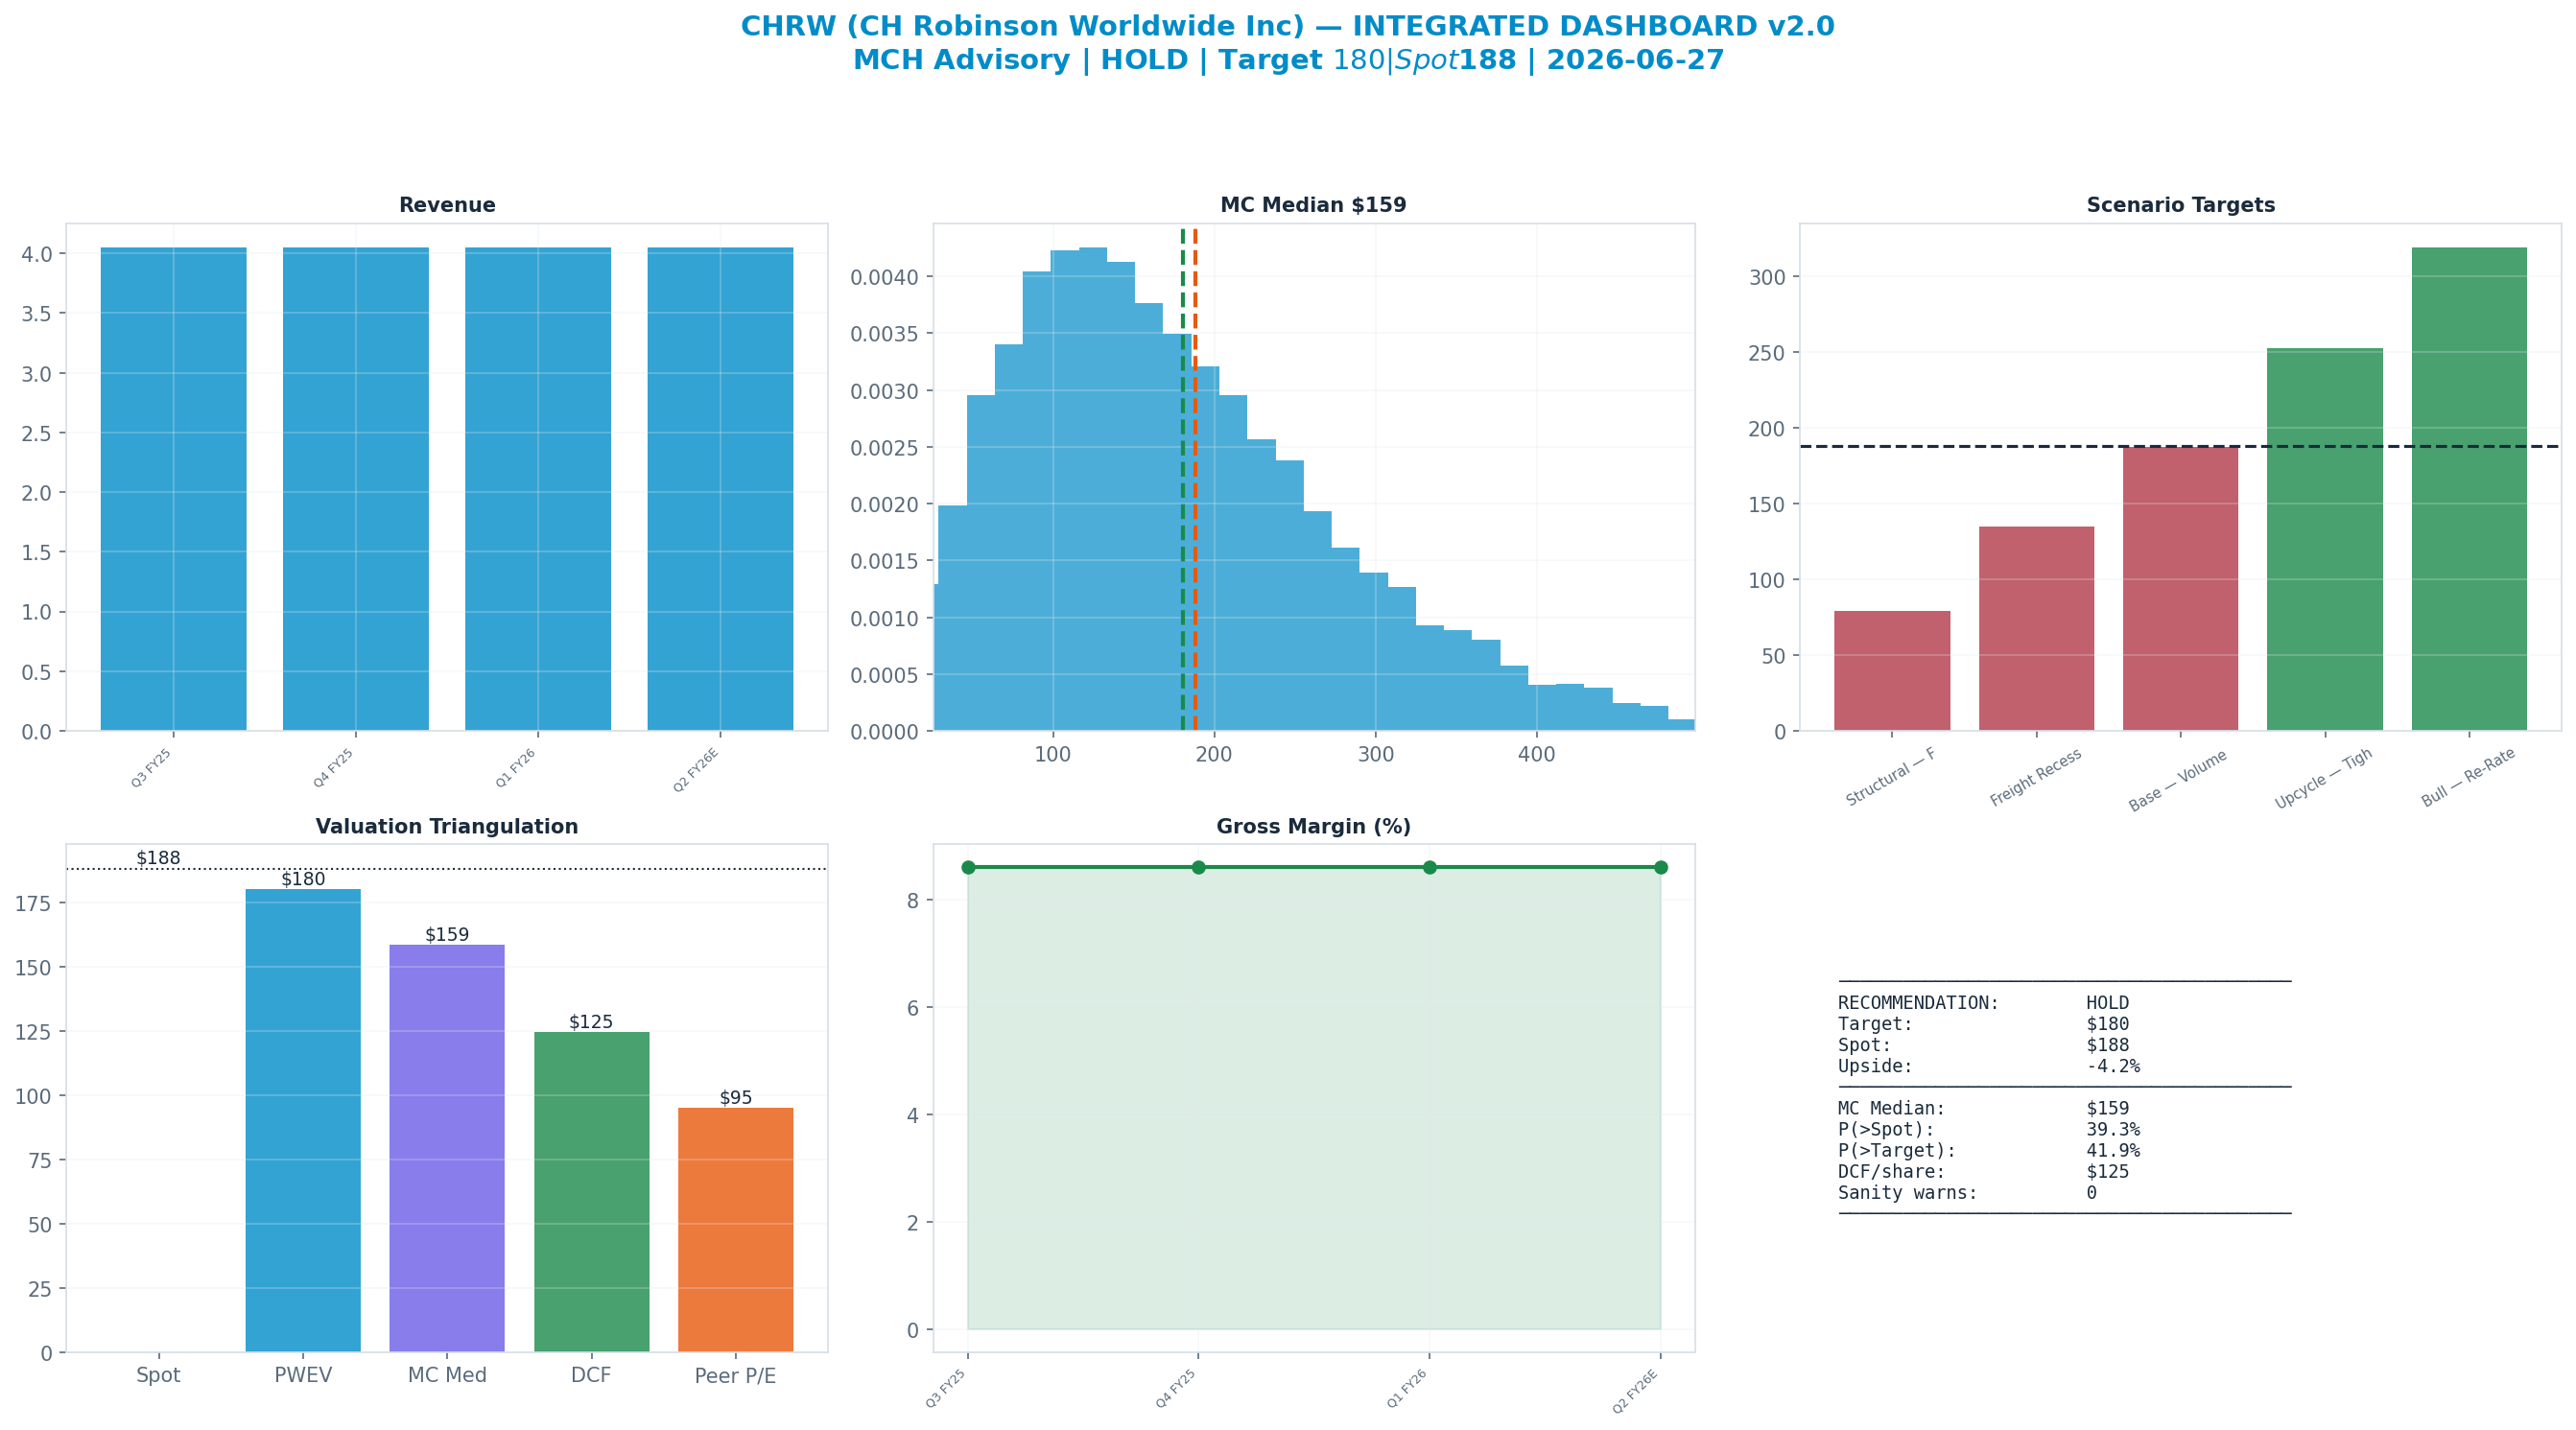
The dashboard below is the whole argument on one page: spot ($188) against each valuation anchor, the scenario tree, technicals and the options-implied move.
Anti-Thesis (The Real Bear Case)
The structural case — 'Structural — Freight-Margin Reset / Disintermediation' (20%) — targets $79, -58% vs spot. This sits below the 52-week low — a genuine structural impairment, not a mild pullback.
Key Debate
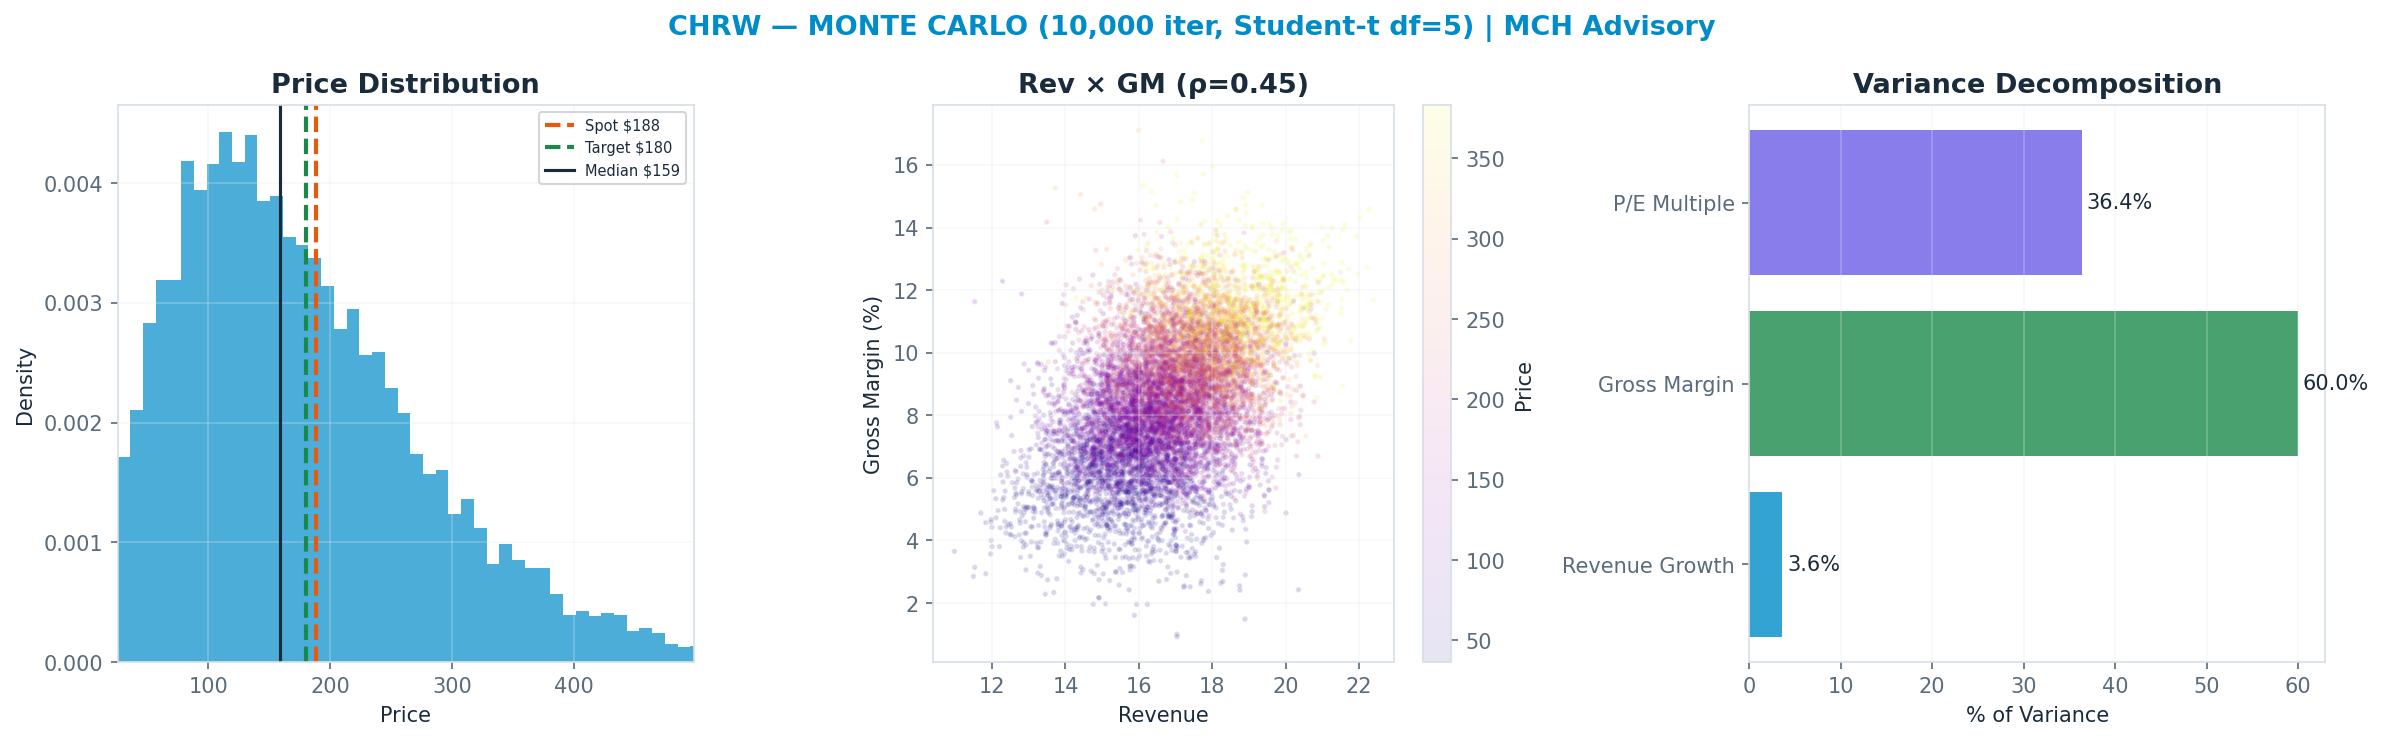
Gross Margin explains 60% of Monte Carlo outcome variance — the single variable that decides which side is right.
Earnings-Call Disconfirmation & Sentiment
Derived signals from the MCH market-data store (Alpha Vantage transcripts + news). Quantitative tone only — a disconfirmation flag, not a substitute for reading the call.
Management vs analyst tone (2026Q1): management +0.68 vs analyst floor +0.10 → delta +0.58 (n=22 mgmt / 9 Q&A; 85th pctile across the S&P book, z +1.1).
Flag: ELEVATED — management unusually upbeat vs the analyst floor relative to peers (disconfirmation watch).
| Quarter | Mgmt | Analyst | Delta |
|---|---|---|---|
| 2026Q1 | +0.68 | +0.10 | +0.58 |
| 2025Q4 | +0.53 | +0.22 | +0.32 |
| 2025Q3 | +0.52 | +0.42 | +0.10 |
| 2025Q2 | +0.60 | +0.31 | +0.28 |
News (last 365d, 1000 articles): avg ticker sentiment +0.16 (bullish 24% / bearish 5%)
Scenario Analysis
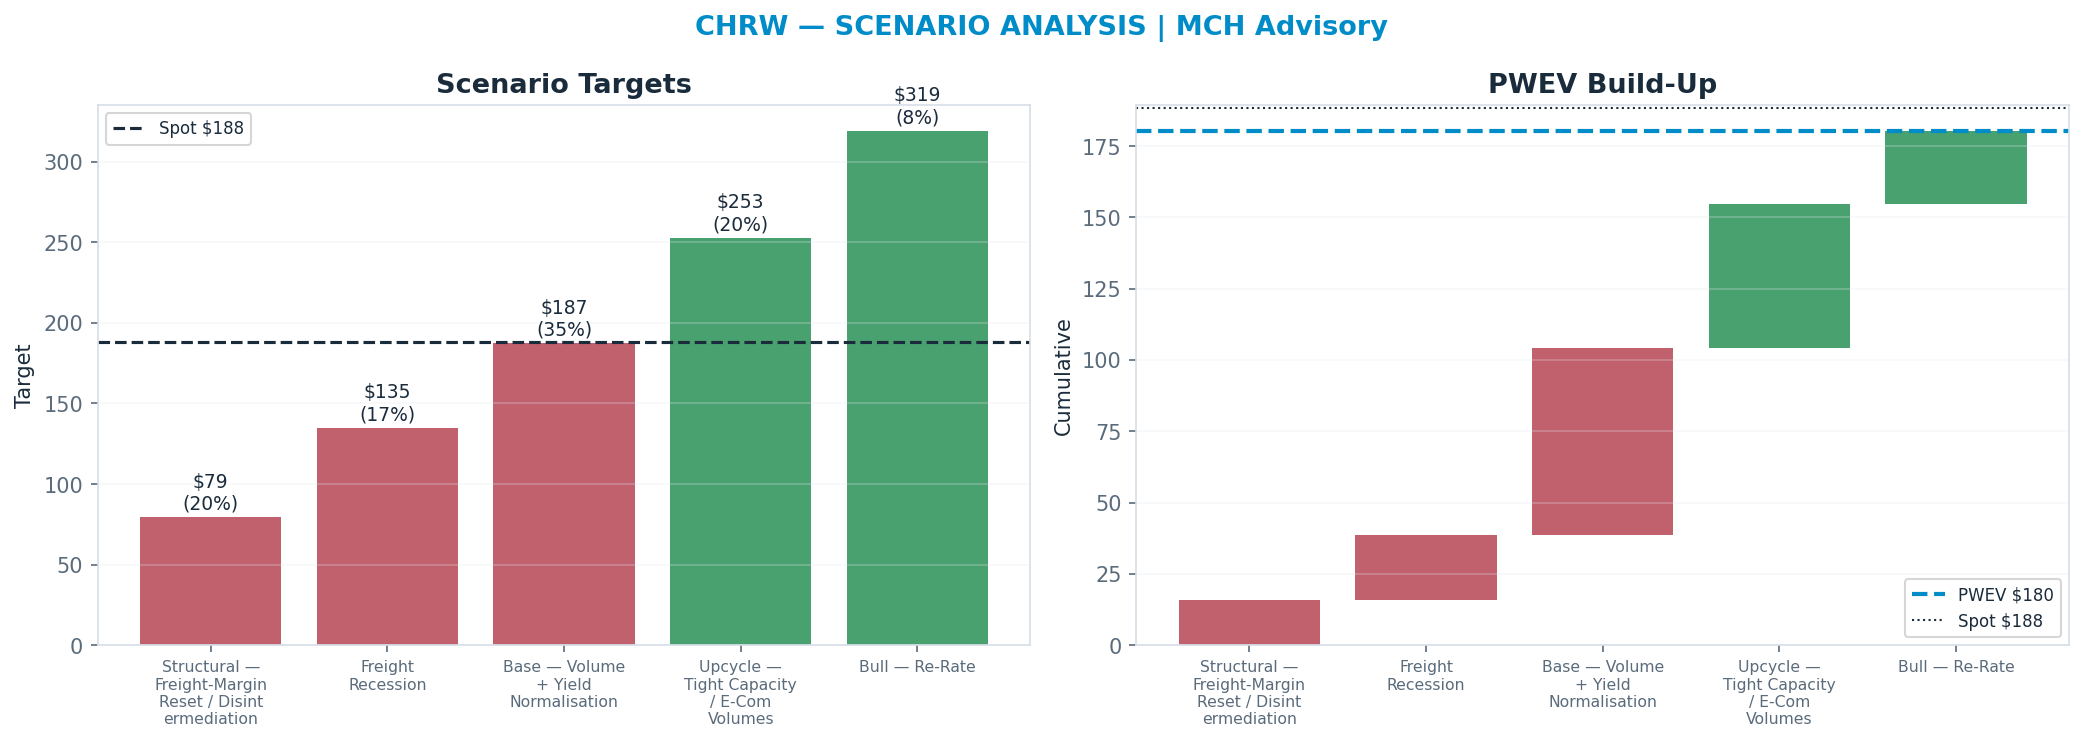
The tree runs from a structural 'Structural — Freight-Margin Reset / Disintermediation' downside ($79) to a 'Bull — Re-Rate' bull case ($319); the probability-weighted blend (PWEV $180) is -4% versus spot.
| Scenario | Probability | Target | Return |
|---|---|---|---|
| Structural — Freight-Margin Reset / Disintermediation | 20% | $79 | -58% |
| Freight Recession | 17% | $135 | -28% |
| Base — Volume + Yield Normalisation | 35% | $187 | -1% |
| Upcycle — Tight Capacity / E-Com Volumes | 20% | $253 | +34% |
| Bull — Re-Rate | 8% | $319 | +69% |
| Probability-Weighted (PWEV) | — | $180 | -4% |
Scenario rationale — what each probability buys (the driver path behind every target):
- Structural — Freight-Margin Reset / Disintermediation (20%, $79). Structural impairment — freight-margin reset / disintermediation: earnings AND the multiple compress together. Target sits below the 52-week low by construction. Drivers — implied_target: 79.37; probability: 0.2.
- Freight Recession (17%, $135). Cyclical downturn — freight volumes + yields (parcel/LTL/forwarding) + the freight cycle + fuel weakens for 1–2 years before normalising. Drivers — implied_target: 134.78; probability: 0.17.
- Base — Volume + Yield Normalisation (35%, $187). Mid-cycle — normalised freight volumes + yields (parcel/LTL/forwarding) + the freight cycle + fuel; disciplined capital allocation; steady returns. Drivers — implied_target: 187.19; probability: 0.35.
- Upcycle — Tight Capacity / E-Com Volumes (20%, $253). Upside — tight capacity + e-com volumes lifts earnings above mid-cycle; the multiple expands modestly. Drivers — implied_target: 252.71; probability: 0.2.
- Bull — Re-Rate (8%, $319). Upside tail — sustained tight conditions or a structural re-rate on tight capacity + e-com volumes. Drivers — implied_target: 319.17; probability: 0.08.
Valuation Triangulation
Five anchors — but read them with their basis in mind. The Monte Carlo, the DCF terminal, and the peer re-rate all key off a market multiple, so they are not fully independent; only the discounted cash flows themselves are genuinely multiple-free. The discipline is to read the spread and weight the cash-based view, not to treat five numbers as five independent votes.
| Method | Basis | Fair Value | vs Spot |
|---|---|---|---|
| Monte Carlo median (Student-t + regime) | multiple | $159 | -16% |
| Peer P/E re-rate | multiple | $95 | -50% |
| Peer EV/Revenue re-rate | multiple | $166 | -12% |
| Scenario PWEV | multiple | $180 | -4% |
| DCF (5-year + terminal) | cash flow + terminal × | $125 | -34% |
| Triangulated (weighted) | — | $144 | -24% |
Rating vs blend — the key debate. The rating tracks the multiple-discipline fair value (Monte Carlo $159 + scenario PWEV $180, ≈ spot); the weighted blend $144 (-24%) sits below it because the cash-flow DCF ($125) is materially more conservative than the market multiple. Whether the current multiple is justified is the central question for this name — and the principal downside risk to the rating.
Monte Carlo — the distribution, not a point
10,000 paths, Student-t shocks (fat tails) with a regime-switching overlay. The median lands at $159 and 39% of paths finish above spot. The variance decomposition shows the gross margin is the dominant swing factor (60% of variance). The fundamental driver, not the multiple, sets the spread — a cleaner setup.
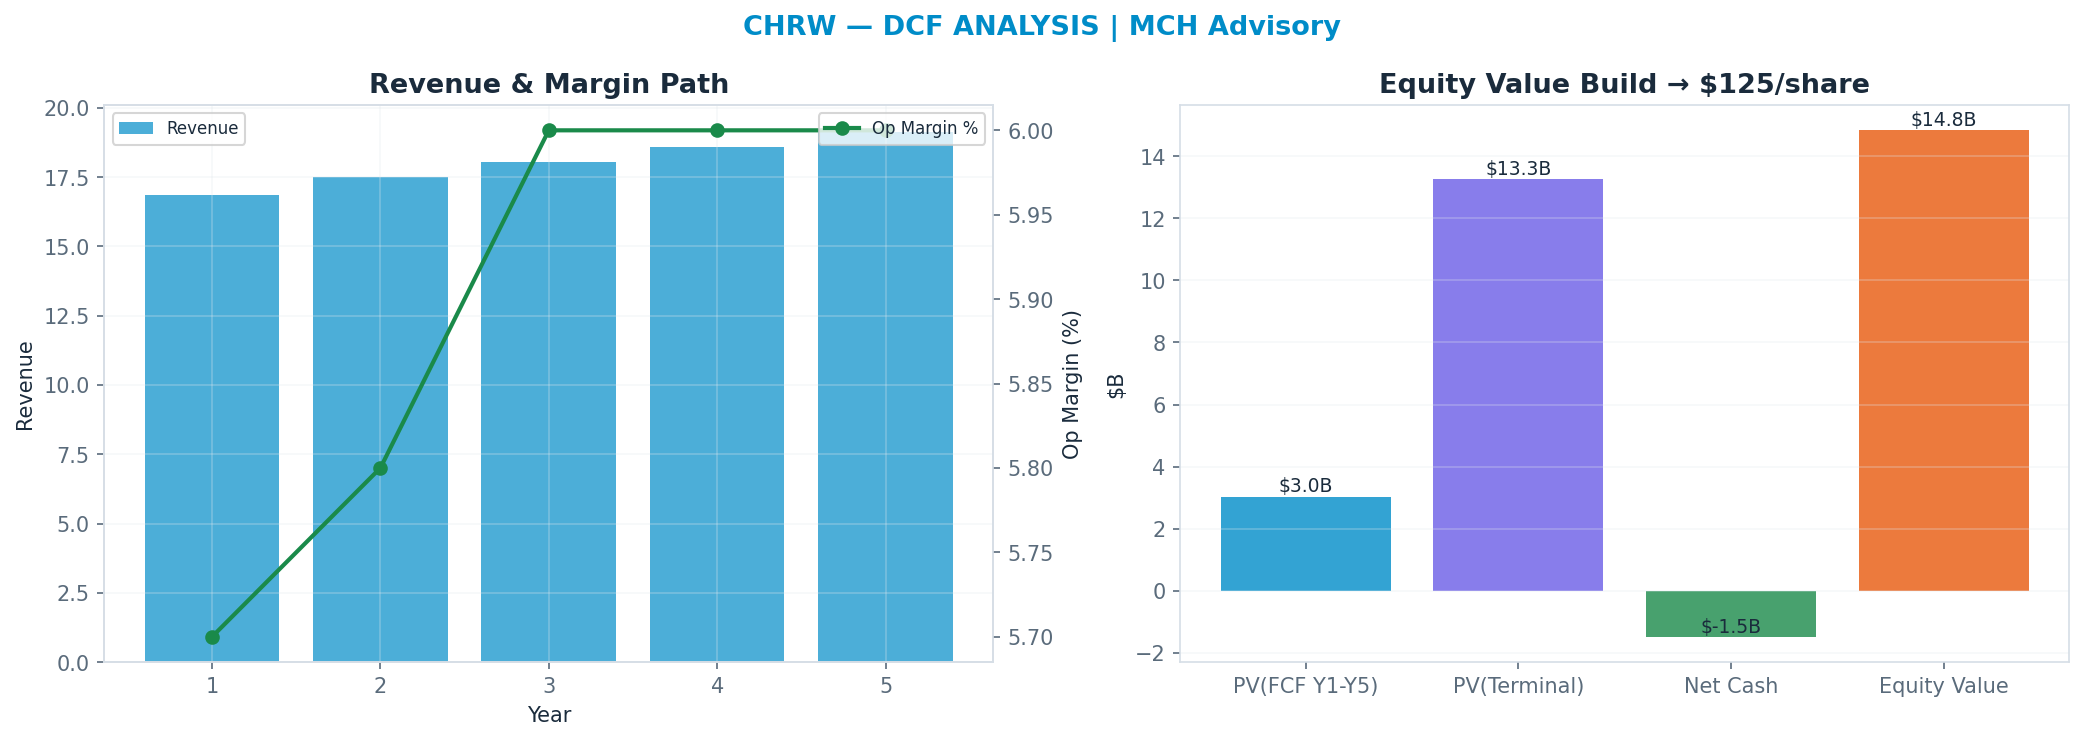
DCF — the cash-flow anchor
Independent of the market multiple: a 5-year path, WACC 9.0%, 25x terminal FCF multiple → $125. This anchor is deliberately the heaviest (41%): it is the valuation least hostage to the current multiple regime.
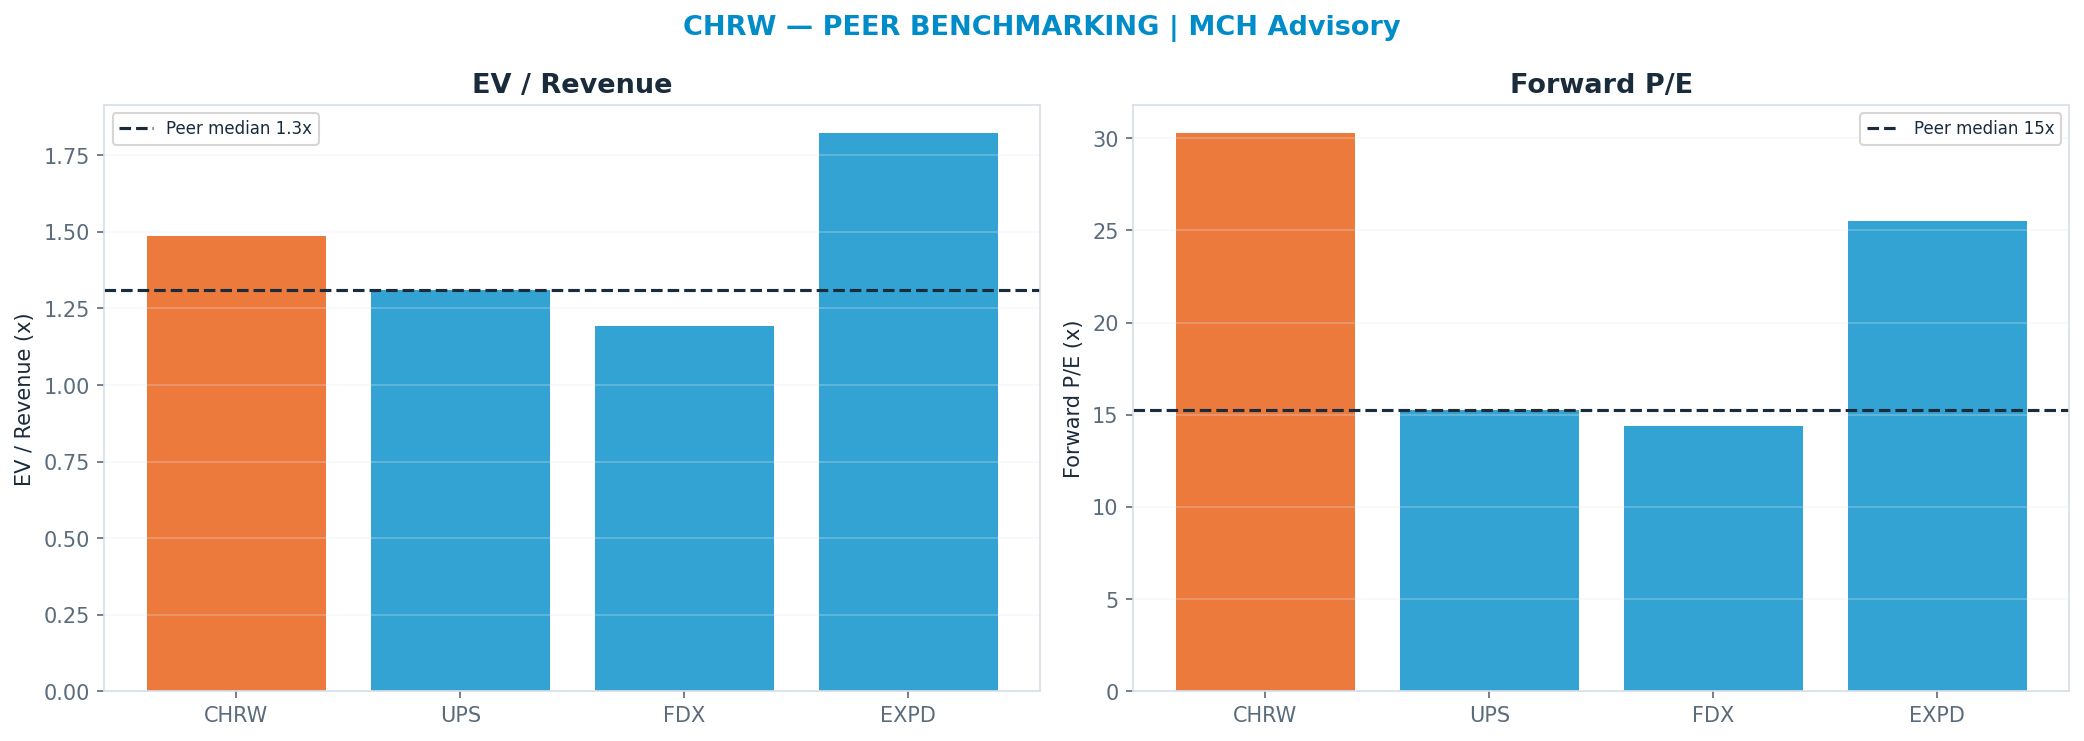
Peer benchmarking — relative value
Against the peer cohort, re-rating to the peer-median forward multiple (P/E 15.27x) implies $95. A premium is only justified by superior growth/margins; otherwise it is multiple risk. Weighted just 12% so the market's mood does not drive the fair value.
Across all anchors the spread is wide (genuine disagreement — low valuation confidence).
Revenue-Segment Breakdown
The company-specific drivers behind the valuation — each segment carries its own growth, margin, multiple and capex intensity. (Tags: FACT reported · ESTIMATE from disclosures · INFERENCE judgment.)
| Segment | Revenue | Mix | Growth | Op margin | Multiple | Capex % | Tag |
|---|---|---|---|---|---|---|---|
| Freight & Logistics | $16.2B | 100% | 4% | 6% | 29x | 6% | ESTIMATE |
Named Exposures
Demand & pricing cycle (FACT/ESTIMATE)
| Dimension | Assessment |
|---|---|
| driver | freight volumes + yields (parcel/LTL/forwarding) + the freight cycle + fuel |
| net_debt_or_cash_b | -1.48 |
Capital intensity & shareholder returns (ESTIMATE)
| Dimension | Assessment |
|---|---|
| capex_pct_revenue | 0.06 |
| div_yield | 0.0141 |
Structural risk vs optionality (INFERENCE)
| Dimension | Assessment |
|---|---|
| downside | freight-margin reset / disintermediation |
| upside | tight capacity + e-com volumes |
Industry Context — Ind Transport
This name sits in the Ind Transport as a freight_logistics. freight volumes + yields (parcel/LTL/forwarding) + the freight cycle + fuel Its scenarios are not guessed in isolation — they inherit a single, shared view of the cluster's driver cycle, so the names that depend on the same event are mutually consistent.
Value chain: UNP (rails) · UPS (freight_logistics) · CSX (rails) · FDX (freight_logistics) · NSC (rails) · DAL (airlines) · ODFL (freight_logistics) · UAL (airlines) · JBHT (freight_logistics) · LUV (airlines) · FDXF (freight_logistics) · EXPD (freight_logistics) · CHRW (freight_logistics)
| Shared state | Capex path | House view | This name implies |
|---|---|---|---|
| Freight / Travel Recession | 38% | 37% | |
| Mid-Cycle — Volume + Yield Normalisation | 34% | 35% | |
| Upcycle — Tight Capacity / Strong Demand | 28% | 28% |
On the cluster's key downside — Freight / Travel Recession () — this name implies 37% vs the cluster house view of 38% (in line with the house). The cluster's full cross-stock reconciliation governs that the names which ride the same capex cycle assign it comparable odds.
Structure: Shared State — The ind_transport cycle is the shared macro driver. Driver — freight volumes & yields + passenger demand + the transport cycle + fuel/labor Dispersion — Members differ by cyclicality (quality compounders vs deep cyclicals).
Model Appendix
DCF — line items
| Year | Revenue | Op income | − Capex | + D&A | FCF | PV(FCF) |
|---|---|---|---|---|---|---|
| FY+1 | $17B | $1B | $1B | $1B | $1B | $1B |
| FY+2 | $18B | $1B | $1B | $1B | $1B | $1B |
| FY+3 | $18B | $1B | $1B | $1B | $1B | $1B |
| FY+4 | $19B | $1B | $1B | $1B | $1B | $1B |
| FY+5 | $19B | $1B | $1B | $1B | $1B | $1B |
| Terminal | — | — | — | — | $1B × 25x | $13B |
FCF is bridged: NOPAT + D&A − Capex − ΔNWC (capex intensity 6% of revenue, weighted from the segments) — not a single conversion fudge.
WACC 9.0% · Σ PV(FCF) $3B + PV(terminal) $13B = EV $16B; + net cash → equity $15B ÷ diluted shares 0.12B = $125/share (exit-multiple terminal).
- Gordon (perpetuity-growth) terminal at 2.5% → $83/share — a genuinely non-multiple, cash-based cross-check; the exit-multiple and Gordon values bracket the terminal-value risk.
- Incremental ROIC on the forecast capex ≈ 3% vs WACC 9% → below WACC — the incremental build is value-dilutive.
Peer set
| Peer | EV/Rev | Fwd P/E | Growth | Op margin |
|---|---|---|---|---|
| UPS | 1.311x | 15.27x | 4% | 6% |
| FDX | 1.192x | 14.37x | 4% | 7% |
| EXPD | 1.823x | 25.51x | 4% | 11% |
| Median | 1.311x | 15.27x | — | — |
Peer-median fwd P/E → $95; EV/Rev → $166.
Weighted fair-value math
| Anchor | Value | Weight | Contribution |
|---|---|---|---|
| DCF | $125 | 41% | $51 |
| Scenario PWEV | $180 | 29% | $53 |
| Monte Carlo median | $159 | 18% | $28 |
| Peer P/E | $95 | 12% | $11 |
| Triangulated | — | 100% | $144 |
Sensitivity
DCF/share — WACC × terminal multiple
| WACC \ Term× | 17.5x | 21.2x | 25.0x | 28.7x | 32.5x |
|---|---|---|---|---|---|
| 7% | $100 | $118 | $137 | $155 | $174 |
| 8% | $96 | $113 | $131 | $148 | $166 |
| 9% | $91 | $108 | $125 | $141 | $158 |
| 10% | $87 | $103 | $119 | $135 | $151 |
| 11% | $83 | $98 | $114 | $129 | $144 |
DCF/share — revenue CAGR Δ × op-margin Δ
| CAGRΔ \ MgnΔ | -3.0pp | -1.5pp | +0.0pp | +1.5pp | +3.0pp |
|---|---|---|---|---|---|
| -3.0pp | $52 | $85 | $117 | $150 | $183 |
| -1.5pp | $51 | $86 | $121 | $156 | $191 |
| +0.0pp | $50 | $87 | $125 | $162 | $200 |
| +1.5pp | $48 | $88 | $128 | $168 | $208 |
| +3.0pp | $47 | $90 | $132 | $175 | $218 |
Tornado — DCF/share swing by driver (widest first)
| Driver | Low | High | Swing |
|---|---|---|---|
| Op margin ±3pp | $50 | $200 | $150 |
| Terminal × ±15% | $108 | $141 | $33 |
| Revenue CAGR ±3pp | $117 | $132 | $15 |
| WACC ±1pp | $119 | $131 | $12 |
| FCF conversion ±10% | $125 | $125 | $0 |
Company lever — SoP/share vs Freight & Logistics multiple (AI re-rating) (base 29x)
| Multiple | 20.3x | 24.6x | 29.0x | 33.3x | 37.7x |
|---|---|---|---|---|---|
| SoP/share | $2,751 | $3,336 | $3,935 | $4,521 | $5,120 |
Load-Bearing Assumptions
DCF: WACC 9%, terminal multiple 25×, FY+5 revenue $19B. Triangulation leans 41% on DCF, 29% on PWEV.
Reasons the Thesis Could Fail (Falsifiable)
A miss on Gross Margin drops the case toward the structural target $79.
Fact / Inference / Speculation
- FACT: Spot $188; 52-week range $94–$202; engine rating HOLD; base-case target $180 (-4%).
- INFERENCE: Triangulated FV $144 (-24%). Gross Margin explains 60% of Monte Carlo outcome variance — the single variable that decides which side is right.
- SPECULATION: At current prices the embedded bet is that Gross Margin surprises to the upside — Gross Margin carries 60% of outcome variance.
Recommendation: HOLD
Balanced: triangulated fair value $144 (-24% vs spot); the outcome hinges on Gross Margin. The debate is Gross Margin (60% of variance) — a fundamental call. SBC runs —M TTM (disclosed in the appendix).