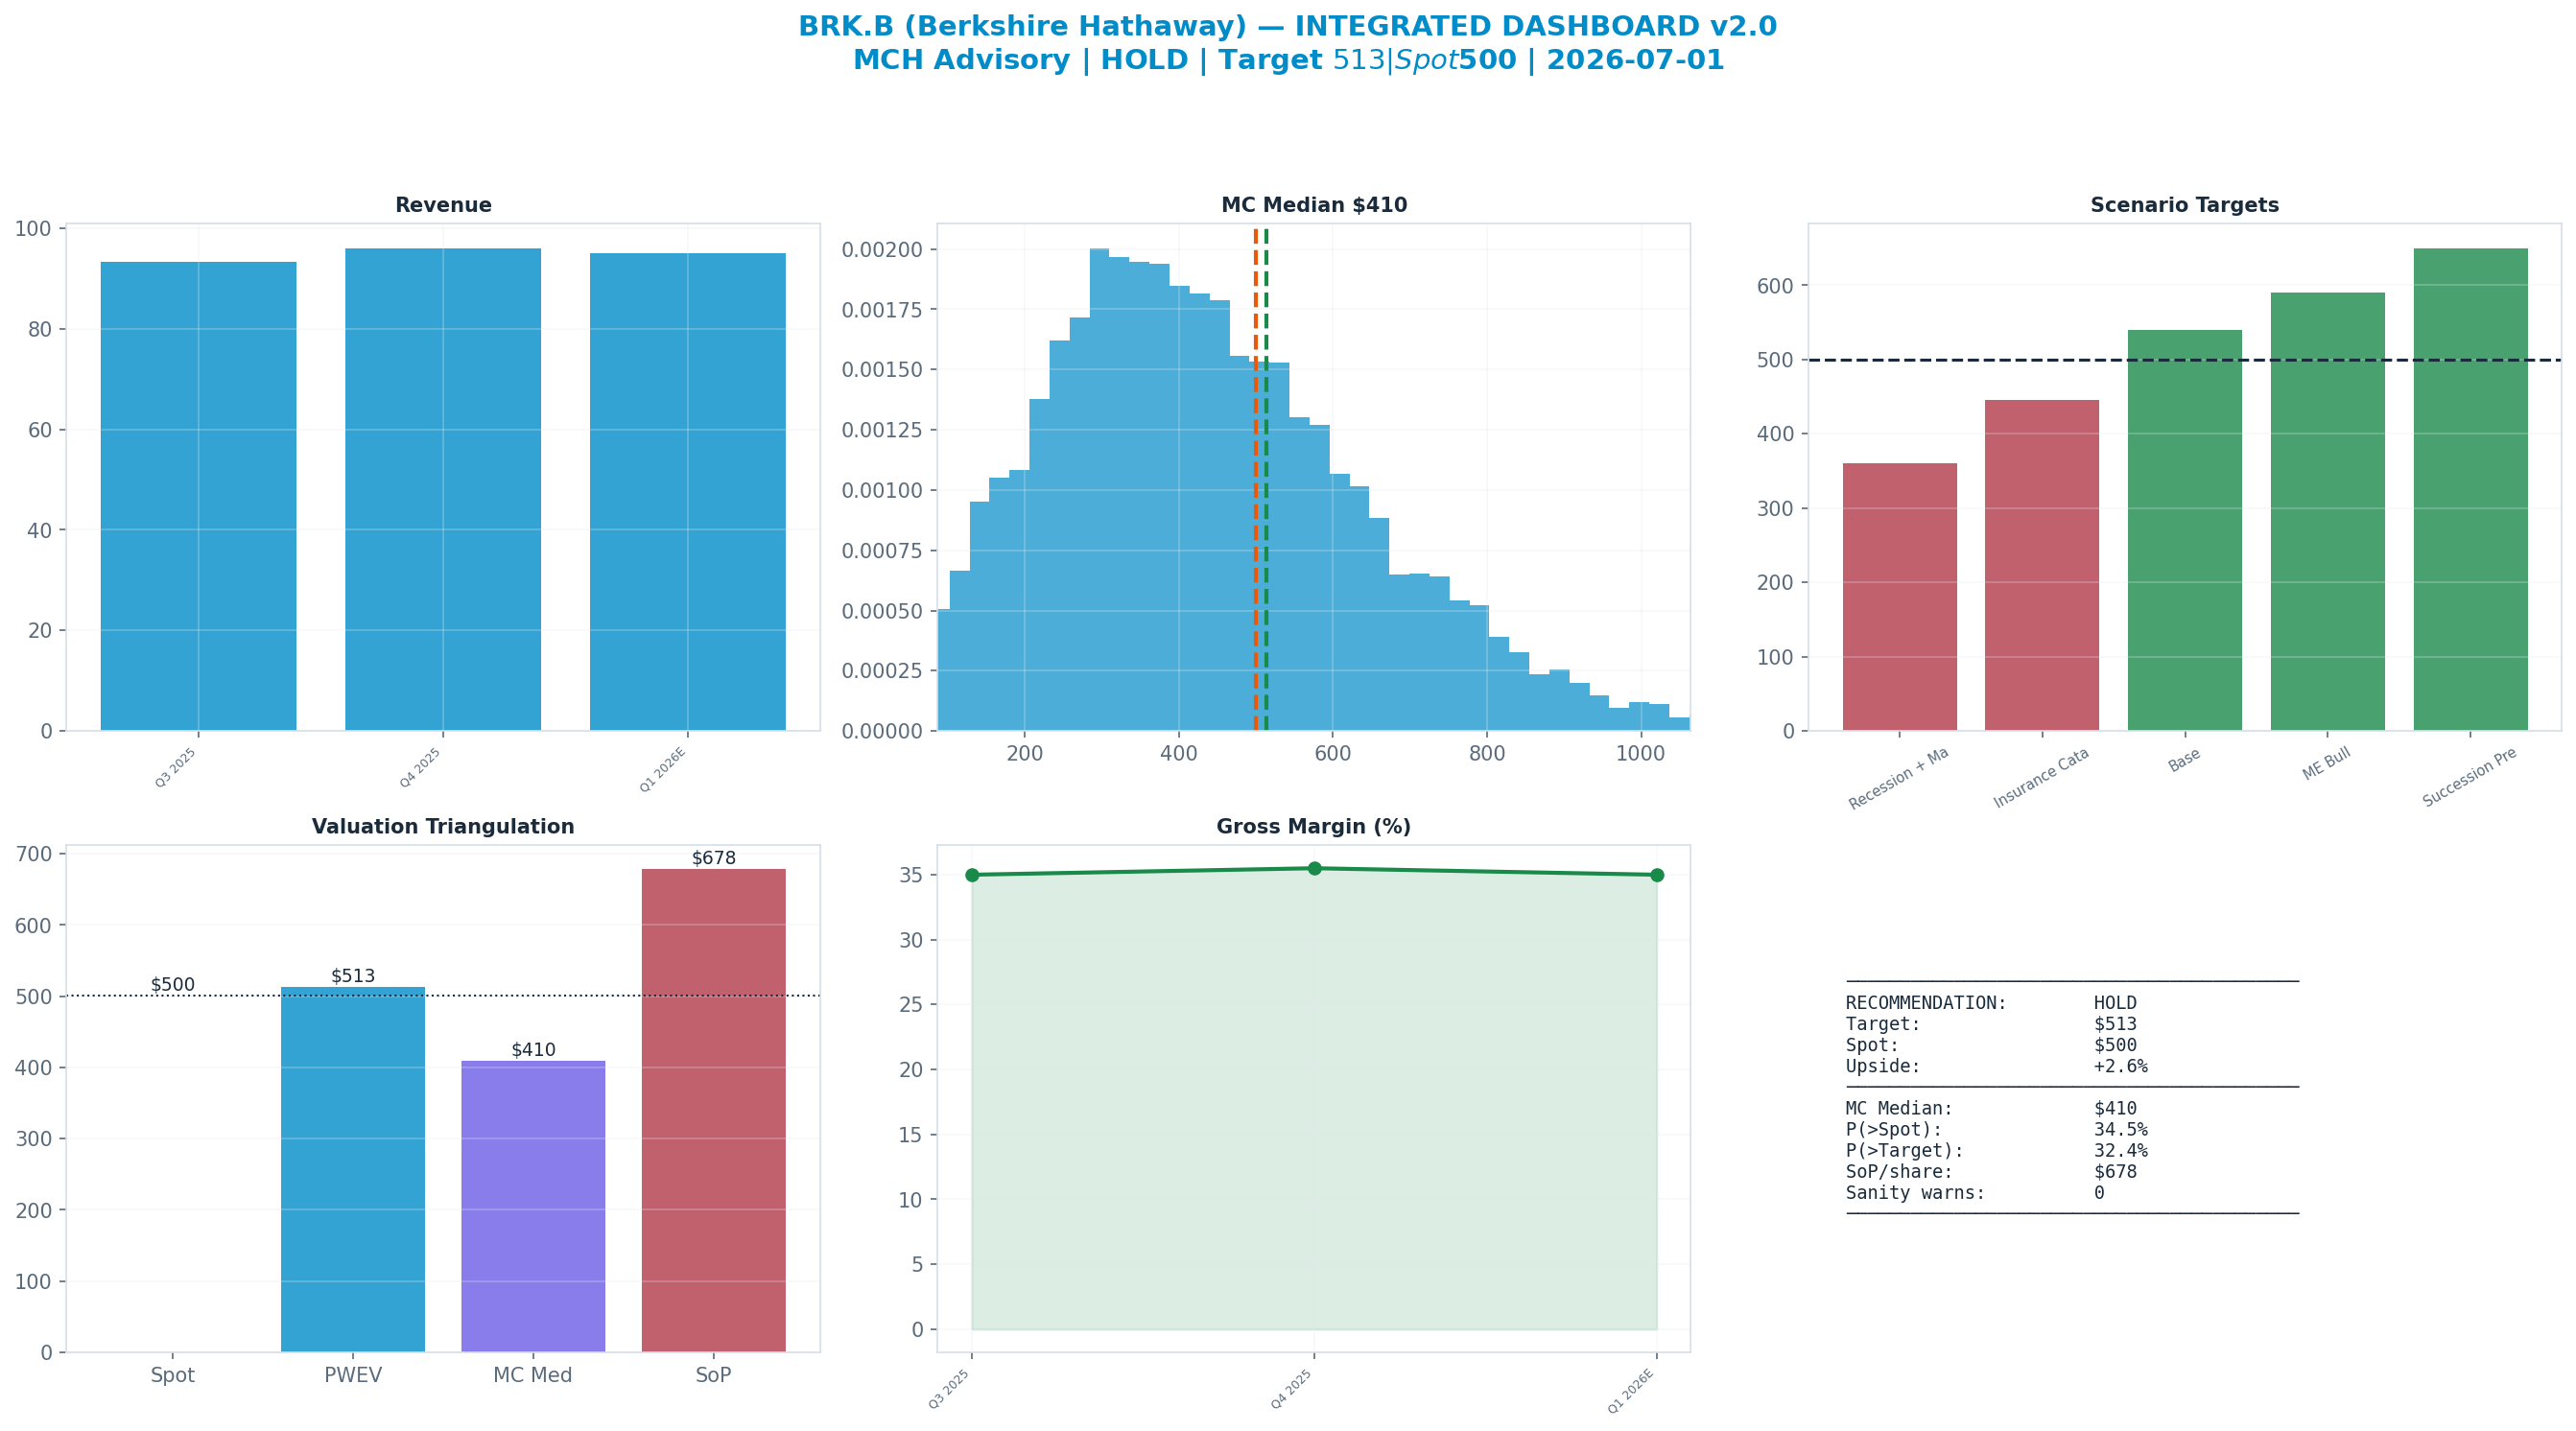
Rating: HOLD
| Metric | Value |
|---|---|
| Current Price | $500 |
| Triangulated Fair Value | $530 |
| 12-mo Scenario PWEV | $513 |
| Implied Return | +6% |
| Market Cap | $700B |
| 52-Week Range | $455 – $517 |
Methodology: Valuation triangulated across five independent anchors — Monte Carlo (Student-t + regime switching), an independent DCF, peer re-rating, a sum-of-parts, and a scenario-weighted PWEV. Figures reconciled to mch_weekly_run live prices. Each chart below sits with the part of the thesis it evidences.
Investment Thesis
The bull case — 'Succession Premium' (10% weight) — targets $650, +30% vs spot. It needs Gross Margin to surprise to the upside.
The dashboard below is the whole argument on one page: spot ($500) against each valuation anchor, the scenario tree, technicals and the options-implied move.
Anti-Thesis (The Real Bear Case)
The structural case — 'Recession + Mark-to-Market' (20%) — targets $360, -28% vs spot. This sits below the 52-week low — a genuine structural impairment, not a mild pullback.
Key Debate
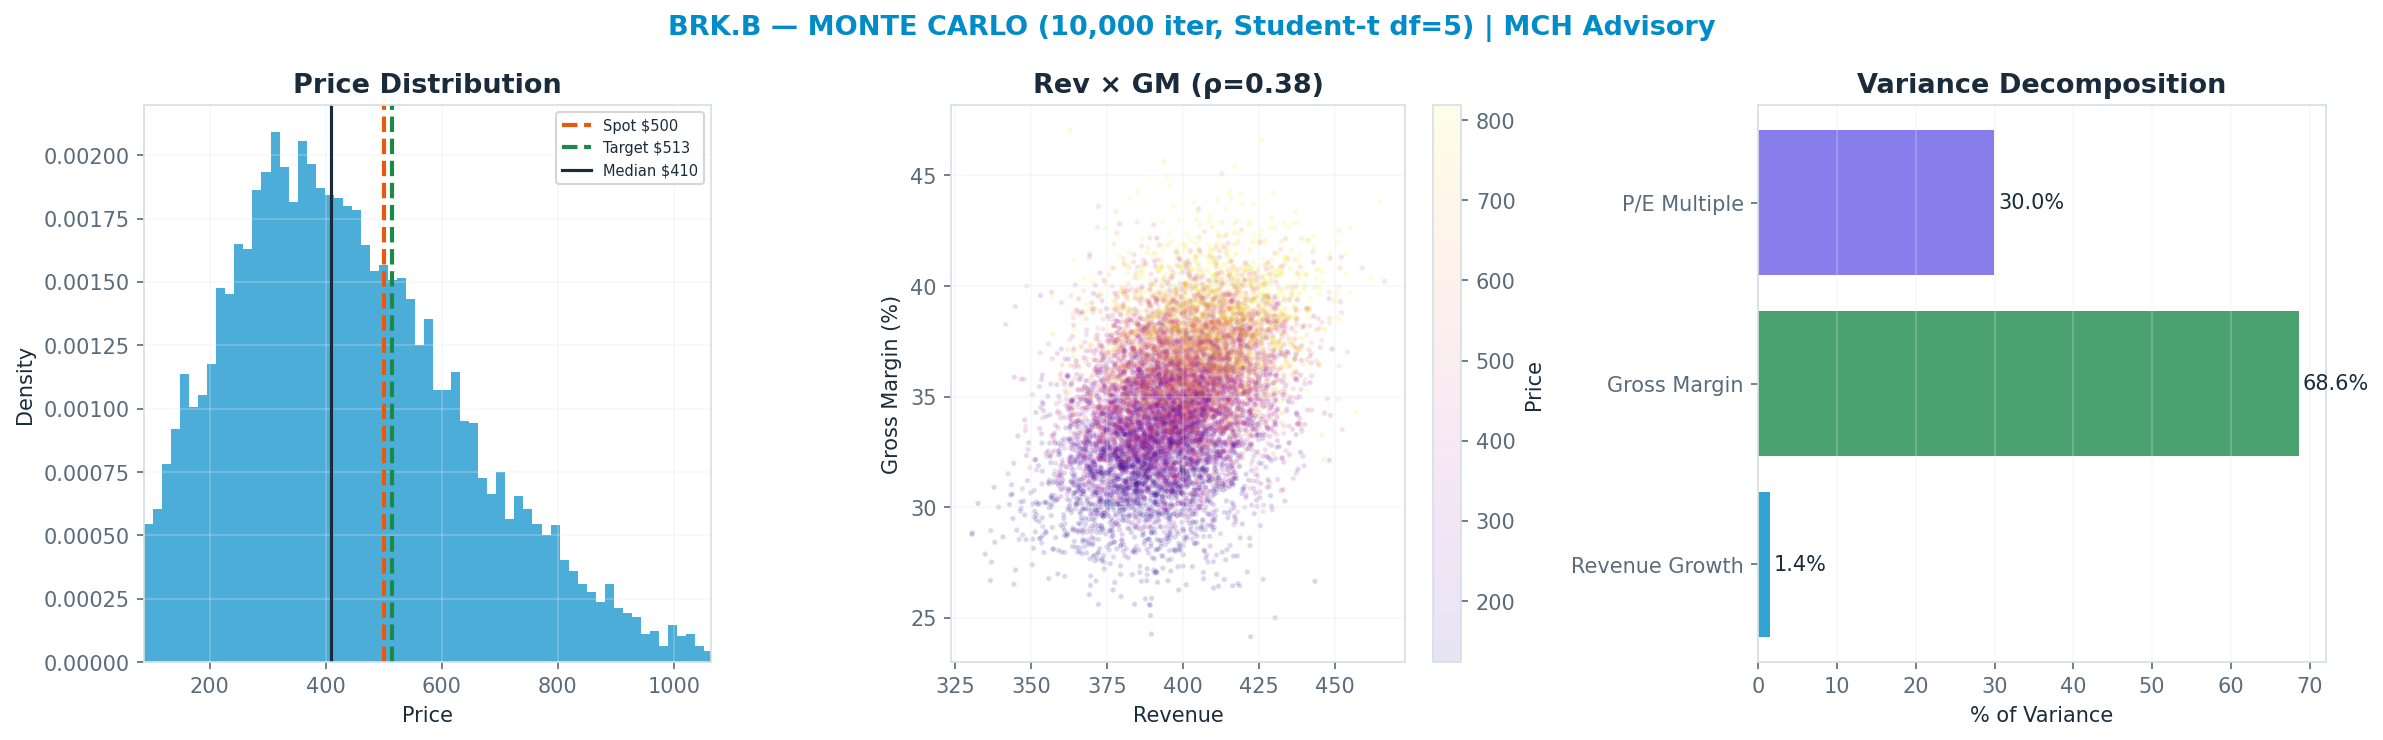
Gross Margin explains 69% of Monte Carlo outcome variance — the single variable that decides which side is right.
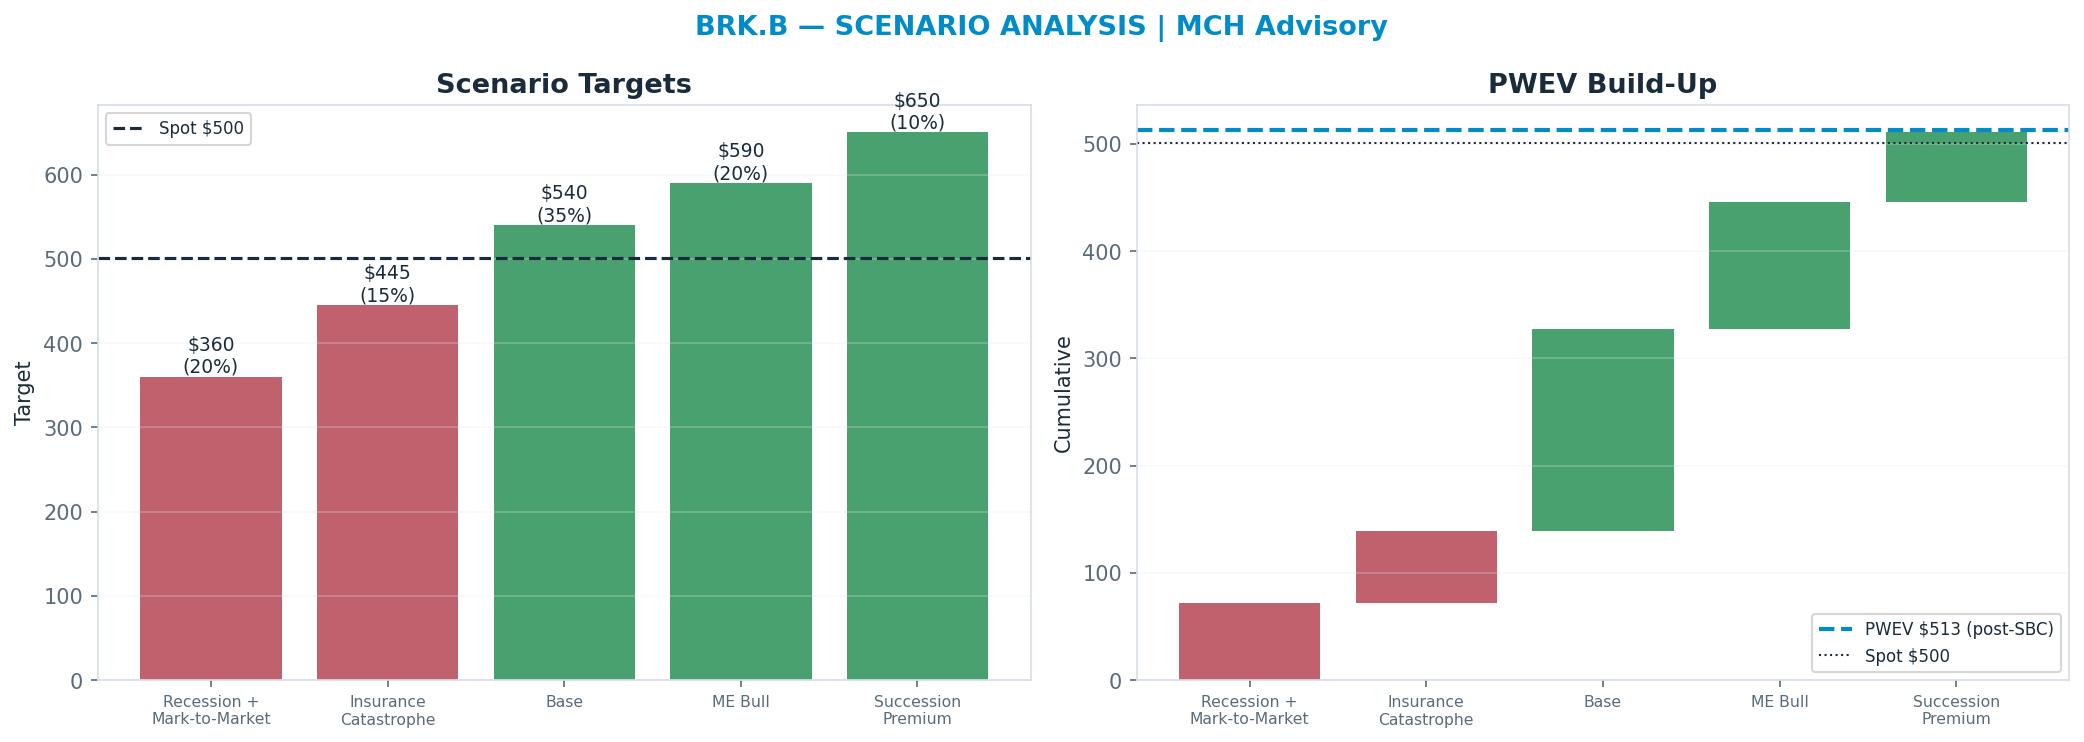
Scenario Analysis
The tree runs from a structural 'Recession + Mark-to-Market' downside ($360) to a 'Succession Premium' bull case ($650); the probability-weighted blend (PWEV $513) is +3% versus spot.
| Scenario | Probability | Target | Return |
|---|---|---|---|
| Recession + Mark-to-Market | 20% | $360 | -28% |
| Insurance Catastrophe | 15% | $445 | -11% |
| Base | 35% | $540 | +8% |
| ME Bull | 20% | $590 | +18% |
| Succession Premium | 10% | $650 | +30% |
| Probability-Weighted (PWEV, after SBC dilution) | — | $513 | +3% |
SBC charge: scenario targets are gross per-share prices; the PWEV is reduced by one year of stock-based-compensation dilution (-0.5% of shares, on SBC ≈ 0% of revenue), trimming the gross PWEV of $511 to $513 (+0.5%). SBC is charged once, as dilution — never also deducted from FCF.
Scenario rationale — what each probability buys (the driver path behind every target):
- Recession + Mark-to-Market (20%, $360). A broad equity-market drawdown marks the ~$310B portfolio down 25-35% (Apple-led), and cyclical operating earnings (BNSF carloads, MSR industrials) contract simultaneously. GAAP net income turns sharply negative on unrealized losses while book value falls; the P/B multiple compresses toward ~1.2x. The offsetting positive - record cash redeployed into a dislocation - is real but lags the mark, so the trough sits below the 52-week low. Drivers — portfolio_mark: -25% to -35%; operating_earnings: -10% to -15%; book_value_growth: negative; p_b_multiple: ~1.2x.
- Insurance Catastrophe (15%, $445). A major catastrophe year (large hurricane / earthquake / multi-event) drives a sizable underwriting loss across GEICO, Primary and Reinsurance, compounded by a PacifiCorp wildfire-liability escalation at BHE. Underwriting earnings swing negative for the year and float-cost turns positive; book-value growth stalls though the balance sheet absorbs it. The multiple holds near ~1.3x as the loss is judged transient rather than structural. Drivers — underwriting_result: large loss; wildfire_liability: escalates; book_value_growth: ~0%; p_b_multiple: ~1.3x.
- Base (35%, $540). Operating earnings compound at GDP-plus (~5-7%), insurance float grows with near-zero cost and reinvests at attractive Treasury/equity yields, and the portfolio appreciates roughly with the market. Book value compounds high-single-digits and the multiple holds around its recent ~1.5x P/B. Value accrues steadily from retained earnings + buybacks rather than multiple expansion. Drivers — operating_earnings_growth: ~6%; portfolio_return: ~7%; book_value_growth: ~8-10%; p_b_multiple: ~1.5x.
- ME Bull (20%, $590). Berkshire Hathaway Energy's regulated rate base compounds faster than expected on grid/renewables buildout, wildfire-liability overhang resolves favorably, and BHE earnings re-rate toward regulated-utility peers. Combined with steady insurance and rail, book-value growth accelerates and the sum-of-parts gap to intrinsic value narrows; the multiple expands toward ~1.6x. Drivers — bhe_rate_base_growth: >8%; wildfire_overhang: resolves favorably; book_value_growth: ~10-12%; p_b_multiple: ~1.6x.
- Succession Premium (10%, $650). The post-Buffett transition executes cleanly under Abel, the record cash pile is deployed into one or more needle-moving acquisitions at attractive returns, and buybacks continue below intrinsic value. The market re-rates for proven capital-allocation continuity and reduced key-man discount; book-value growth steps up and the multiple expands toward ~1.7-1.8x P/B. Drivers — cash_deployment: large deal(s) at attractive IRR; key_man_discount: narrows; book_value_growth: ~12%+; p_b_multiple: ~1.7-1.8x.
Valuation Triangulation
Five anchors — but read them with their basis in mind. The Monte Carlo, the DCF terminal, and the peer re-rate all key off a market multiple, so they are not fully independent; only the discounted cash flows themselves are genuinely multiple-free. The discipline is to read the spread and weight the cash-based view, not to treat five numbers as five independent votes.
| Method | Basis | Fair Value | vs Spot |
|---|---|---|---|
| Monte Carlo median (Student-t + regime) | multiple | $410 | -18% |
| Sum-of-Parts | multiple | $678 | +36% |
| Scenario PWEV | multiple | $513 | +3% |
| Triangulated (weighted) | — | $530 | +6% |
Monte Carlo — the distribution, not a point
10,000 paths, Student-t shocks (fat tails) with a regime-switching overlay. The median lands at $410 and 34% of paths finish above spot. The variance decomposition shows the gross margin is the dominant swing factor (69% of variance). The fundamental driver, not the multiple, sets the spread — a cleaner setup.
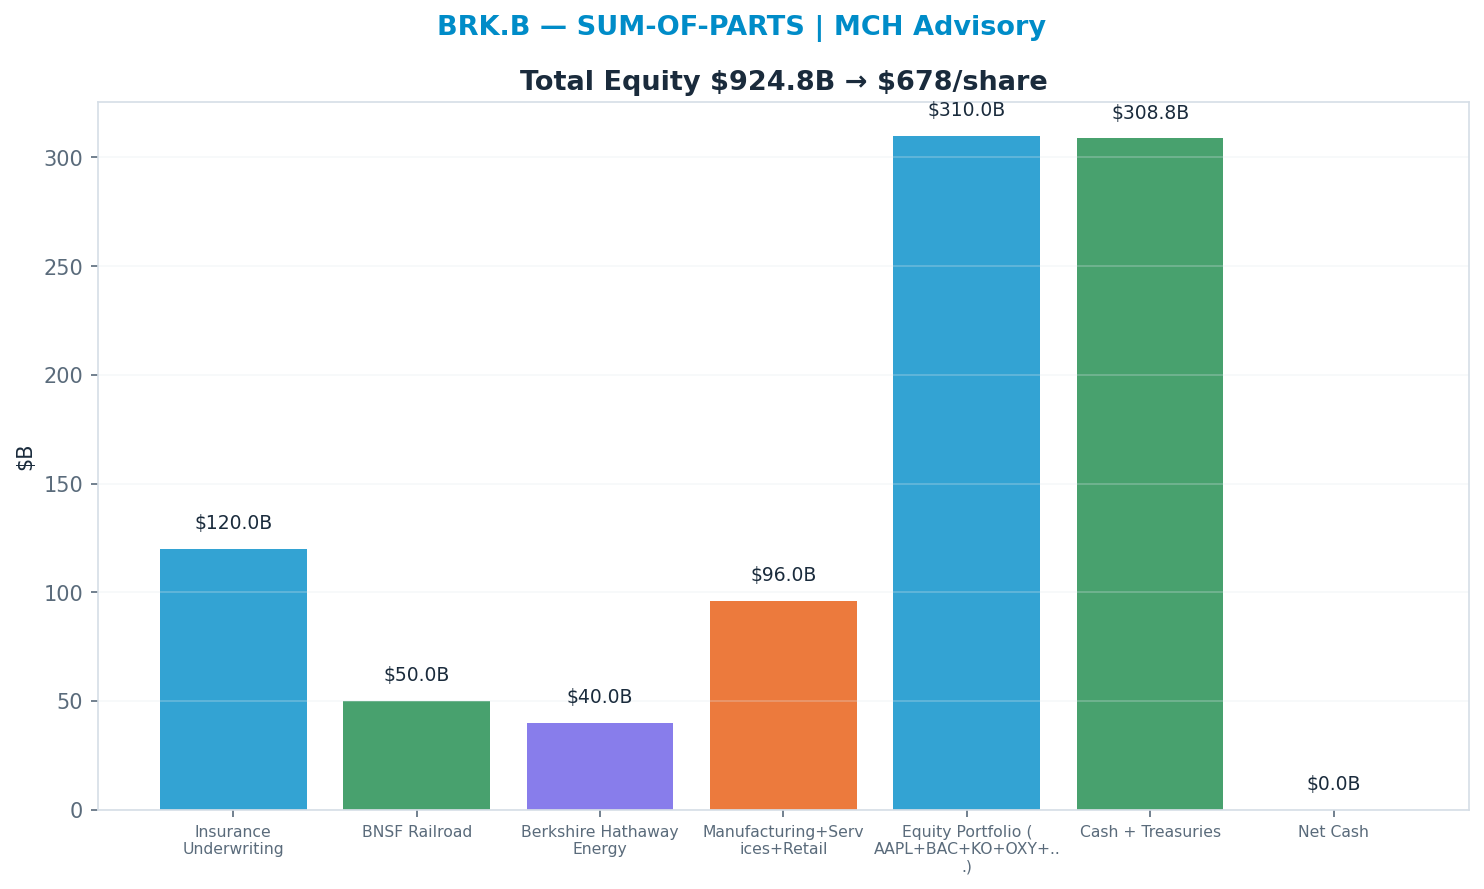
Sum-of-parts
Valuing each piece at the multiple it deserves (Insurance Underwriting 8x, BNSF Railroad 10x, Berkshire Hathaway Energy 10x, Manufacturing+Services+Retail 8x, Equity Portfolio (AAPL+BAC+KO+OXY+...) 1x, Cash + Treasuries 1x) → $678. 'Equity Portfolio (AAPL+BAC+KO+OXY+...)' dominates at 1.0× → $310B (34% of EV) — the segment whose multiple matters most.
Across all anchors the spread is wide (genuine disagreement — low valuation confidence).
Revenue-Segment Breakdown
The company-specific drivers behind the valuation — each segment carries its own growth, margin, multiple and capex intensity. (Tags: FACT reported · ESTIMATE from disclosures · INFERENCE judgment.)
| Segment | Revenue | Mix | Growth | Op margin | Multiple | Capex % | Tag |
|---|---|---|---|---|---|---|---|
| Insurance Underwriting + Float | $9B | 16% | 5% | 10% | 14x | 2% | FACT/ESTIMATE |
| BNSF Railroad | $7B | 10% | 2% | 30% | 16x | 16% | FACT/ESTIMATE |
| Berkshire Hathaway Energy | $5B | 9% | 6% | 18% | 17x | 30% | FACT/ESTIMATE |
| Manufacturing, Service & Retail | $12B | 18% | 3% | 10% | 13x | 4% | FACT/ESTIMATE |
| Equity Portfolio (marketable) | $310B | 30% | 7% | 0% | 1.0x | 0% | FACT/ESTIMATE |
| Cash + Treasuries | $330B | 17% | 0% | 0% | 0.85x | 0% | FACT/ESTIMATE |
Named Exposures
Equity-portfolio concentration (FACT/ESTIMATE/INFERENCE)
| Dimension | Assessment |
|---|---|
| Largest holding | Apple ~25-30% of the ~$310B marketable equity book (est., post-2024 trimming) - single-name dominance |
| Top-5 concentration | Apple, Bank of America, Coca-Cola, American Express, Chevron together ~65-70% of the equity book (est.) |
| Mark-to-market volatility | Post-ASU 2016-01, unrealized equity gains/losses flow through GAAP net income - quarterly EPS is dominated by portfolio marks, not operating earnings |
| Single-name risk | A drawdown in Apple alone moves reported net income and book value by tens of billions; operating-earnings trend is the cleaner economic signal |
| Energy/financials tilt | OXY (+warrants), Chevron and BofA concentrate exposure to oil price and the rate/credit cycle |
Succession & cash deployment (INFERENCE/ESTIMATE)
| Dimension | Assessment |
|---|---|
| Key-man transition | Post-Buffett leadership (Greg Abel as designated CEO, investment book to Combs/Weschler) - the capital-allocation track record is the moat, and it is personality-dependent |
| Record cash pile | ~$330B+ cash + Treasuries - the largest in company history; signals a lack of large deployable opportunities at acceptable prices |
| Reinvestment drag | Cash earning ~4-5% T-bill yields underperforms the equity compounding investors pay for; a structural drag on intrinsic-value growth until deployed |
| Buyback discipline | Repurchases are price-disciplined (only below intrinsic value) - supportive of per-share value but not a substitute for a large acquisition |
| Deal-scarcity risk | The universe of needle-moving acquisitions for a ~$1T+ enterprise is small; size is now an anchor on the historical compounding rate |
Industry Context — Diversified Holdco
This name sits in the Diversified Holdco as a diversified conglomerate / holdco. Value driven by book-value compounding rather than a single earnings multiple; large listed-equity-portfolio marks (heavy AAPL concentration) flow through book value and reported earnings; insurance underwriting + float supply low-cost investable capital; a record cash pile creates reinvestment drag until deployed; and post-Buffett succession is the key franchise-durability variable. (INFERENCE) Its scenarios are not guessed in isolation — they inherit a single, shared view of the cluster's driver cycle, so the names that depend on the same event are mutually consistent.
Value chain: BRK-B (diversified conglomerate / holdco)
| Shared state | Capex path | House view | This name implies |
|---|---|---|---|
| Recession / Mark-to-Market | broad equity drawdown marks down the listed portfolio; book value contracts, GAAP earnings turn sharply negative on unrealized losses | 20% | 20% |
| Insurance Shock | major catastrophe / reserve event drives an underwriting loss; float economics deteriorate for a period | 15% | 15% |
| Base | operating subsidiaries compound steadily, equity portfolio roughly tracks the market, cash earns front-end yield with no transformational deployment | 40% | 35% |
| Compounding / Re-rate | large-scale capital deployment (acquisition, buybacks at a discount, or portfolio gains) accelerates book-value growth; market re-rates the holdco | 25% | 30% |
On the cluster's key downside — Recession / Mark-to-Market (broad equity drawdown marks down the listed portfolio; book value contracts, GAAP earnings turn sharply negative on unrealized losses) — this name implies 20% vs the cluster house view of 20% (in line with the house). The cluster's full cross-stock reconciliation governs that the names which ride the same capex cycle assign it comparable odds.
Structure: Valuation Basis — A holdco is valued on price-to-book and sum-of-parts (operating subsidiaries + listed equity portfolio + cash/fixed income), NOT on a single forward earnings multiple — reported GAAP EPS is distorted by mark-to-market swings on the equity book and is a poor guide to economic earnings. (FACT) Equity Portfolio Marks — A very large listed-equity portfolio with heavy AAPL concentration means book value and headline earnings are highly sensitive to mark-to-market moves in a handful of positions; the portfolio is a leveraged read on broad equity beta plus AAPL idiosyncratically. (FACT) Insurance Float — Insurance underwriting (GEICO, reinsurance, primary) supplies low- or negative-cost float that funds the investment book; underwriting profitability is cyclical and tail-exposed to catastrophe losses, but float is the structural engine of the compounding. (INFERENCE) Cash And Reinvestment — A record cash and short-term Treasury pile is both a fortress and a drag — it earns the front-end yield but signals a scarcity of large deployable opportunities at acceptable prices, so the reinvestment-rate constraint caps forward book-value growth until capital is put to work. (INFERENCE) Succession — Post-Buffett succession (Greg Abel as CEO, separate investment leads) is the key franchise question — operating culture and decentralization likely persist, but the capital-allocation edge that drove historical outperformance is the part most at risk of fading. (INFERENCE)
Load-Bearing Assumptions
No DCF anchor is meaningful for this asset; the blend leans 45% on probability-weighted scenarios and 27% on the Monte Carlo median — the scenario probabilities are the load-bearing inputs.
Reasons the Thesis Could Fail (Falsifiable)
A miss on Gross Margin drops the case toward the structural target $360.
Fact / Inference / Speculation
- FACT: Spot $500; 52-week range $455–$517; engine rating HOLD; base-case target $513 (+3%).
- INFERENCE: Triangulated FV $530 (+6%). Gross Margin explains 69% of Monte Carlo outcome variance — the single variable that decides which side is right.
- SPECULATION: At current prices the embedded bet is that Gross Margin surprises to the upside — Gross Margin carries 69% of outcome variance.
Recommendation: HOLD
Balanced: triangulated fair value $530 (+6% vs spot); the outcome hinges on Gross Margin. The debate is Gross Margin (69% of variance) — a fundamental call. SBC runs —M TTM (disclosed in the appendix).