Rating: HOLD
| Metric | Value |
|---|---|
| Current Price | $81 |
| Triangulated Fair Value | $87 |
| 12-mo Scenario PWEV | $87 |
| Implied Return | +7% |
| Forward P/E | 9.6x |
| Market Cap | $41B |
| 52-Week Range | $41 – $125 |
Methodology: Valuation triangulated across five independent anchors — Monte Carlo (Student-t + regime switching), an independent DCF, peer re-rating, a sum-of-parts, and a scenario-weighted PWEV. Figures reconciled to mch_weekly_run live prices + AV OVERVIEW refresh 2026-04-23. Each chart below sits with the part of the thesis it evidences.
Investment Thesis
The bull case — 'Fiat Crisis' (10% weight) — targets $160, +98% vs spot. It needs the multiple to hold or expand.
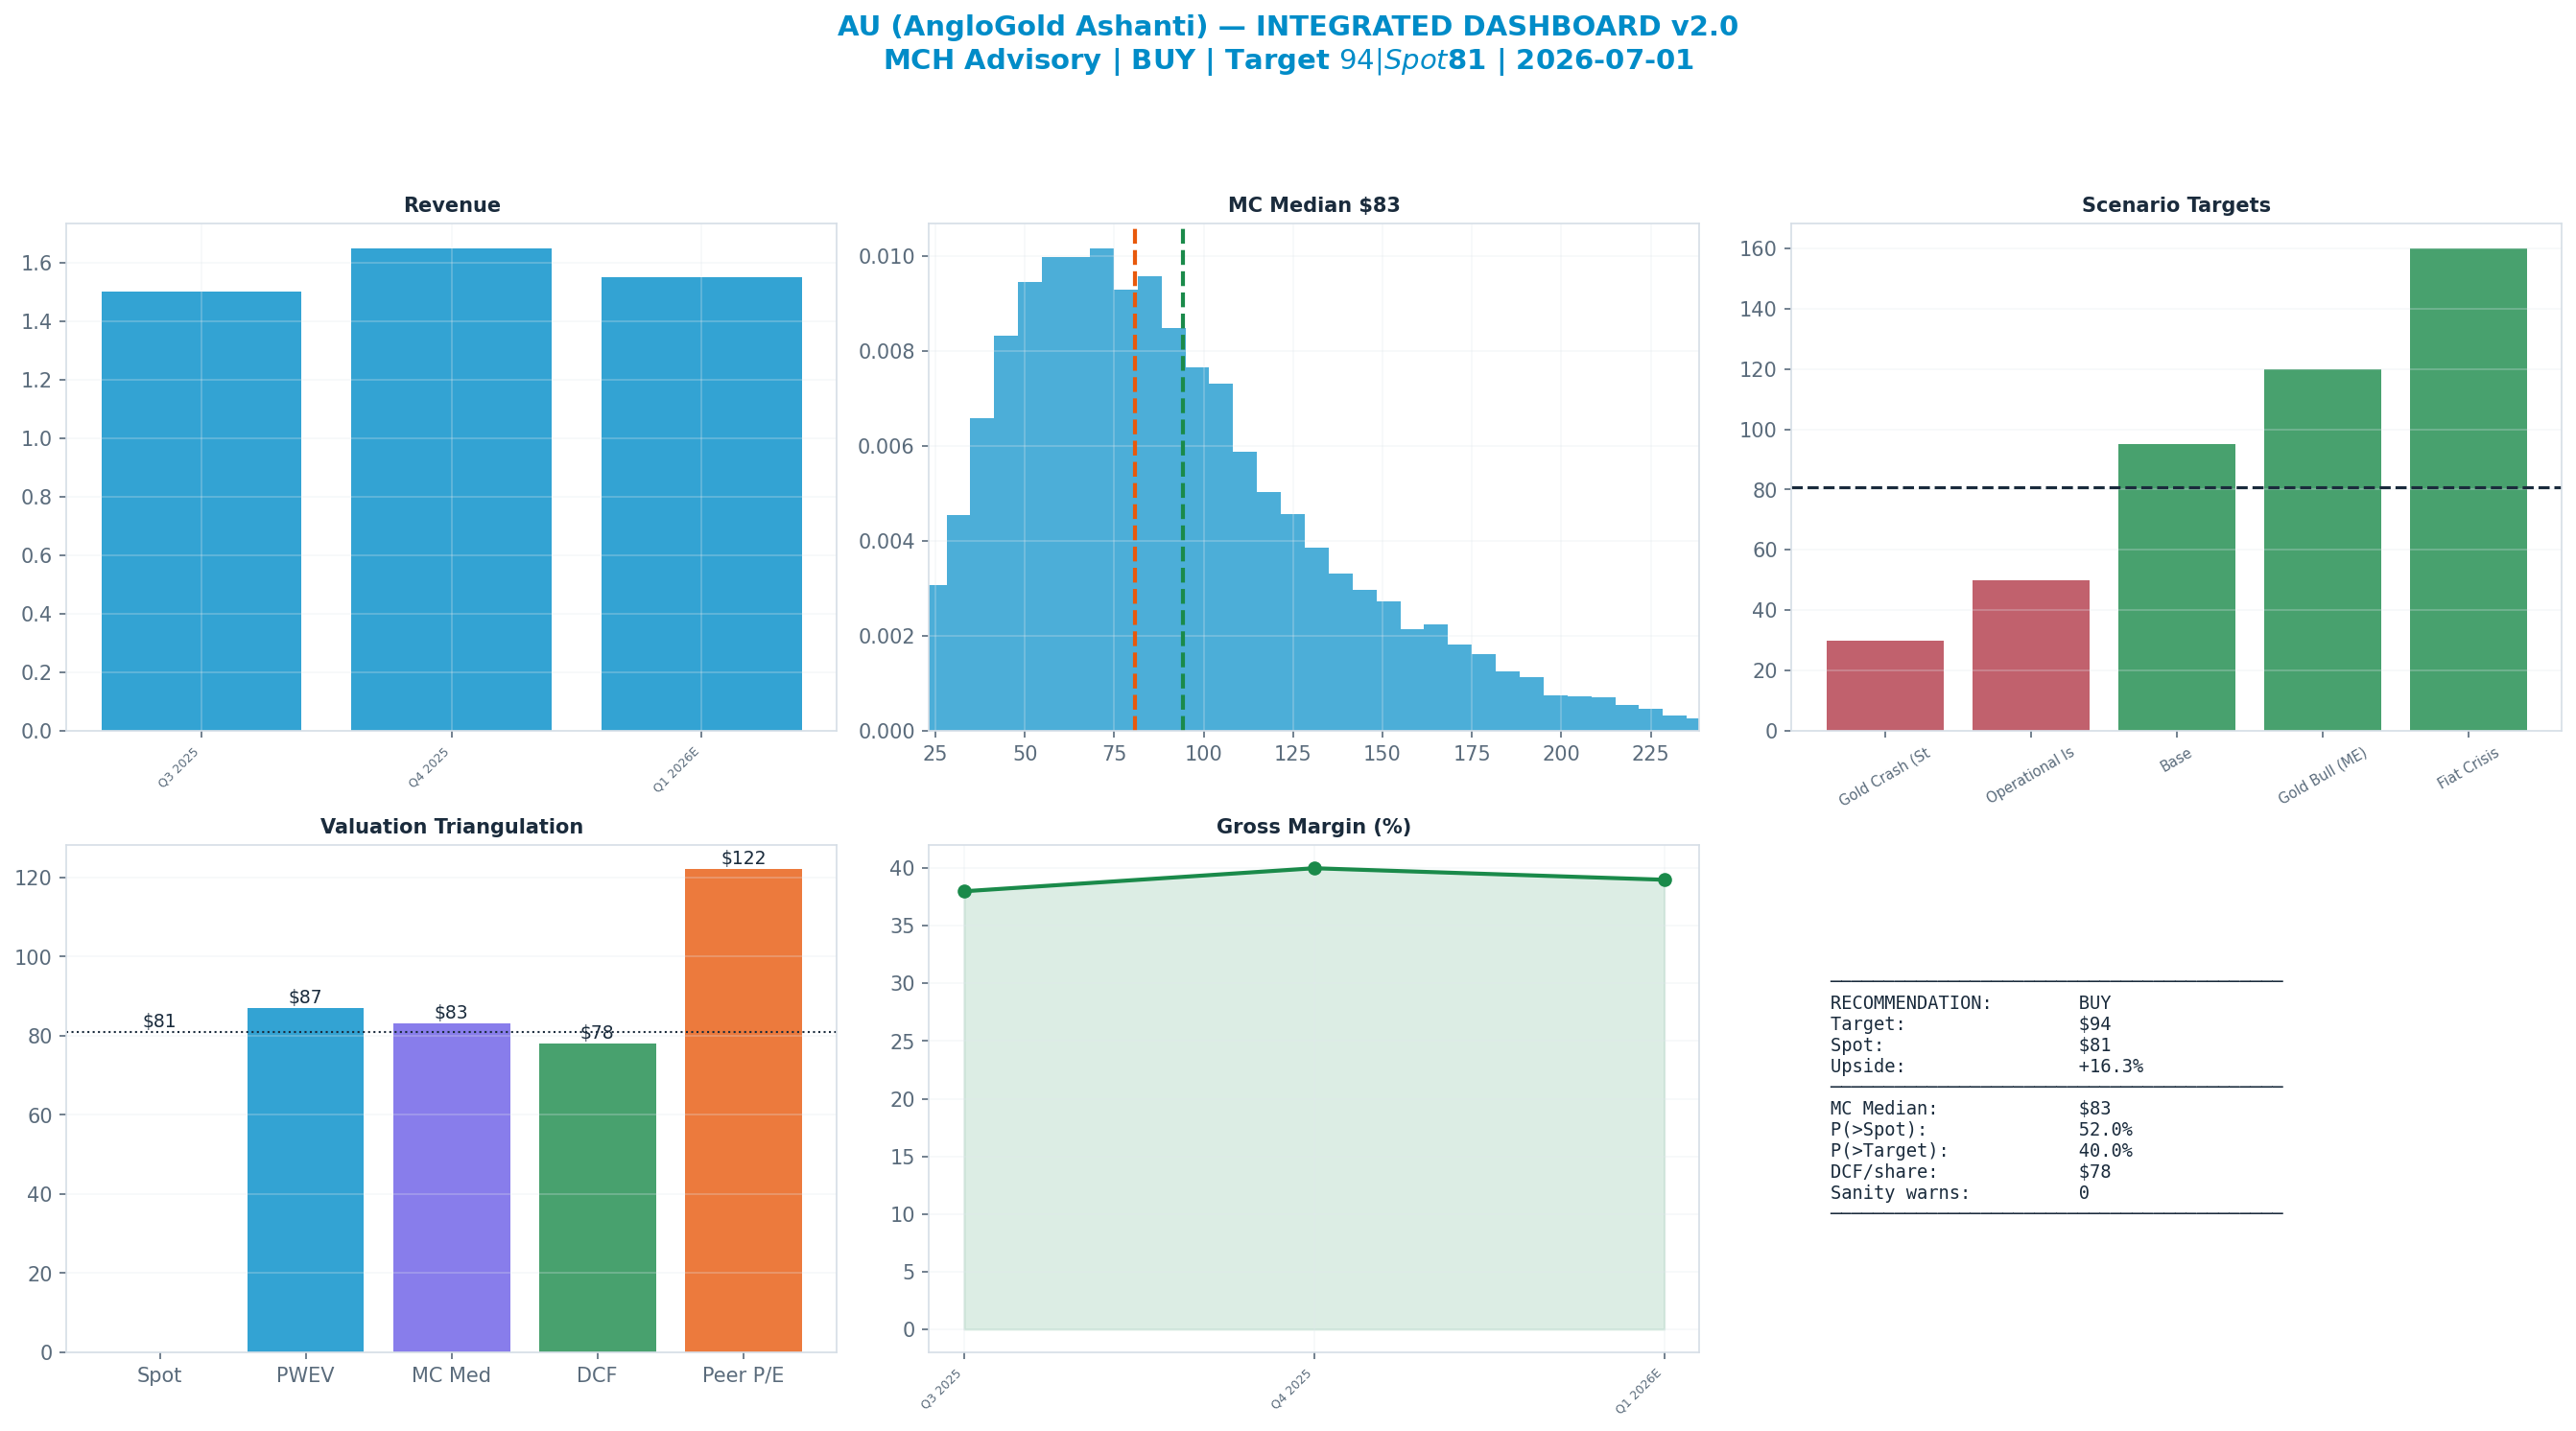
The dashboard below is the whole argument on one page: spot ($81) against each valuation anchor, the scenario tree, technicals and the options-implied move.
Anti-Thesis (The Real Bear Case)
The structural case — 'Gold Crash (Structural)' (20%) — targets $30, -63% vs spot. This sits below the 52-week low — a genuine structural impairment, not a mild pullback.
Key Debate
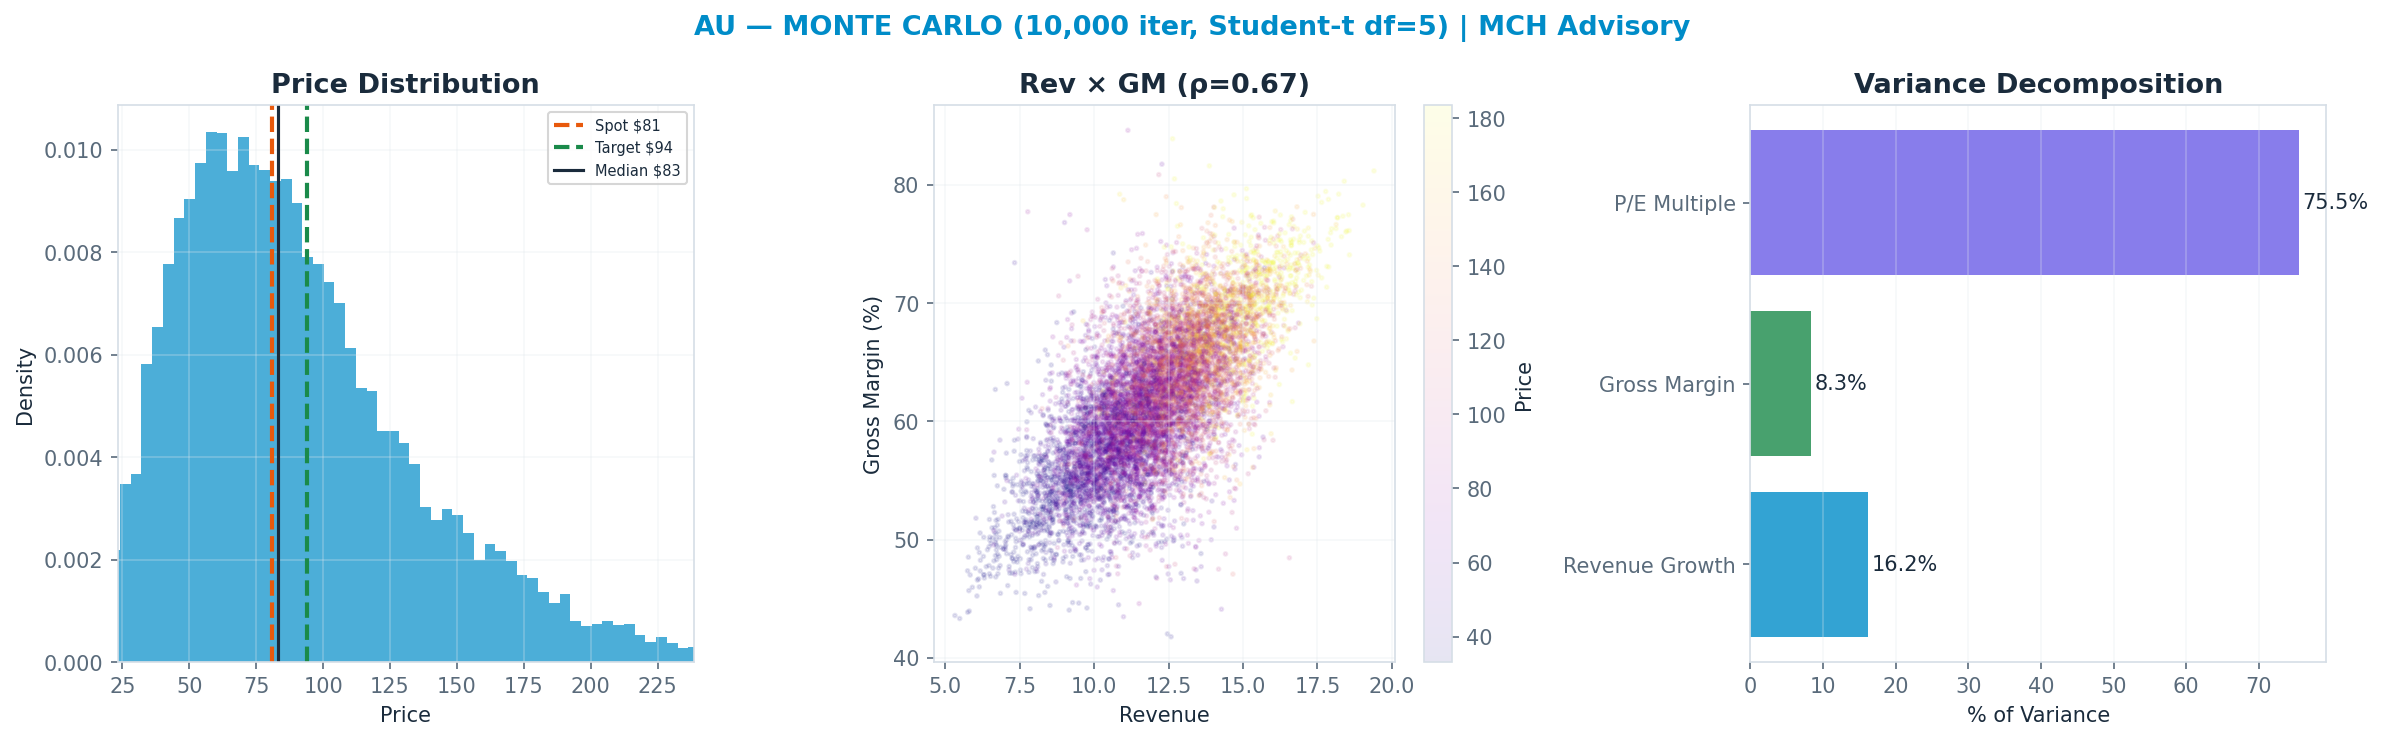
P/E Multiple explains 76% of Monte Carlo outcome variance — i.e. value is set by the multiple the market will pay, a rate/sentiment regime bet as much as an earnings bet.
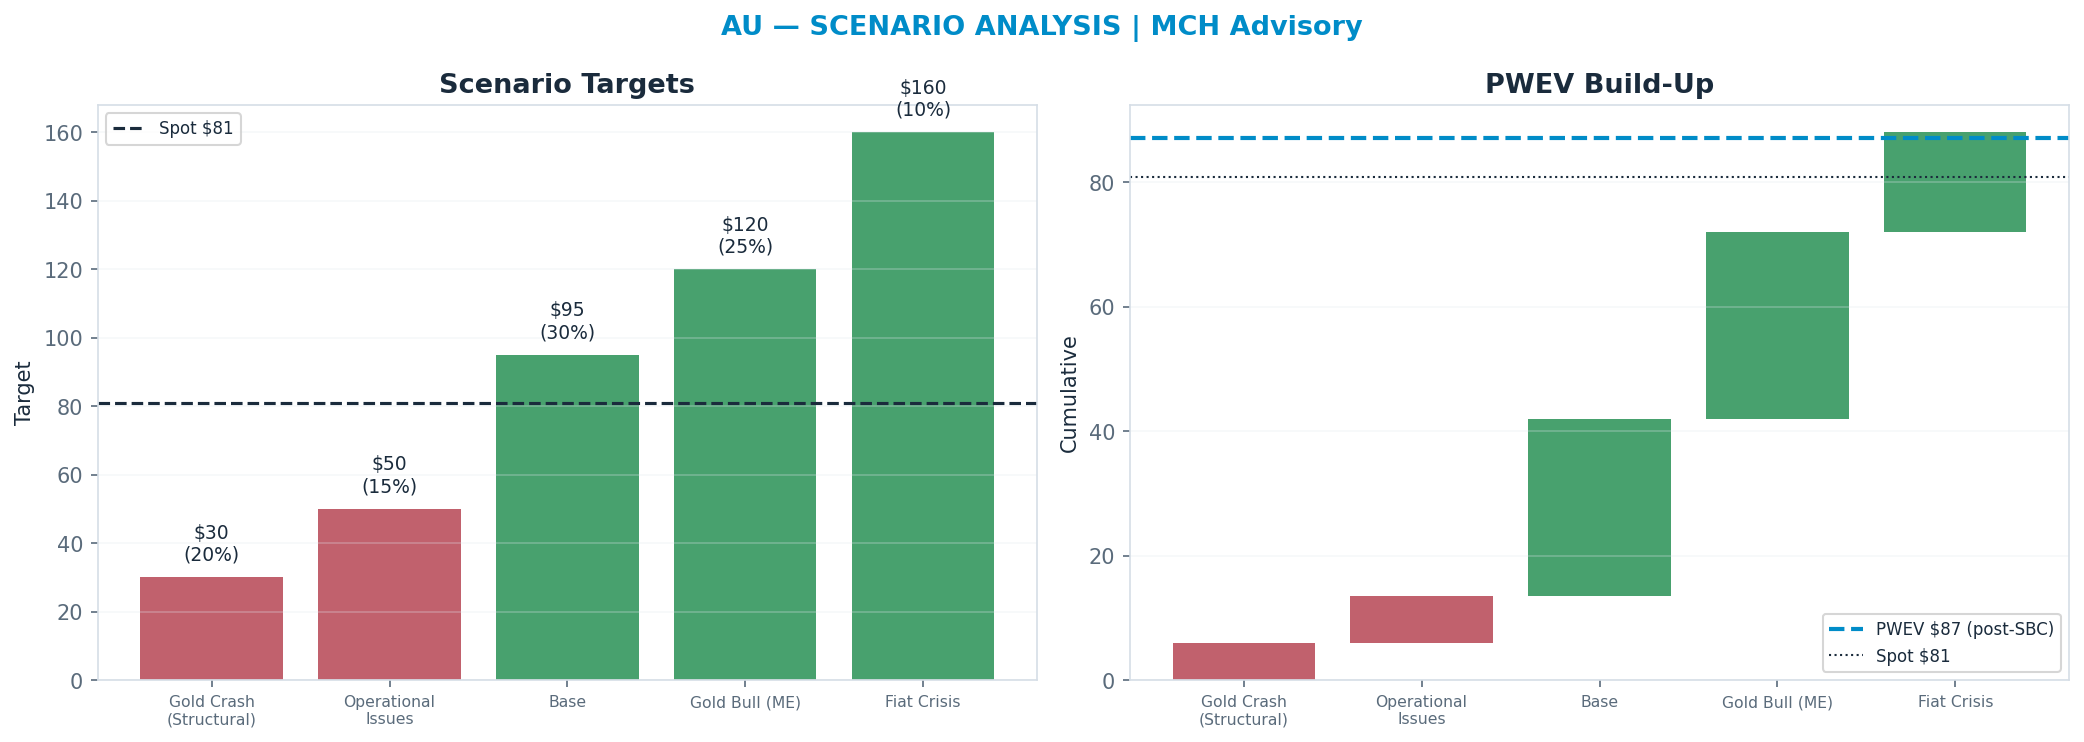
Scenario Analysis
The tree runs from a structural 'Gold Crash (Structural)' downside ($30) to a 'Fiat Crisis' bull case ($160); the probability-weighted blend (PWEV $87) is +8% versus spot.
| Scenario | Probability | Target | Return |
|---|---|---|---|
| Gold Crash (Structural) | 20% | $30 | -63% |
| Operational Issues | 15% | $50 | -38% |
| Base | 30% | $95 | +17% |
| Gold Bull (ME) | 25% | $120 | +48% |
| Fiat Crisis | 10% | $160 | +98% |
| Probability-Weighted (PWEV, after SBC dilution) | — | $87 | +8% |
SBC charge: scenario targets are gross per-share prices; the PWEV is reduced by one year of stock-based-compensation dilution (1.0% of shares, on SBC ≈ 1% of revenue), trimming the gross PWEV of $88 to $87 (-1.0%). SBC is charged once, as dilution — never also deducted from FCF.
Scenario rationale — what each probability buys (the driver path behind every target):
- Gold Crash (Structural) (20%, $30). A real-rates regime shift (hawkish Fed, strong USD, central-bank buying stalls) drives gold toward ~$1,900-2,100/oz. At that price the higher-AISC African ounces fall near or below cost, group cash margin roughly halves, and FCF turns thin while sustaining capex is non-discretionary. The multiple de-rates toward ~3.5-4x EV/EBITDA as the market prices depletion and jurisdiction risk; target sits below the 52-week low — a genuine structural impairment, not a pullback. Drivers — gold_price: ~$1,900-2,100/oz; aisc: ~$1,550/oz; production_moz: ~2.7; op_margin: ~30%; multiple: ~3.5-4x EV/EBITDA.
- Operational Issues (15%, $50). Gold holds near current levels but company-specific execution disappoints — AISC inflates above $1,700/oz on power, labour and royalty creep, and attributable ounces miss on grade decline, strikes or Sukari ramp delays. Margins compress despite a firm gold price and the multiple stays capped as the market discounts management credibility and reserve life. Drivers — gold_price: ~$2,600/oz; aisc: ~$1,750/oz; production_moz: ~2.5; op_margin: ~40%; multiple: ~4x EV/EBITDA.
- Base (30%, $95). Gold sustains ~$2,650-2,800/oz, group production holds ~2.8Moz with Sukari accretive, and AISC contained ~$1,550/oz, leaving a wide cash margin and strong FCF that funds dividends and de-leveraging. The multiple normalises toward ~5x EV/EBITDA (~mid-cycle P/NAV ~1.0x) as the market rewards delivery and capital discipline. Drivers — gold_price: ~$2,700/oz; aisc: ~$1,550/oz; production_moz: ~2.8; op_margin: ~50%; multiple: ~5x EV/EBITDA.
- Gold Bull (ME) (25%, $120). Escalating Middle-East / geopolitical risk and sustained central-bank buying push gold to ~$3,200-3,500/oz. With AISC broadly fixed, the incremental price flows almost entirely to cash margin; FCF inflects sharply and the equity re-rates toward ~6-6.5x EV/EBITDA (P/NAV >1.1x) on safe-haven demand and rising payout capacity. Drivers — gold_price: ~$3,300/oz; aisc: ~$1,600/oz; production_moz: ~2.8; op_margin: ~58%; multiple: ~6-6.5x EV/EBITDA.
- Fiat Crisis (10%, $160). A monetary-debasement / sovereign-debt-stress regime drives gold above ~$4,000/oz as investors flee fiat. Cash margins reach extremes (>$2,400/oz), FCF and dividends balloon, and gold miners re-rate as a scarce hard-asset play; multiple expands toward ~7x EV/EBITDA. Cost inflation eventually follows but lags the price move, so the margin windfall persists for several quarters. Drivers — gold_price: >$4,000/oz; aisc: ~$1,700/oz; production_moz: ~2.8; op_margin: >60%; multiple: ~7x EV/EBITDA.
Valuation Triangulation
Five anchors — but read them with their basis in mind. The Monte Carlo, the DCF terminal, and the peer re-rate all key off a market multiple, so they are not fully independent; only the discounted cash flows themselves are genuinely multiple-free. The discipline is to read the spread and weight the cash-based view, not to treat five numbers as five independent votes.
| Method | Basis | Fair Value | vs Spot |
|---|---|---|---|
| Monte Carlo median (Student-t + regime) | multiple | $83 | +3% |
| Peer P/E re-rate | multiple | $122 | +51% |
| Peer EV/Revenue re-rate | multiple | $67 | -17% |
| Scenario PWEV | multiple | $87 | +8% |
| DCF (5-year + terminal) | cash flow + terminal × | $78 | -3% |
| Triangulated (weighted) | — | $87 | +7% |
Monte Carlo — the distribution, not a point
10,000 paths, Student-t shocks (fat tails) with a regime-switching overlay. The median lands at $83 and 52% of paths finish above spot. The variance decomposition shows the p/e multiple is the dominant swing factor (76% of variance). Value is a multiple bet: fundamentals move the answer far less than the rating does.
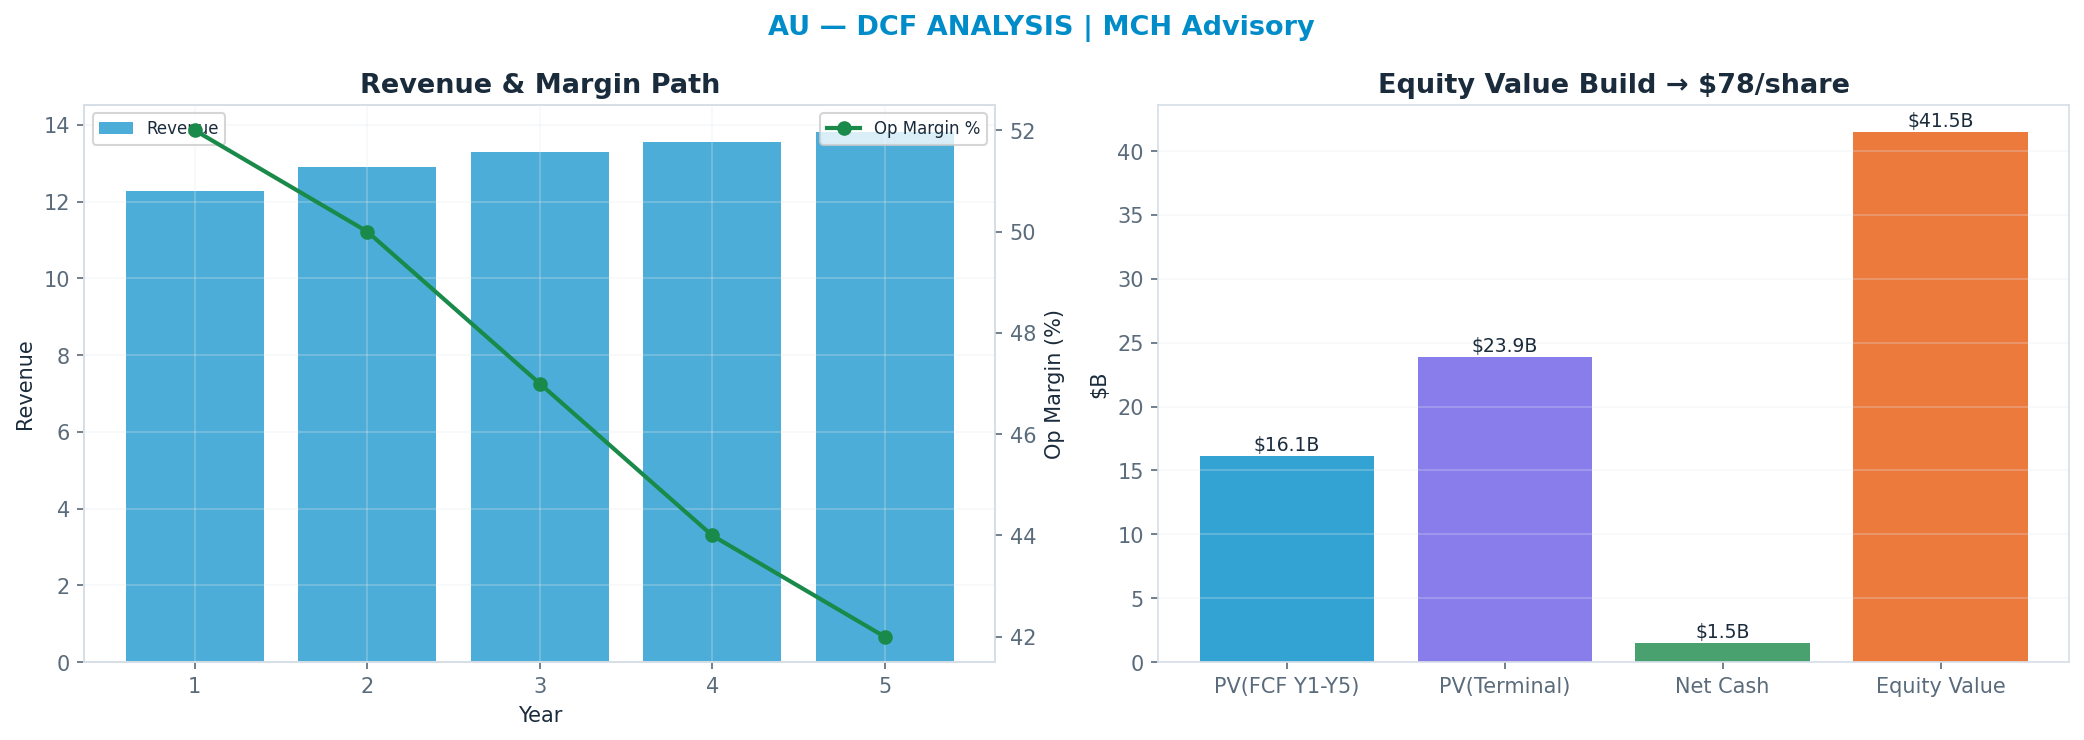
DCF — the cash-flow anchor
Independent of the market multiple: a 5-year path, WACC 11.0%, 10x terminal FCF multiple → $78. This anchor is deliberately the heaviest (41%): it is the valuation least hostage to the current multiple regime.
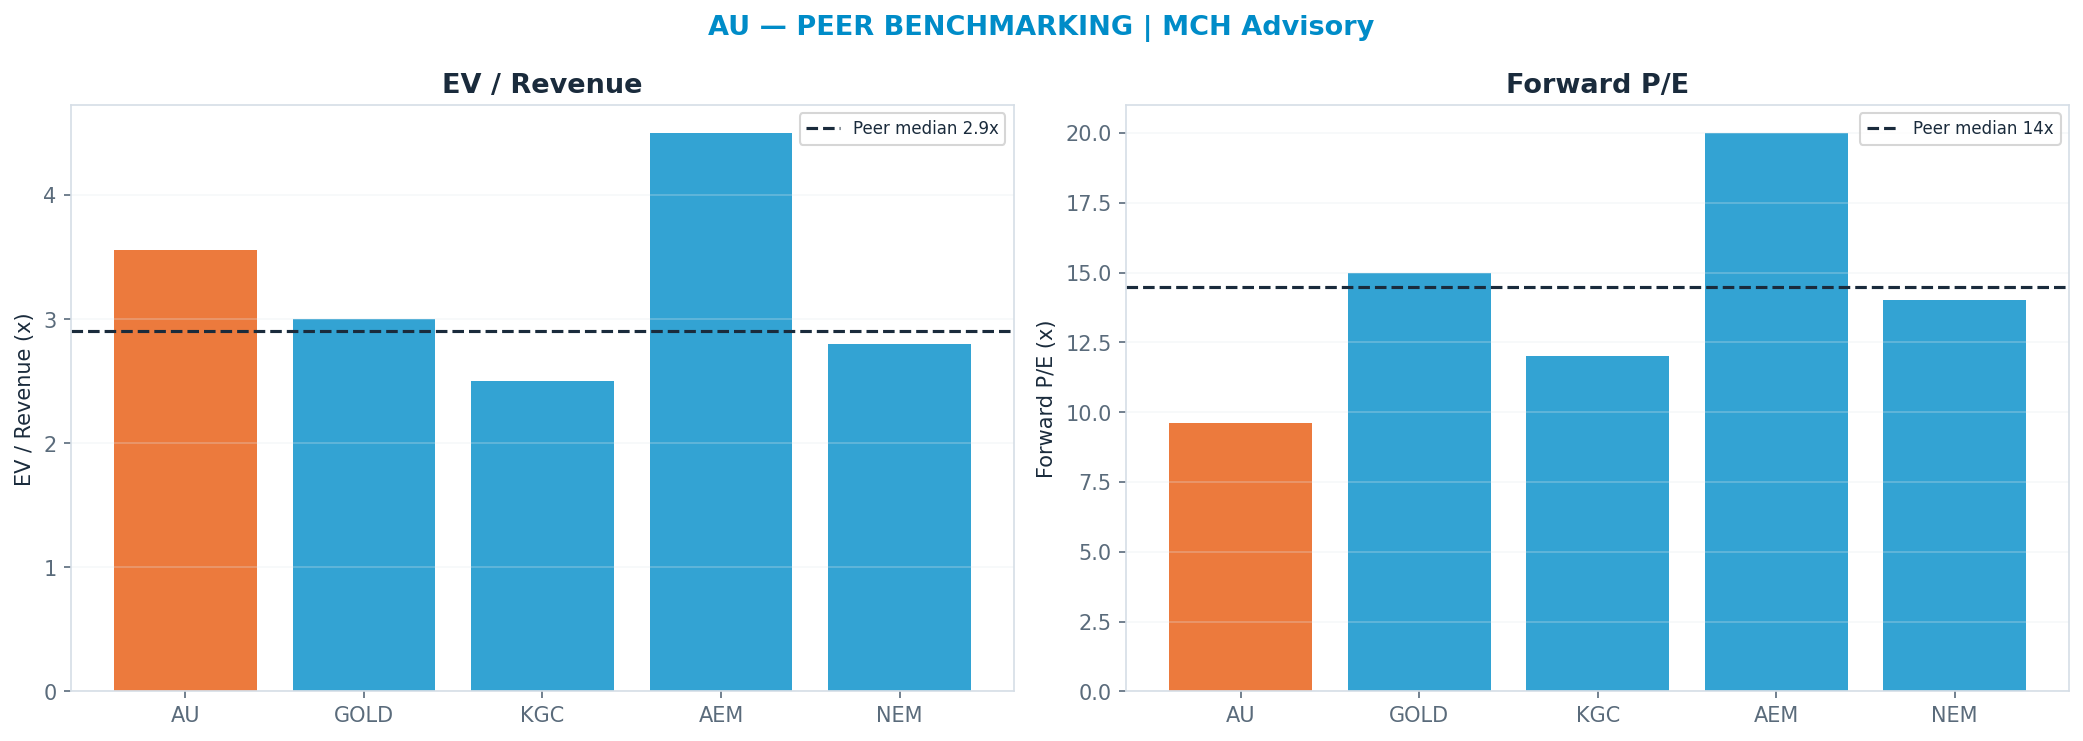
Peer benchmarking — relative value
Against the peer cohort, re-rating to the peer-median forward multiple (P/E 14.5x) implies $122. A premium is only justified by superior growth/margins; otherwise it is multiple risk. Weighted just 12% so the market's mood does not drive the fair value.
Across all anchors the spread is wide (genuine disagreement — low valuation confidence).
Revenue-Segment Breakdown
The company-specific drivers behind the valuation — each segment carries its own growth, margin, multiple and capex intensity. (Tags: FACT reported · ESTIMATE from disclosures · INFERENCE judgment.)
| Segment | Revenue | Mix | Growth | Op margin | Multiple | Capex % | Tag |
|---|---|---|---|---|---|---|---|
| Africa (Continental Africa) | $5.3B | 48% | 5% | 52% | 4.5x | 18% | FACT/ESTIMATE |
| Americas | $4.0B | 36% | 7% | 50% | 5.5x | 20% | FACT/ESTIMATE |
| Australia | $1.7B | 16% | 2% | 48% | 5.0x | 22% | FACT/ESTIMATE |
Named Exposures
Gold price sensitivity (ESTIMATE/INFERENCE)
| Dimension | Assessment |
|---|---|
| Spot realised | ~$2,650-2,800/oz realised assumed in TTM revenue base; group AISC ~$1,550/oz leaves a wide ~$1,100-1,250/oz cash margin |
| Margin leverage | Because AISC is broadly fixed per ounce in the near term, revenue and FCF gear into the gold price; a move in price flows ~dollar-for-ounce to operating cash flow |
| +$200/oz scenario | ~$0.55-0.6B incremental EBITDA on ~2.8Moz (high-conversion; minimal incremental cost) — supports multiple expansion as FCF inflects |
| -$200/oz scenario | ~$0.55-0.6B EBITDA erosion; high-cost African ounces near AISC compress to thin/negative margin first |
| Macro drivers | Real interest rates (inverse), USD direction (inverse), central-bank net buying (EM reserve diversification), ETF flows, and geopolitical/fiat-debasement hedging demand |
| Cost pass-through | Gold is USD-priced; ex-US cost base (ZAR/ARS/AUD/BRL/GHS) means local-currency weakness can cushion AISC in USD terms — a partial natural hedge |
Operating & jurisdiction risk (FACT/ESTIMATE/INFERENCE)
| Dimension | Assessment |
|---|---|
| AISC inflation | Diesel, reagents, labour and royalty creep push AISC; sector AISC has risen high-single-digit % p.a. — erodes the gold-price tailwind if unchecked |
| Jurisdiction concentration | ~80%+ of production in Africa/Argentina/Egypt — exposure to resource nationalism, royalty hikes, permit risk, power instability (Ghana/Tanzania) and FX controls (Argentina) |
| Grade & reserve depletion | Mature assets face declining head grade and reserve-life pressure; sustaining capex and exploration required just to hold production flat — depletion is structural, not cyclical |
| Operational disruption | Strikes, load-shedding, safety stoppages, seismicity (Obuasi/Sunrise Dam underground) and weather can cut attributable ounces and spike unit costs |
| Capital allocation | Centamin/Sukari integration execution, project capex overruns, and the trade-off between dividends/buybacks vs. growth capex are key value swings |
| Domicile | Primary listing moved to NYSE / UK plc domicile (2023-24), reducing South-Africa-specific discount but not asset-level jurisdiction risk |
Industry Context — Gold & Precious Metals
This name sits in the Gold & Precious Metals as a supplier / gold miner (AngloGold Ashanti; African + Americas/Australia portfolio, higher jurisdiction risk). Price-taker on gold with HIGHER operating and country-risk beta: thinner/less-diversified margin buffer and African exposure (power, currency, permitting, security) mean a given gold move flows through to AU's per-ounce margin and equity with more amplification — bigger upside in a gold bull, sharper drawdown in a crash or on a single-asset operational stumble. (INFERENCE) Its scenarios are not guessed in isolation — they inherit a single, shared view of the cluster's driver cycle, so the names that depend on the same event are mutually consistent.
Value chain: AU (supplier / gold miner (AngloGold Ashanti; African + Americas/Australia portfolio, higher jurisdiction risk)) · NEM (supplier / gold miner (Newmont; largest producer, diversified across tier-1 jurisdictions, copper/by-product optionality))
| Shared state | Capex path | House view | This name implies |
|---|---|---|---|
| Gold Crash | gold falls sharply (e.g. real rates rise / hard landing avoided / risk-on rotation out of bullion) | 22% | 20% |
| Cost / Operational Pressure | gold flat-to-firm but AISC inflation / mine-specific issues erode margin | 18% | 15% |
| Base — Elevated Gold | gold holds near current elevated levels; CB buying steady, real rates range-bound | 35% | 30% |
| Gold Bull / Fiat Hedge | gold breaks higher (sustained CB accumulation, fiat-debasement / monetary-disorder bid, falling real rates) | 25% | 35% |
On the cluster's key downside — Gold Crash (gold falls sharply (e.g. real rates rise / hard landing avoided / risk-on rotation out of bullion)) — this name implies 20% vs the cluster house view of 22% (in line with the house). The cluster's full cross-stock reconciliation governs that the names which ride the same capex cycle assign it comparable odds.
Structure: Gold Price Drivers — Gold is driven by (1) real interest rates — the dominant inverse driver, since gold yields nothing so falling/negative real rates lower its opportunity cost; (2) central-bank buying — structural EM-CB accumulation and reserve diversification away from USD; (3) the US dollar — gold is USD-priced, so a weaker DXY is a tailwind; (4) geopolitics / safe-haven and fiat-debasement demand. (FACT/INFERENCE) Cost Curve Aisc — Margin = gold price − AISC. AISC has inflated structurally (labour, energy, diesel, reagents, declining ore grades, deeper/harder mining) so the industry cost curve has shifted up; the marginal ounce now costs materially more than a decade ago. AISC inflation is the silent killer of the 'leverage to gold' thesis — if costs rise with the gold price, the margin expansion investors expect does not fully materialise. (FACT/INFERENCE) Low Multiples — Gold miners trade at persistently LOW multiples (EV/EBITDA, P/NAV) versus broad equities because: capital intensity and long, uncertain mine-build cycles; depleting reserves that must be continuously and expensively replaced; jurisdiction / political / nationalisation / permitting risk (acute for AU's African assets); a poor industry track record of capital allocation (value-destructive M&A, cost overruns, dilution); and no terminal-value compounding — an ounce mined is an ounce gone. The equity is a wasting, operationally-levered claim on a commodity it cannot control. (INFERENCE)
Model Appendix
DCF — line items
| Year | Revenue | Op income | − Capex | + D&A | FCF | PV(FCF) |
|---|---|---|---|---|---|---|
| FY+1 | $12B | $6B | $2B | $2B | $5B | $4B |
| FY+2 | $13B | $6B | $2B | $2B | $5B | $4B |
| FY+3 | $13B | $6B | $3B | $2B | $4B | $3B |
| FY+4 | $14B | $6B | $3B | $2B | $4B | $3B |
| FY+5 | $14B | $6B | $3B | $3B | $4B | $2B |
| Terminal | — | — | — | — | $4B × 10x | $24B |
FCF is bridged: NOPAT + D&A − Capex − ΔNWC (capex intensity 19% of revenue, weighted from the segments) — not a single conversion fudge.
WACC 11.0% · Σ PV(FCF) $16B + PV(terminal) $24B = EV $40B; + net cash → equity $42B ÷ diluted shares 0.53B = $78/share (exit-multiple terminal).
- Gordon (perpetuity-growth) terminal at 2.5% → $87/share — a genuinely non-multiple, cash-based cross-check; the exit-multiple and Gordon values bracket the terminal-value risk.
- Incremental ROIC on the forecast capex ≈ -3% vs WACC 11% → below WACC — the incremental build is value-dilutive.
Peer set
| Peer | EV/Rev | Fwd P/E | Growth | Op margin |
|---|---|---|---|---|
| GOLD | 3.0x | 15x | 5% | 25% |
| KGC | 2.5x | 12x | 8% | 22% |
| AEM | 4.5x | 20x | 8% | 28% |
| NEM | 2.8x | 14x | 10% | 18% |
| Median | 2.9x | 14.5x | — | — |
Peer-median fwd P/E → $122; EV/Rev → $67.
Weighted fair-value math
| Anchor | Value | Weight | Contribution |
|---|---|---|---|
| DCF | $78 | 41% | $32 |
| Scenario PWEV | $87 | 29% | $26 |
| Monte Carlo median | $83 | 18% | $15 |
| Peer P/E | $122 | 12% | $14 |
| Triangulated | — | 100% | $87 |
Sensitivity
DCF/share — WACC × terminal multiple
| WACC \ Term× | 7.0x | 8.5x | 10.0x | 11.5x | 13.0x |
|---|---|---|---|---|---|
| 9% | $69 | $77 | $84 | $91 | $99 |
| 10% | $67 | $74 | $81 | $88 | $95 |
| 11% | $65 | $71 | $78 | $85 | $92 |
| 12% | $62 | $69 | $75 | $82 | $88 |
| 13% | $60 | $67 | $73 | $79 | $85 |
DCF/share — revenue CAGR Δ × op-margin Δ
| CAGRΔ \ MgnΔ | -3.0pp | -1.5pp | +0.0pp | +1.5pp | +3.0pp |
|---|---|---|---|---|---|
| -3.0pp | $67 | $70 | $72 | $74 | $77 |
| -1.5pp | $70 | $72 | $75 | $77 | $80 |
| +0.0pp | $73 | $75 | $78 | $81 | $83 |
| +1.5pp | $76 | $79 | $81 | $84 | $87 |
| +3.0pp | $79 | $82 | $85 | $88 | $91 |
Tornado — DCF/share swing by driver (widest first)
| Driver | Low | High | Swing |
|---|---|---|---|
| Terminal × ±15% | $71 | $85 | $13 |
| Revenue CAGR ±3pp | $72 | $85 | $13 |
| Op margin ±3pp | $73 | $83 | $11 |
| WACC ±1pp | $75 | $81 | $6 |
| FCF conversion ±10% | $78 | $78 | $0 |
Company lever — SoP/share vs Australia multiple (AI re-rating) (base 5.0x)
| Multiple | 3.5x | 4.2x | 5.0x | 5.8x | 6.5x |
|---|---|---|---|---|---|
| SoP/share | $105 | $108 | $110 | $113 | $115 |
Load-Bearing Assumptions
DCF: WACC 11%, terminal multiple 10×, FY+5 revenue $14B. Triangulation leans 41% on DCF, 29% on PWEV.
Reasons the Thesis Could Fail (Falsifiable)
The valuation is multiple-dependent (76% of variance); a de-rating toward the DCF anchor ($78) implies -3%.
Fact / Inference / Speculation
- FACT: Spot $81; 52-week range $41–$125; engine rating HOLD; base-case target $94 (+16%).
- INFERENCE: Triangulated FV $87 (+7%). P/E Multiple explains 76% of Monte Carlo outcome variance — i.e. value is set by the multiple the market will pay, a rate/sentiment regime bet as much as an earnings bet.
- SPECULATION: At current prices the embedded bet is that the multiple holds or expands — P/E Multiple carries 76% of outcome variance.
Recommendation: HOLD
Balanced: triangulated fair value $87 (+7% vs spot); the outcome hinges on P/E Multiple. The debate is P/E Multiple (76% of variance) — fundamentally a multiple/regime call. SBC runs —M TTM (disclosed in the appendix).