Rating: HOLD
| Metric | Value |
|---|---|
| Current Price | $238 |
| Triangulated Fair Value | $239 |
| 12-mo Scenario PWEV | $234 |
| Implied Return | +1% |
| Forward P/E | 9.2x |
| Market Cap | $59B |
| 52-Week Range | $185 – $240 |
Methodology: Valuation triangulated across five independent anchors — Monte Carlo (Student-t + regime switching), an independent DCF, peer re-rating, a sum-of-parts, and a scenario-weighted PWEV. Figures reconciled to Alpha Vantage 2026-06-27. Each chart below sits with the part of the thesis it evidences.
Investment Thesis
The bull case — 'Bull — Re-Rate' (8% weight) — targets $413, +74% vs spot. It needs Gross Margin to surprise to the upside.
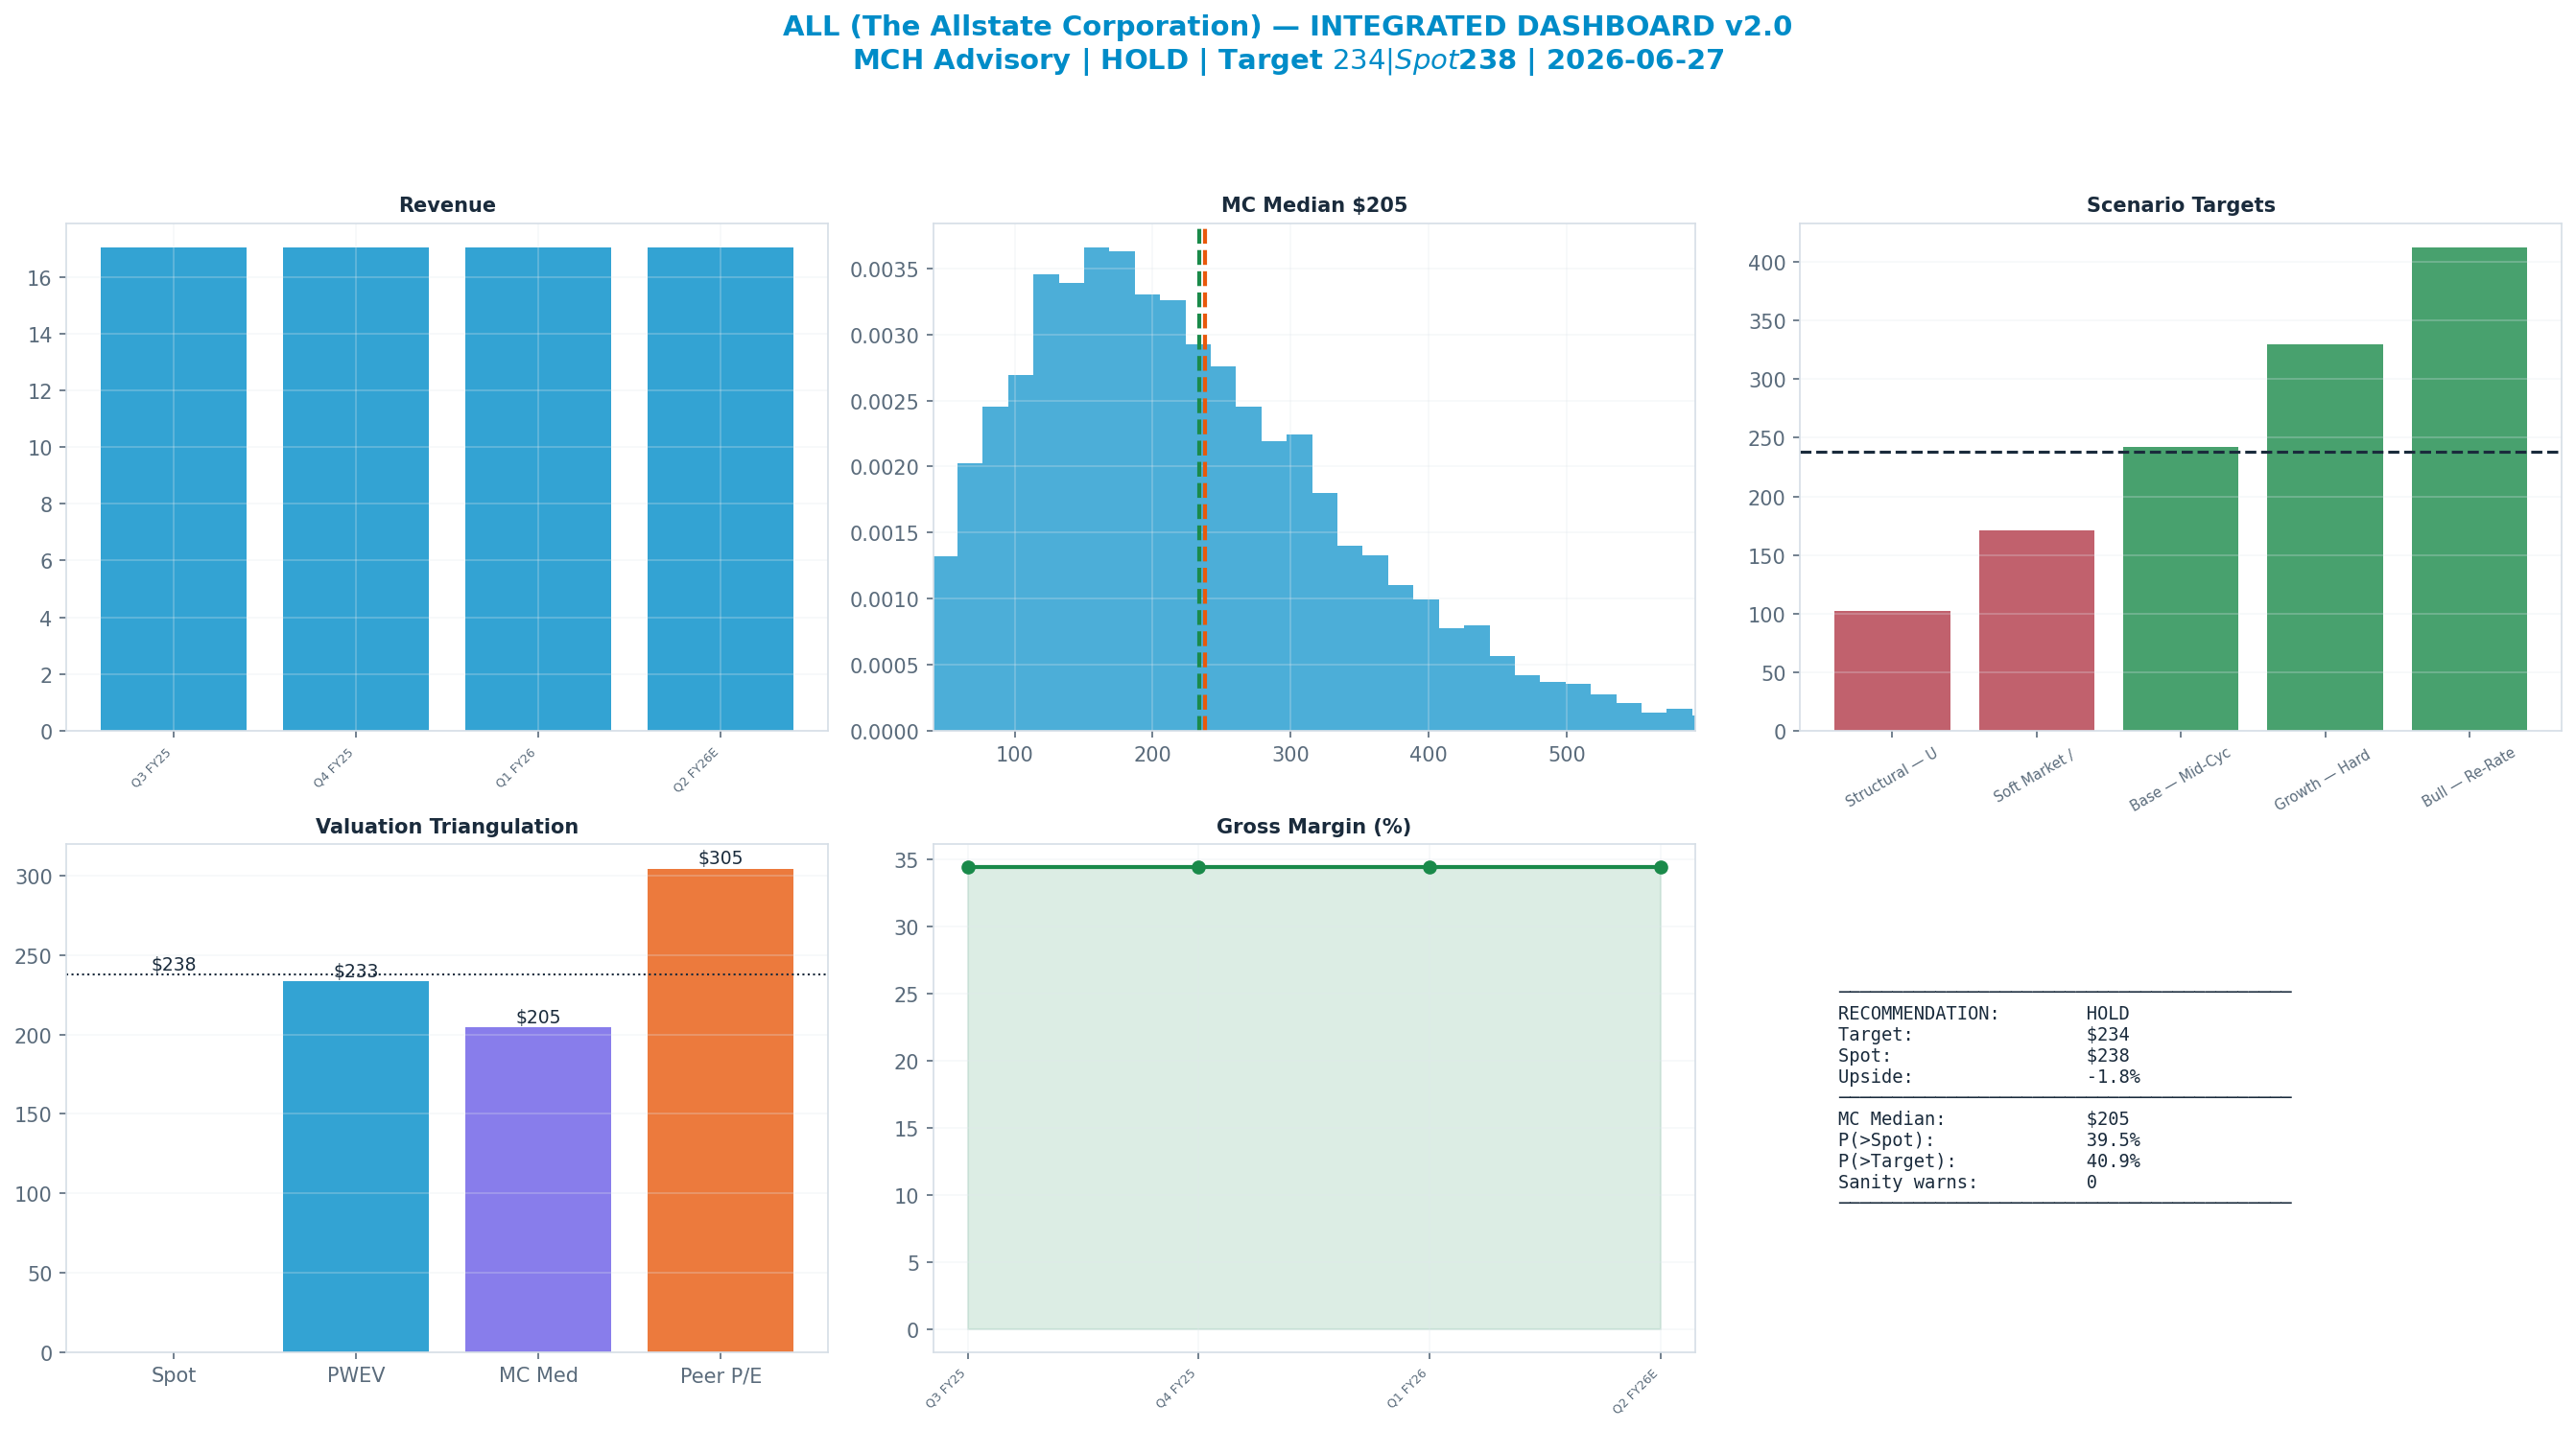
The dashboard below is the whole argument on one page: spot ($238) against each valuation anchor, the scenario tree, technicals and the options-implied move.
Anti-Thesis (The Real Bear Case)
The structural case — 'Structural — Underwriting / Reserve / Catastrophe Reset' (20%) — targets $103, -57% vs spot. This sits below the 52-week low — a genuine structural impairment, not a mild pullback.
Key Debate
Gross Margin explains 63% of Monte Carlo outcome variance — the single variable that decides which side is right.
Earnings-Call Disconfirmation & Sentiment
Derived signals from the MCH market-data store (Alpha Vantage transcripts + news). Quantitative tone only — a disconfirmation flag, not a substitute for reading the call.
Management vs analyst tone (2026Q1): management +0.39 vs analyst floor +0.00 → delta +0.39 (n=24 mgmt / 16 Q&A; 50th pctile across the S&P book, z -0.0).
Flag: TYPICAL — management-vs-analyst tone within the normal cross-sectional range.
| Quarter | Mgmt | Analyst | Delta |
|---|---|---|---|
| 2026Q1 | +0.39 | +0.00 | +0.39 |
| 2025Q4 | +0.43 | +0.10 | +0.32 |
| 2025Q3 | +0.55 | +0.36 | +0.19 |
| 2025Q2 | +0.51 | +0.29 | +0.22 |
News (last 365d, 1000 articles): avg ticker sentiment +0.17 (bullish 8% / bearish 1%)
Scenario Analysis
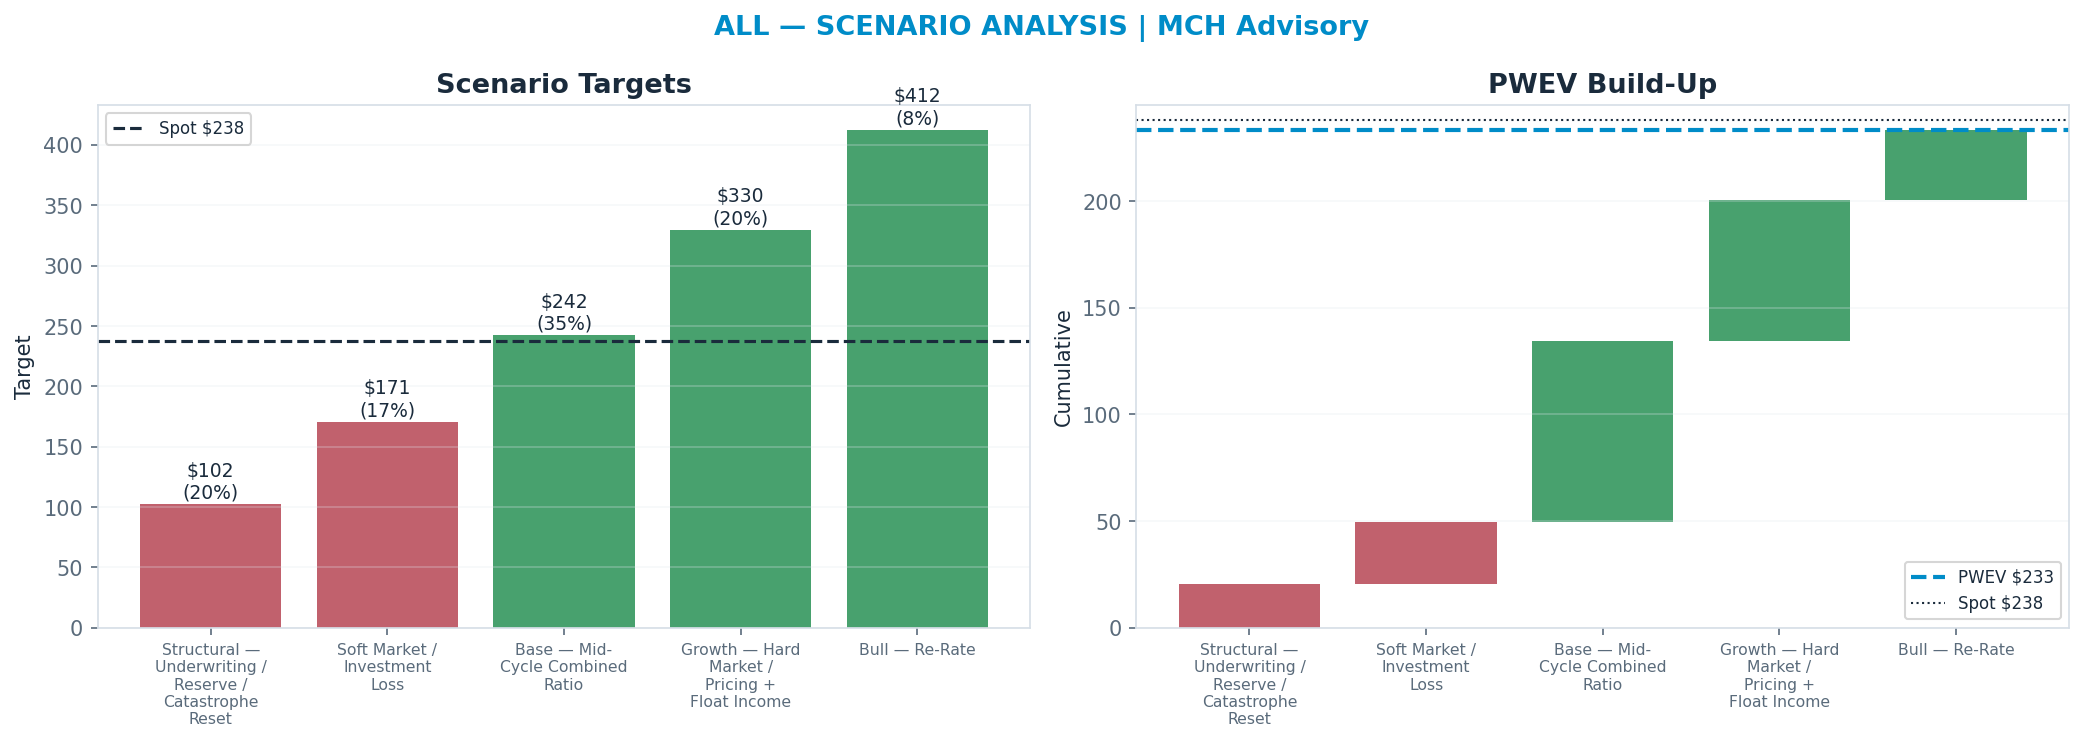
The tree runs from a structural 'Structural — Underwriting / Reserve / Catastrophe Reset' downside ($103) to a 'Bull — Re-Rate' bull case ($413); the probability-weighted blend (PWEV $234) is -2% versus spot.
| Scenario | Probability | Target | Return |
|---|---|---|---|
| Structural — Underwriting / Reserve / Catastrophe Reset | 20% | $103 | -57% |
| Soft Market / Investment Loss | 17% | $175 | -27% |
| Base — Mid-Cycle Combined Ratio | 35% | $242 | +2% |
| Growth — Hard Market / Pricing + Float Income | 20% | $327 | +38% |
| Bull — Re-Rate | 8% | $413 | +74% |
| Probability-Weighted (PWEV) | — | $234 | -2% |
Scenario rationale — what each probability buys (the driver path behind every target):
- Structural — Underwriting / Reserve / Catastrophe Reset (20%, $103). Structural impairment — underwriting / reserve / catastrophe reset: earnings AND the multiple compress together. Target sits below the 52-week low by construction. Drivers — implied_target: 102.8; probability: 0.2.
- Soft Market / Investment Loss (17%, $175). Cyclical downturn — underwriting margin (combined ratio) + premium growth + float investment income + reserves weakens for 1–2 years before normalising. Drivers — implied_target: 174.58; probability: 0.17.
- Base — Mid-Cycle Combined Ratio (35%, $242). Mid-cycle — normalised underwriting margin (combined ratio) + premium growth + float investment income + reserves; disciplined capital allocation; steady returns. Drivers — implied_target: 242.47; probability: 0.35.
- Growth — Hard Market / Pricing + Float Income (20%, $327). Upside — hard market + pricing lifts earnings above mid-cycle; the multiple expands modestly. Drivers — implied_target: 327.33; probability: 0.2.
- Bull — Re-Rate (8%, $413). Upside tail — sustained tight conditions or a structural re-rate on hard market + pricing. Drivers — implied_target: 413.41; probability: 0.08.
Valuation Triangulation
Five anchors — but read them with their basis in mind. The Monte Carlo, the DCF terminal, and the peer re-rate all key off a market multiple, so they are not fully independent; only the discounted cash flows themselves are genuinely multiple-free. The discipline is to read the spread and weight the cash-based view, not to treat five numbers as five independent votes.
| Method | Basis | Fair Value | vs Spot |
|---|---|---|---|
| Monte Carlo median (Student-t + regime) | multiple | $206 | -14% |
| Peer P/E re-rate | multiple | $305 | +28% |
| Peer EV/Revenue re-rate | multiple | $391 | +64% |
| Scenario PWEV | multiple | $234 | -2% |
| Justified P/B (ROE-based) | book value × ROE | $688 | +189% |
| Triangulated (weighted) | — | $239 | +1% |
DCF excluded from the weighted blend — diverges >55% from the Monte-Carlo / scenario core. For a high-leverage equity the per-share DCF (enterprise value less large net debt) is hypersensitive to the terminal multiple; a peer re-rate across heterogeneous margins is apples-to-oranges. Shown above for reference; the blend leans on the multiple-discipline and scenario anchors.
Book Value, ROE & Capital Returns
For a bank or insurer the cash-flow DCF is the wrong intrinsic anchor — capital is the product. Value is set by return on equity vs cost of equity against book value: the Gordon-justified multiple is P/B = (ROE − g) / (COE − g).
| Metric | Value |
|---|---|
| Book value / share | $115 |
| Return on equity (ROE) | 45.2% |
| Cost of equity (assumed) | 9.5% |
| Current P/B | 2.07x |
| Justified P/B (ROE-based) | 6.00x |
| Justified value / share | $688 (+189%) |
ROE of 45.2% comfortably clears the ~10% cost of equity — which is why a premium justified P/B of 6.00x (vs 2.07x current) is warranted. The justified value sits +189% vs spot; that gap, plus the credit / underwriting cycle in the scenarios, is the debate. The Monte Carlo and scenario PWEV carry the earnings (P/E) view; this block carries the book-value view.
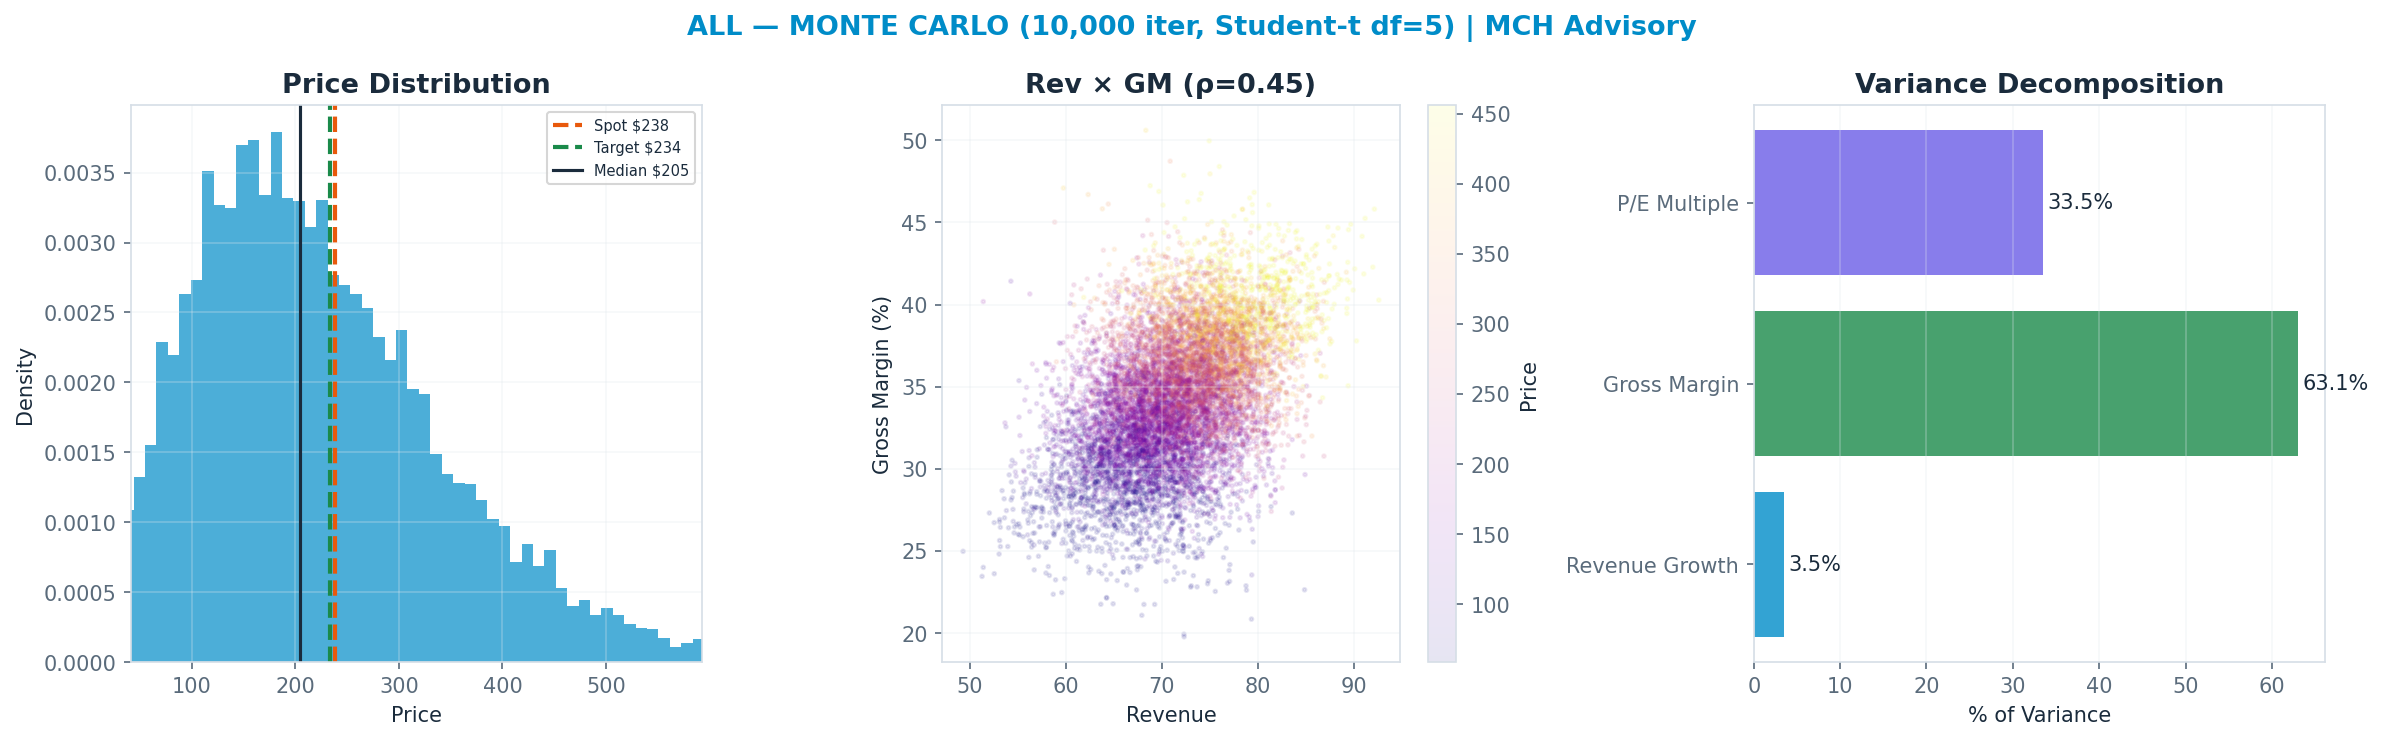
Monte Carlo — the distribution, not a point
10,000 paths, Student-t shocks (fat tails) with a regime-switching overlay. The median lands at $206 and 40% of paths finish above spot. The variance decomposition shows the gross margin is the dominant swing factor (63% of variance). The fundamental driver, not the multiple, sets the spread — a cleaner setup.
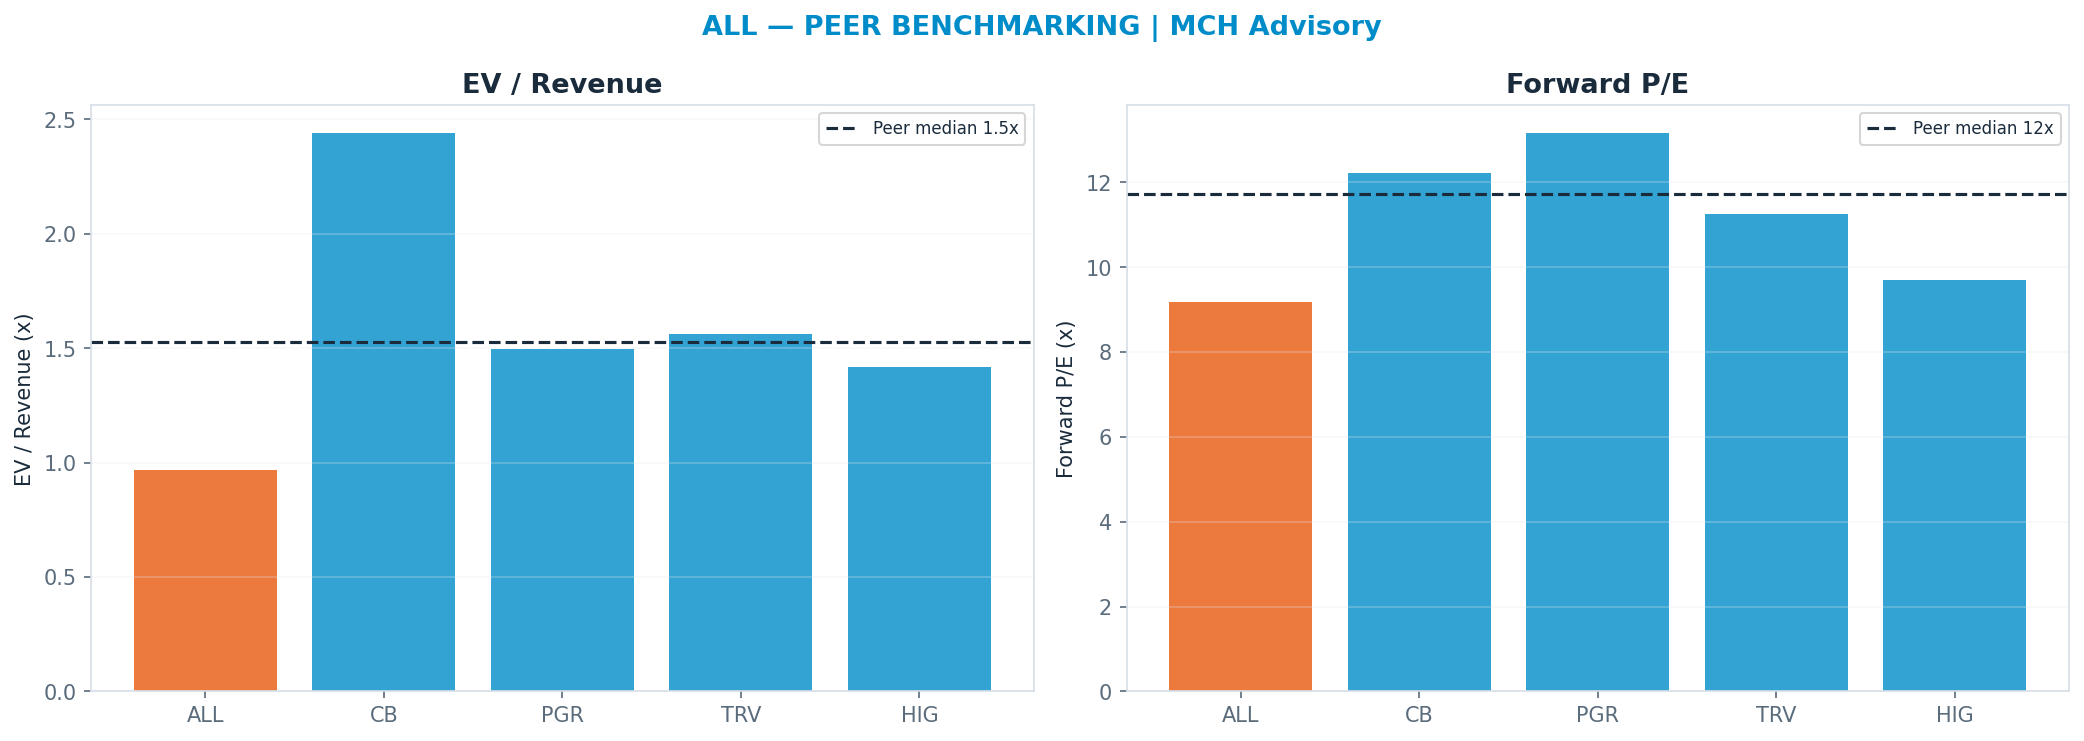
Peer benchmarking — relative value
Against the peer cohort, re-rating to the peer-median forward multiple (P/E 11.73x) implies $305. A premium is only justified by superior growth/margins; otherwise it is multiple risk. Weighted just 20% so the market's mood does not drive the fair value.
Across all anchors the spread is wide (genuine disagreement — low valuation confidence).
Revenue-Segment Breakdown
The company-specific drivers behind the valuation — each segment carries its own growth, margin, multiple and capex intensity. (Tags: FACT reported · ESTIMATE from disclosures · INFERENCE judgment.)
| Segment | Revenue | Mix | Growth | Op margin | Multiple | Capex % | Tag |
|---|---|---|---|---|---|---|---|
| Insurance (Underwriting + Float) | $68.2B | 100% | 5% | 11% | 9x | 1% | ESTIMATE |
Named Exposures
Demand & pricing cycle (FACT/ESTIMATE)
| Dimension | Assessment |
|---|---|
| driver | underwriting margin (combined ratio) + premium growth + float investment income + reserves |
| net_debt_or_cash_b | -6.79 |
Capital intensity & shareholder returns (ESTIMATE)
| Dimension | Assessment |
|---|---|
| capex_pct_revenue | 0.01 |
| div_yield | 0.0175 |
Structural risk vs optionality (INFERENCE)
| Dimension | Assessment |
|---|---|
| downside | underwriting / reserve / catastrophe reset |
| upside | hard market + pricing |
Industry Context — Financials — Insurers
This name sits in the Financials — Insurers as a insurer. underwriting margin (combined ratio) + premium growth + float investment income + reserves Its scenarios are not guessed in isolation — they inherit a single, shared view of the cluster's driver cycle, so the names that depend on the same event are mutually consistent.
Value chain: CB (insurer) · PGR (insurer) · TRV (insurer) · ALL (insurer) · AFL (insurer) · MET (insurer) · AIG (insurer) · PRU (insurer) · HIG (insurer) · ACGL (insurer) · CINF (insurer) · WRB (insurer) · PFG (insurer) · L (insurer) · EG (insurer) · GL (insurer) · AIZ (insurer)
| Shared state | Capex path | House view | This name implies |
|---|---|---|---|
| Underwriting / Reserve / Catastrophe Reset | 37% | 37% | |
| Mid-Cycle — Combined Ratio + Float | 35% | 35% | |
| Upside — Hard Market / Pricing | 28% | 28% |
On the cluster's key downside — Underwriting / Reserve / Catastrophe Reset () — this name implies 37% vs the cluster house view of 37% (in line with the house). The cluster's full cross-stock reconciliation governs that the names which ride the same capex cycle assign it comparable odds.
Structure: Shared State — The fin_insurers cycle is the shared macro driver. Driver — underwriting margin (combined ratio) + premium growth + float income + reserves Dispersion — Members differ by cyclicality (quality compounders vs deep cyclicals).
Load-Bearing Assumptions
No DCF anchor is meaningful for this asset; the blend leans 50% on probability-weighted scenarios and 30% on the Monte Carlo median — the scenario probabilities are the load-bearing inputs.
Reasons the Thesis Could Fail (Falsifiable)
A miss on Gross Margin drops the case toward the structural target $103.
Fact / Inference / Speculation
- FACT: Spot $238; 52-week range $185–$240; engine rating HOLD; base-case target $234 (-2%).
- INFERENCE: Triangulated FV $239 (+1%). Gross Margin explains 63% of Monte Carlo outcome variance — the single variable that decides which side is right.
- SPECULATION: At current prices the embedded bet is that Gross Margin surprises to the upside — Gross Margin carries 63% of outcome variance.
Recommendation: HOLD
Balanced: triangulated fair value $239 (+1% vs spot); the outcome hinges on Gross Margin. The debate is Gross Margin (63% of variance) — a fundamental call. SBC runs —M TTM (disclosed in the appendix).